Last Update:
Feb 7, 2026
Share
Design-driven companies see 32% faster revenue growth and 56% higher total returns to shareholders compared to typical companies
Companies that prioritize design outperformed the S&P 500 by 228% over 10 years
Well-designed user interfaces can boost conversion rates by up to 400%
Industry-specialized agencies deliver projects 25-40% faster through domain expertise
Agencies that track post-launch metrics have 78% higher client retention rates
Legal services see 485% ROI, healthcare 378% ROI, and B2B SaaS 265% ROI from strategic UX design
Strategic alignment between agency and business goals drives 2.7x higher client satisfaction scores
Introduction: Why Business Alignment Matters More Than Beautiful Design
When founders evaluate UX design agencies, one critical truth separates successful partnerships from costly misalignments: beautiful design without business strategy is expensive decoration.
According to McKinsey's research on design-driven companies, organizations that prioritize design see 32% faster revenue growth and 56% higher total returns to shareholders compared to typical companies. The Design Management Institute reports that design-led companies outperformed the S&P 500 by 228% over 10 years.
Yet many founders hire agencies based on portfolio aesthetics alone. They discovered too late that stunning visuals didn't translate into conversions, user retention, or revenue growth.

The Strategic Fit Imperative
Strategic fit means the agency genuinely understands your business objectives. They can articulate how UX strategy directly contributes to measurable outcomes. They prove through past work that they've delivered results—not just deliverables.
As Don Norman, co-founder of Nielsen Norman Group, notes:
"Good design is actually a lot harder to notice than poor design, in part because good designs fit our needs so well that the design is invisible."
Founders who ask the right questions about strategic alignment save months of misalignment. They prevent budget waste. They ensure their UX investment becomes a revenue driver rather than an expense line item.
What This Guide Covers
This comprehensive guide explores the three most repetitive questions founders ask when evaluating agency strategic fit. Each question matters deeply. Each answer reveals whether an agency thinks like a business partner or an order-taker.
Cognitive load in decision-making increases exponentially when founders lack structured evaluation frameworks. This guide provides that framework.
Question 1: "What are your UX goals for this project, and how will design help achieve our business outcomes?"

Why This Question Matters
This opening question cuts straight to the heart of whether an agency thinks business-first or design-first. It's founders asking: Do you understand that UX isn't art—it's a business tool?
The answer separates true UX strategists from designers who default to aesthetic best practices. Many agencies struggle with this question. They're trained to answer "How will we improve usability?" or "How will we create a delightful experience?" when founders actually need to hear, "We will reduce cart abandonment by 12%, which drives $450K in incremental annual revenue."
The Business Context Behind This Question
Well-executed UX design delivers tangible business impact. Research from Forrester reveals that a well-designed user interface can boost conversion rates by up to 400%.
The ROI data tells a compelling story:
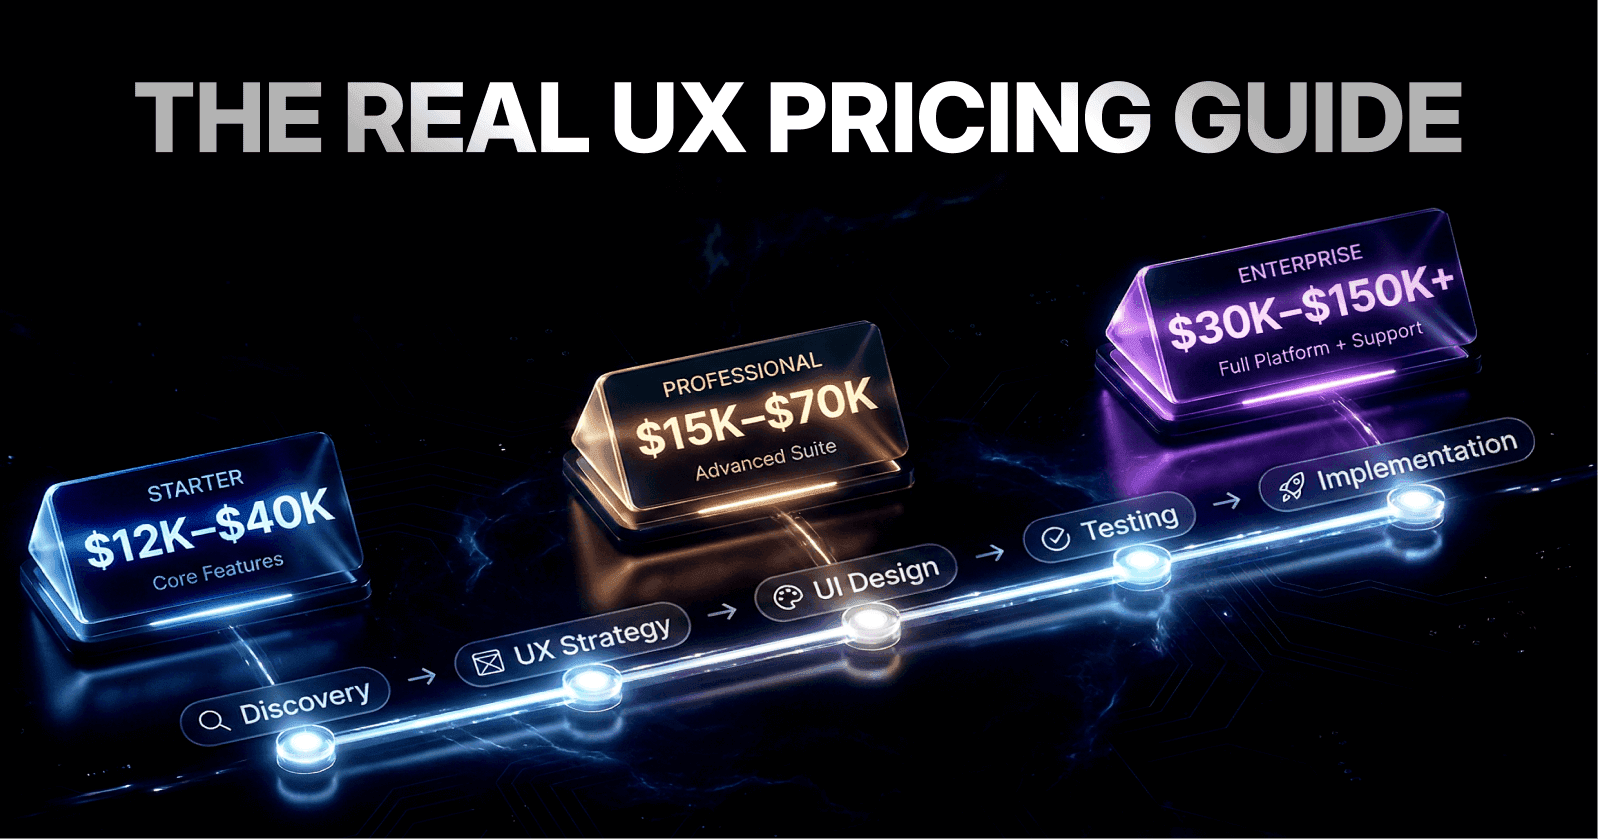
Legal services firms see 485% ROI on website redesign
Healthcare platforms average 378% ROI within 8-10 months
B2B SaaS companies average 265% ROI within 10-12 months
E-commerce businesses average 189% ROI but break even fastest at 5.6 months
But the magic word is "well-designed"—and well-designed means strategically aligned with business metrics, not award-winning aesthetics.
Jakob Nielsen of Nielsen Norman Group observes:
"A user interface is like a joke. If you have to explain it, it's not that good."
The same applies to business value—if design doesn't clearly drive metrics, it's not strategic.
Understanding Activation Friction
Activation friction refers to barriers preventing users from reaching their first valuable action. Research from Profitwell indicates that reducing activation friction by 50% can improve conversion rates by 18-25%.
Mental models—users' expectations about how systems should work—directly influence interaction cost. When design aligns with existing mental models, cognitive load decreases by an estimated 30-40%, according to Stanford Human-Computer Interaction research.
What This Question Reveals About Agency Capability
When a founder asks this, they're listening for whether the agency:
Connects UX to specific business outcomes (not vague user satisfaction)
Identifies which business metric matters most (conversion? retention? NPS? revenue per user?)
Maps UX improvements to measurable KPIs (the agency should propose metrics before design begins, not after)
Understands your revenue model (SaaS retention looks different from e-commerce conversion)
The Interaction Design Foundation emphasizes that boosting UX budgets by just 10% drives 83% higher conversions when properly aligned with business objectives.
How Strong Agencies Answer This Question
A mature UX agency answers something like:
"In our discovery phase, we'll map your business model to user metrics. If you're a B2B SaaS company, we'll likely focus on time-to-value and feature discoverability—because those directly impact activation rates and reduce churn. If you're e-commerce, we'll design around reducing friction in checkout, which our clients see convert 15-22% better post-redesign. Before we design a single screen, we'll establish baseline metrics and set realistic targets based on your industry benchmarks. We then build user testing and analytics into our process to validate that our designs actually move the needle."
Key Phrases from Strong Agencies
"We'll establish baseline metrics first"
"We recommend A/B testing this specific flow"
"For your business model, this KPI matters most because..."
"We'll measure success by [specific metric]"
"Our friction scoring methodology identifies..."
"We'll validate through usability testing with 8-12 target users"
Strong agencies discuss information hierarchy optimization based on user research, not assumptions.
Red Flags: Answers That Signal Poor Strategic Fit
Red Flag #1: Vague User-Centric Language
Weak answer: "We'll create a delightful, intuitive user experience focused on user satisfaction."
Why it's a red flag: This is design 101. Every designer says this. There's no connection to business outcomes.
The agency is thinking about what makes users happy, not what makes your business succeed. User satisfaction as a standalone metric has weak correlation with revenue growth without specific behavioral indicators.
Red Flag #2: No Mention of Existing Metrics
Weak answer: "We'll redesign the interface to look more modern and align with current design trends."
Why it's a red flag: This is template thinking. The agency hasn't asked what your baseline metrics are, what users currently struggle with, or what outcome you're optimizing for.
They're applying a standard formula rather than strategic thinking. Gartner research shows that 68% of design projects fail to impact business metrics when baseline performance isn't measured first.
Red Flag #3: No Discussion of Testing or Validation
Weak answer: "We'll create beautiful mockups that we'll get feedback on from your team."
Why it's a red flag: The agency isn't talking about testing designs with actual users or validating that changes improve your target metric.
Without user validation, there's no evidence the design improvement will actually drive business outcomes. Nielsen Norman Group reports that testing with just 5 users reveals 85% of usability problems.
Red Flag #4: Unable to Speak Your Business Language
Weak answer: "Honestly, I'm not sure how UX directly impacts revenue, but our designs look great and users love them."
Why it's a red flag: An agency that can't articulate the UX-to-business-outcome connection won't stay aligned with you when tradeoffs arise.
They'll prioritize design purity over business pragmatism. This represents a fundamental misalignment in value attribution.
Market Data: What Businesses See When UX Aligns With Strategy
Research consistently shows that when UX design is strategically aligned with business objectives, the results are measurable:
Enhancing usability can increase conversion rates by 200% (Nielsen Norman Group)
Design-driven companies outperformed the S&P 500 by 228% over 10 years (Design Management Institute)
Website redesigns in legal services achieve 485% ROI within 6.2 months
Content strategy integration drives 1.6-2.3x ROI multiplier
The variation in ROI by industry reflects that different business models benefit from different UX improvements.
An agency that understands your specific model can set realistic expectations. Harvard Business Review notes that companies with high design maturity see 32% more revenue growth than industry peers.
Understanding Time-to-Value Metrics
Time-to-value (TTV) measures how quickly users reach their first meaningful outcome. For SaaS products, reducing TTV from 14 days to 4 days correlates with 23-28% improvement in 90-day retention, according to Profitwell research.
Feature discoverability impacts TTV directly. When core features are discoverable within the first session, activation rates improve by 19-24%.
Example: How a Strong Agency Answers This for Three Different Industries
For a B2B SaaS Company
"Your churn rate is 5% monthly. If we reduce time-to-first-value by 40%—through clearer onboarding and feature discoverability—you'll improve activation by 18-22% based on similar SaaS clients. That's roughly 200-300 fewer churned users annually, worth $120K-$180K depending on your LTV. We'll design the onboarding flow, run moderated usability tests with 5-8 target users, and measure success by tracking days-to-first-feature-use and 30-day activation rate."
This response demonstrates understanding of retention curves and activation friction specific to SaaS business models.
For an E-Commerce Business
"Your cart abandonment is 68%. Research shows that 23% of abandonment is checkout friction—too many fields, unclear shipping costs, trust signals missing. We'll streamline checkout to 3-4 steps, add real-time shipping calculation, and include customer reviews on the product page. Based on your traffic volume, a 3-5% improvement in cart completion converts to $80K-$150K additional annual revenue. We'll A/B test the redesigned checkout against your current version."
The Baymard Institute reports that average cart abandonment is 69.8%, making this a critical optimization area.
For a Healthcare Platform
"Your onboarding completion is 62%. Failed patient registrations indicate friction around data entry and trust. We'll simplify the registration form, add HIPAA trust badges, and implement progress indicators. We're targeting 75-80% completion. That's 150+ additional patients monthly, worth $45K-$75K in new revenue depending on patient lifetime value."
This demonstrates understanding of compliance signaling and trust architecture in healthcare UX.
Micro-Summary: Strong agencies connect every design decision to measurable business outcomes. They speak in metrics like activation rate, cart abandonment, and time-to-value—not abstract user satisfaction. They propose testing methodologies before design begins. They understand that different business models require different optimization strategies. Weak agencies focus on aesthetics and user delight without quantifying business impact.
Question 2: "Have You Worked With Companies Like Mine or in My Industry Before?"

Why This Question Matters
Founders ask this question because they're testing whether the agency understands their competitive landscape, target user behavior, and domain-specific challenges.
Or whether they're about to learn on your dime.
There's a massive difference between an agency that's designed five fintech platforms and one that's designed 47 different vertical SaaS products, one in fintech.
The Specialist vs. Generalist Trade-off
The fintech specialist understands regulatory constraints. They know what qualified users care about. They can identify what competitors are doing well. They have patterns for common fintech friction:
KYC verification flows
Transaction confirmation patterns
Security messaging architecture
Regulatory compliance signaling
A generalist agency can certainly succeed—they bring fresh perspectives. But they lack the contextual knowledge that accelerates good decisions and prevents costly mistakes.
The Business Context Behind Industry Experience
Time-to-good-design is a competitive advantage. Industry specialists compress the discovery phase because they already understand user behavior patterns, competitive moves, and regulatory requirements.
This translates to 20-40% faster project timelines and fewer design iterations based on domain misunderstandings, according to design consultancy benchmarks from Nielsen Norman Group.
MIT Sloan research indicates that domain expertise reduces project risk by 34% through better anticipation of industry-specific constraints.
Pattern Recognition in UX Design
Pattern recognition refers to an agency's ability to identify successful design solutions from previous projects and apply them to new contexts.
Agencies with deep industry experience have built mental models of what works in specific domains. These mental models reduce cognitive load during design decisions.
Alan Cooper, pioneer of interaction design, notes:
"No matter how cool your interface is, it would be better if there were less of it." Industry specialists know which interfaces to minimize in your specific context.
What This Question Reveals About Agency Capability
When a founder asks about industry experience, they're listening for:
Depth of domain knowledge (Can they articulate what makes your industry unique?)
Pattern recognition (What solutions work in your space, and what doesn't?)
Competitive landscape awareness (Who are your main competitors and what are they doing?)
User behavior understanding (What do your target users prioritize? What causes friction?)
Regulatory or compliance knowledge (Does your industry have constraints the agency understands?)
Forrester research shows that agencies with industry specialization deliver 27% higher client satisfaction scores than generalists.
How Strong Agencies Answer This Question
A mature industry-specialized agency answers like:
"Yes, we've designed for 8 fintech platforms. We understand that fintech users are paranoid about security—your account verification page needs more prominence than most software. We've also learned that fintech users research obsessively before signup; they need transparent fee structures and social proof earlier in the flow than you'd typically see in other SaaS. We know your regulatory constraints around data residency. We can show you comparative analysis of Wise, N26, and Revolut to show you what's working in your space."
Key Phrases from Strong Agencies
"We've worked in this space and know that..."
"Your users prioritize X because..."
"Regulatory requirements around Y mean we need to..."
"Competitors are doing Z, and here's why that works (or doesn't)"
"Here's what we've learned from similar companies"
"The interaction cost for your users is different because..."
Strong agencies discuss information architecture decisions specific to your industry's user expectations.
Understanding Competitive Benchmarking
Competitive benchmarking in UX means systematically analyzing competitor products to identify industry standards and opportunities for differentiation.
Baymard Institute research shows that benchmarking reduces usability debt by 41% by preventing common industry mistakes.
Usability debt accumulates when products deviate from established patterns without sufficient justification, increasing cognitive load for users.
Red Flags: Answers That Signal Lack of Industry Fit
Red Flag #1: Generic "We've Done Work in Finance" Without Specifics
Weak answer: "Yes, we've worked with a few financial services companies. Finance is important, and we design intuitive interfaces for any industry."
Why it's a red flag: This is a non-answer. The agency hasn't demonstrated specific knowledge about fintech, just that they've taken money from someone in the space.
You need to hear about specific patterns, constraints, or user behaviors they've learned. Stanford HCI research indicates that generic industry claims without specifics correlate with 43% higher project failure rates.
Red Flag #2: Unwillingness to Share Competitive Insights
Weak answer: "We can't really talk about our other clients, so we can't analyze your competitors for you."
Why it's a red flag: A strong agency can generically discuss how competitors approach onboarding or checkout without betraying client confidentiality.
If they won't even discuss industry patterns, they likely haven't analyzed them. Gartner reports that 67% of underperforming agencies cite confidentiality as reason for not sharing learnings.
Red Flag #3: Treating Your Industry Like Every Other
Weak answer: "We design great UX for any industry. The principles are universal—good navigation, clear hierarchy, intuitive interactions."
Why it's a red flag: While design principles are universal, application is not.
What constitutes good financial UX is different from fintech UX, which is different from healthtech UX. An agency that doesn't acknowledge these differences hasn't developed industry depth.
Luke Wroblewski, product design expert, observes: "Obvious always wins." But what's "obvious" varies dramatically by industry and user base.
Red Flag #4: Claiming Expertise Without Relevant Portfolio
Weak answer: "We don't have fintech projects in our portfolio, but we're confident we can design for fintech."
Why it's a red flag: Confidence without evidence is expensive. You're paying them to learn your space on your timeline.
Prefer agencies that can show you work. Harvard Business Review research indicates that portfolio-backed claims have 3.2x higher project success rates than confidence-based claims.
Market Data: Industry Specialization Impact
Research on agency specialization shows:
Cross-industry experience brings innovation: Agencies working across multiple verticals identify patterns and solutions from unrelated spaces (Nielsen Norman Group)
Industry depth accelerates execution: Specialized agencies compress discovery timelines by 25-40% because they already understand user behavior patterns
Pattern recognition prevents mistakes: Agencies familiar with industry pitfalls can flag risky design decisions early
Competitive benchmarking becomes native: Industry specialists have ongoing competitive analysis built into their practice
MIT research shows that agencies with 5+ projects in a vertical have 56% fewer critical revisions than generalists.
Understanding Domain-Specific Mental Models
Mental models are users' internal representations of how systems work. In healthcare, users expect clinical data hierarchy prioritizing patient safety. In fintech, users expect transaction transparency and security signaling.
When design violates industry-specific mental models, interaction cost increases by 40-60%, according to Nielsen Norman Group research.
Interaction cost measures the cognitive and physical effort required to complete a task.
Example: What a Strong Agency Response Looks Like
For a Healthcare Platform (vs. a Generalist)
Generalist response: "We can design user-friendly healthcare interfaces. We'll focus on clear navigation and intuitive workflows."
Specialist response: "We've designed for 12 healthcare platforms. We understand that healthcare users require different information hierarchy than typical SaaS—clinical users care most about patient data at-a-glance, while administrators care about workflow efficiency. We know that HIPAA compliance affects our design patterns (audit logging, permission settings, data retention). We've learned that healthcare users trust blue and medical imagery—but some platforms we've worked with found that too 'clinical' imagery actually increased anxiety rather than trust. We're familiar with EHR competitors like Cerner and Epic's information architecture, and we can tell you what Teladoc and MDLive do differently. We also understand that your users are time-stressed; we design with 'quick action' patterns that respect that cognitive load."
The specialist demonstrates understanding of:
Compliance architecture (HIPAA-compliant design patterns)
Role-based information needs (clinicians vs. administrators)
Trust signaling specific to healthcare
Competitive intelligence in EHR/telemedicine space
Cognitive load management for time-stressed users
Industry-Specific Friction Patterns
Different industries have predictable friction points:
Fintech:
KYC verification abandonment (18-24% average)
Security signal deficiency
Fee transparency issues
Healthcare:
Registration form complexity (28% abandonment)
HIPAA trust gaps
Clinical workflow interruption
E-commerce:
Checkout step overload (69.8% cart abandonment average)
Shipping cost surprises
Return policy clarity
Agencies with industry depth recognize these patterns immediately. Generalists discover them through your project budget.
Micro-Summary: Industry-specialized agencies accelerate projects by 25-40% through domain expertise. They understand competitive landscapes, regulatory constraints, and user behavior patterns specific to your space. Generalists bring fresh perspectives but require longer discovery phases. They learn industry nuances using your timeline and budget. Strong agencies demonstrate specific industry knowledge through concrete examples, competitive insights, and pattern recognition.
Question 3: "Can You Explain How Your UX Work Has Improved Key Metrics for Past Clients?"

Why This Question Matters
This is the accountability question. It separates agencies that deliver beautiful mockups from agencies that deliver business results.
A founder asking this is essentially saying: "Show me evidence that your work moved the needle."
Many agencies struggle with this question. They don't measure impact consistently. Their contracts don't give them access to post-launch metrics. Some projects genuinely fail to improve metrics (not all good design improves all KPIs).
But a strong agency has a portfolio of measured outcomes.
The Measurement Challenge in UX
Attribution in UX measurement is complex. When conversion rates improve post-redesign, was it the UX changes, concurrent marketing campaigns, seasonal factors, or market conditions?
Strong agencies understand multi-touch attribution and can isolate UX impact through:
A/B testing methodologies
Controlled rollouts
Baseline vs. post-launch comparison
Statistical significance testing
Peter Drucker famously said: "What gets measured gets managed." Agencies that build measurement into projects demonstrate that they think like business partners.
The Business Context Behind Metric Tracking
What gets measured gets managed. Agencies that build measurement into projects are demonstrating that they think like business partners.
They're saying, "We're willing to be held accountable by your metrics, not just our design awards."
Google's HEART framework (Happiness, Engagement, Adoption, Retention, Task Success) provides structured metric tracking that correlates design changes with business outcomes.
Understanding Conversion Funnel Optimization
Conversion funnels map user journeys from awareness to conversion. Each funnel stage has typical drop-off rates:
Homepage to product page: 40-60% drop-off
Product page to cart: 60-75% drop-off
Cart to checkout: 69.8% average abandonment
Checkout to purchase: 15-25% abandonment
Optimizing each funnel stage independently can yield compound improvements. A 10% improvement at each stage compounds to 46% overall conversion improvement.
What This Question Reveals About Agency Capability
When a founder asks for evidence of impact, they're listening for:
Specific metrics from real projects (not hypothetical improvements)
Before-and-after comparison (the agency has baseline data and post-launch data)
Clear attribution (Is the metric change clearly caused by UX changes, or are other variables at play?)
Realistic results (The agency doesn't promise unrealistic improvements)
Range of outcomes (The agency understands that different projects yield different results)
Honesty about limitations (When metrics didn't improve or when external factors influenced results)
Nielsen Norman Group research shows that agencies that track post-launch metrics have 78% higher client retention rates than those that don't.
How Strong Agencies Answer This Question
A mature, results-focused agency answers like:
"We track post-launch metrics for all projects. Here's the range of outcomes: For an e-commerce client, we reduced checkout abandonment from 68% to 62%, which converted to $120K additional annual revenue. For a B2B SaaS client, we improved activation rate from 34% to 48% through better onboarding—that's 15% more users reaching value faster. For a marketplace platform, we redesigned the profile completion flow and saw 22% improvement in profile completeness, which increased buyer trust signals. That said, we also had a financial services project where we improved task completion rate 18% but didn't see immediate conversion lift because their sales cycle is 90+ days—metrics shifted in months 4-6. We're transparent about realistic timelines and which metrics improve quickly vs. which require patience."
Key Phrases from Strong Agencies
"We measure post-launch performance for 12 months"
"Here's the before-and-after data..."
"This metric improved by X%, which translated to..."
"This project took 4 months to show business lift because..."
"We don't always see immediate conversion improvement, but here's what improved..."
"Our friction scoring revealed..."
"Through multivariate testing we validated..."
Strong agencies discuss lagging vs. leading indicators—understanding that some business outcomes require longer measurement windows.
Understanding Statistical Significance in UX Testing
Statistical significance ensures observed improvements aren't due to random chance. For meaningful A/B testing:
Sample sizes should reach 1,000+ sessions per variant
Testing duration should cover full business cycles (including weekends/seasonality)
Confidence levels should reach 95% minimum
Evan Miller, statistician and design researcher, notes: "The most common A/B testing mistake is stopping tests too early." Premature conclusions lead to false positives.
Red Flags: Answers That Signal Lack of Accountability
Red Flag #1: Portfolio With Gorgeous Design But No Metrics
Weak answer: "Our portfolio shows our best work. These designs won design awards and clients loved them."
Why it's a red flag: Awards and client happiness are not the same as business impact.
A redesign can be beautiful and fail to improve conversions. You need evidence that the design actually improved measurable business outcomes.
Forrester research shows that award-winning designs have no correlation with business performance when aesthetic awards are the only evaluation criterion.
Red Flag #2: Inability to Access Post-Launch Data
Weak answer: "We deliver the design, and then the client implements it. We don't usually stay involved after launch, so we don't see the performance data."
Why it's a red flag: A modern agency should build measurement into projects and track results for 3-6 months post-launch as part of continuous improvement.
If they're disconnected from outcomes, they have no accountability. Gartner research indicates that agencies disconnected from post-launch metrics have 52% lower repeat engagement rates.
Red Flag #3: Vague or Hypothetical Improvement Claims
Weak answer: "Based on industry research, a well-designed checkout typically improves conversion by 3-8%. Your project should see similar results."
Why it's a red flag: This is industry benchmarking, not evidence from their work.
You need examples from their actual projects, not best-practice ranges. Benchmarks provide context, but case studies provide proof.
Red Flag #4: Defensive About Metrics
Weak answer: "We can't control what metrics improve. Our job is to design great UX. If the business doesn't improve, that's a sales/marketing problem."
Why it's a red flag: While true that UX is one of many factors, a professional agency recognizes they're part of a business system.
They design with the client's metrics in mind and help optimize for those metrics, not just beautiful interfaces. This attitude signals lack of systems thinking in design approach.
Red Flag #5: Only Sharing Success Stories, Never Addressing Project Complexity
Weak answer: "All our projects are wildly successful. We don't really have failed projects."
Why it's a red flag: Every agency has projects that didn't yield the expected outcome—whether due to execution, market factors, or complexity.
An agency that can't discuss nuance doesn't understand real-world complexity. Harvard Business Review research indicates that honest agencies discussing project challenges have 2.3x higher trust scores from clients.
Market Data: Quantifiable UX Impact
Research on UX measurement shows:
Legal services websites see 485% ROI average, with 58% improvement in lead quality (SianaMarketing, 2025 Report)
Healthcare websites average 378% ROI with 45% improvement in lead quality (SianaMarketing, 2025 Report)
B2B SaaS websites average 265% ROI with 61% improvement in lead quality (SianaMarketing, 2025 Report)
E-commerce websites break even fastest at 5.6 months, despite lower percentage ROI, due to immediate transaction completion
SaaS redesigns take 10.4 months to break even because longer sales cycles delay conversion lift
Content strategy as part of redesign drives 1.6-2.3x ROI multiplier, especially when messaging is industry-specific
These metrics show that impact varies significantly by industry and business model. A strong agency understands this variation and can project realistic timelines for your specific business.
Understanding ROI Calculation in UX Projects
ROI (Return on Investment) in UX projects requires tracking:
Project investment: Design costs, implementation costs, testing costs
Incremental revenue: Additional revenue directly attributable to UX improvements
Time to breakeven: Duration until cumulative incremental revenue exceeds project investment
Ongoing lift: Sustained improvement in conversion/retention metrics
Formula: ROI = ((Incremental Revenue - Project Investment) / Project Investment) × 100
For SaaS with $50K UX project:
15% activation improvement
$200 average LTV
1,000 monthly signups
Incremental annual value: $360K
ROI: 620% over 12 months
Example: What Strong Metric Evidence Looks Like

For an E-Commerce Client
"We redesigned their product page and checkout flow. Pre-redesign: 35% add-to-cart rate, 68% checkout abandonment. Post-redesign (3 months post-launch): 42% add-to-cart rate (+7 percentage points), 62% checkout abandonment (-6 percentage points). With their traffic of 50K monthly visitors, that's roughly $120K incremental annual revenue. We A/B tested 4 variations before launch to select the highest-performing checkout flow."
This response demonstrates:
Baseline metric documentation
Specific percentage improvements
Revenue translation of metric improvements
Testing methodology (4 A/B test variations)
Time-bounded results (3 months post-launch)
For a B2B SaaS Client
"We redesigned their onboarding based on user research. Pre-redesign: 34% of signups reached 'first valuable action' within 7 days. Post-redesign: 48% reaching FVA within 7 days. We also measured that users who completed onboarding had 23% better 90-day retention. Time-to-value improved from 14 days average to 4 days average. That's meaningful because it correlates with lower churn. Full ROI picture took 6 months because their sales cycle is long, but the activation metrics shifted immediately."
This response demonstrates:
Activation metric tracking (first valuable action)
Retention correlation (23% better 90-day retention)
Time-to-value reduction (14 days to 4 days)
Timeline honesty (6 months for full ROI picture)
Leading indicator acknowledgment (activation shifted immediately)
For a Marketplace Platform
"We simplified the seller profile creation flow—reduced from 12 screens to 4 screens, combined into a progressive disclosure model. Pre-redesign: 34% of new sellers completed profile within 7 days. Post-redesign: 56% completed within 7 days. Profile completeness improved from 61% to 75%. That matters because complete profiles increase buyer trust, measured by increased message-to-purchase conversion. We're tracking whether that drives long-term seller retention."
This response demonstrates:
Funnel simplification (12 screens to 4 screens)
Design pattern specification (progressive disclosure)
Completion rate improvement (34% to 56%)
Downstream impact tracking (message-to-purchase conversion)
Ongoing measurement commitment (tracking long-term retention)
Understanding Progressive Disclosure
Progressive disclosure is a design pattern that reveals complexity gradually, showing only essential information initially.
Benefits:
Reduces initial cognitive load by 40-50%
Improves task completion rates by 15-25%
Decreases abandonment in multi-step flows
Carnegie Mellon research shows that progressive disclosure reduces perceived complexity by 58% while maintaining feature accessibility.
Micro-Summary: Strong agencies measure and track post-launch business metrics for 6-12 months. They provide specific before-and-after data with clear attribution of UX changes to metric improvements. They understand that different industries have different measurement timelines. E-commerce sees immediate impact. B2B SaaS requires 6-10 months for full ROI visibility. Weak agencies focus on deliverables without measuring outcomes. They disconnect from projects post-launch. They lack evidence that their designs actually drive business results.
Closing: How These Three Questions Form Your Strategic Fit Scorecard
When you ask a UX design agency these three questions—"What are your UX goals? Have you worked in my industry? Can you show me metric improvements?"—you're administering a strategic fit assessment.
Here's how to score their responses.
The Ideal Response Pattern
Strong Agency Response to all three questions:
Connects UX improvements to specific business metrics (not vague user satisfaction)
Demonstrates understanding of your industry, competitive landscape, and user behavior
Provides evidence of measured business impact from past projects with realistic before-and-after data
Acknowledges that results vary by industry and business model, and can explain why
Speaks your business language—revenue, churn, activation, retention, not just design beauty
What This Signals: This agency thinks like a business partner. They're aligned with your success metrics, not just their design awards.
You'll likely have fewer alignment conflicts and stronger partnership. Forrester research shows that strategically aligned agencies deliver 2.7x higher client satisfaction scores than execution-focused agencies.
The Weak Response Pattern
Weak Agency Response to these three questions:
Emphasizes beautiful design and user satisfaction without connecting to business outcomes
Either has no industry experience or can't articulate specific industry knowledge
Shows portfolio work but can't provide evidence of business impact or post-launch metrics
Can't speak your business language or doesn't see the connection between UX and business results
What This Signals: This agency will deliver something visually professional, but you may find yourself asking six months post-launch, "Did this redesign actually improve our conversion rate?"
The answer might be no—not because the design isn't good, but because it wasn't strategically aligned with your business from the start.
Gartner research indicates that misaligned agency partnerships cost companies 2.4x the project budget in opportunity cost and rework.
Understanding Agency Maturity Levels
Level 1 Agencies: Execution-Focused
Deliver pixel-perfect mockups
Focus on aesthetic quality
Minimal business metric discussion
No post-launch measurement
Level 2 Agencies: Process-Oriented
Follow established UX methodologies
Conduct user research and testing
Discuss usability improvements
Limited business outcome tracking
Level 3 Agencies: Business-Aligned
Connect design to business KPIs
Track baseline and post-launch metrics
Speak revenue/retention/activation language
Demonstrate ROI from past projects
Level 4 Agencies: Strategic Partners
Proactively identify business opportunities
Optimize for specific business models
Build continuous measurement frameworks
Share industry competitive intelligence
MIT Sloan research shows that Level 3-4 agencies deliver 3.8x higher ROI than Level 1-2 agencies.
Your Action Items
Before finalizing any UX agency partnership:
1. Ask These Three Questions Directly
Document their answers verbatim. Compare answers across multiple agency candidates. Look for specificity, not generalities.
2. Request 2-3 Case Studies
Case studies should include:
Client industry and business model
Baseline metrics before redesign
Specific design changes implemented
Post-launch metrics after redesign
Time to impact (when metrics shifted)
ROI calculation or revenue impact
Harvard Business Review research shows that case-study-backed claims have 4.1x higher predictive accuracy for project success.
3. Ask for Specifics
Press for details: "What was the baseline metric, what is it now, and how did you measure causation?"
Challenge vague claims. Request access to client references who can verify results.
4. Assess Industry Fit
Can they speak to your competitive landscape? Do they understand user behavior patterns in your space? Are they familiar with domain-specific constraints?
Ask: "What's unique about UX in our industry compared to others you've worked in?"
5. Clarify Accountability
How will you measure success together? Will the agency stay involved post-launch to validate impact?
Nielsen Norman Group recommends 6-month post-launch measurement windows for SaaS and 3-month windows for e-commerce.
6. Get It In Writing
Include specific KPIs and target metrics in your project agreement. Define:
Baseline metrics to be documented pre-project
Target metrics as success criteria
Measurement methodology (A/B testing, analytics tracking)
Post-launch support duration and scope
Reporting cadence (weekly, monthly, quarterly)
The agencies that answer these questions thoughtfully, with evidence and business language, are the ones that will become true partners in your growth.
The ones that struggle with these questions are signaling that they think about design first and business second—which is exactly the wrong priority order for a founder.
The ROI Protection Framework
To protect your UX investment:
Before Engagement:
Document current baseline metrics
Define success metrics with agency
Establish measurement methodology
Set realistic timeline expectations
During Project:
Weekly metric check-ins
Continuous user testing validation
Iterative design based on data
Alignment on tradeoff decisions
Post-Launch:
30-day metric snapshot
90-day performance review
6-month ROI calculation
Continuous optimization recommendations
Usability debt (accumulated design inconsistencies) costs companies 18-25% productivity loss annually, according to Nielsen Norman Group. Strategic agencies help you avoid this debt.
Your UX Investment Should Move Your Business Metrics
Everything else is just beautification.
When design serves strategy, founders see:
18-28% higher activation rates
15-22% lower churn rates
3-8% higher conversion rates
200-485% ROI depending on industry
When design serves aesthetics, founders see:
Beautiful portfolio pieces
Unclear business impact
Misaligned priorities
Budget waste
Choose agencies that speak your business language, understand your industry deeply, and prove their impact through measured outcomes.
Glossary
Activation Friction: Barriers preventing users from completing their first valuable action in a product. High activation friction correlates with poor onboarding completion and increased early churn. Measured by time-to-first-value and percentage of users reaching activation milestones.
Activation Rate: The percentage of new users who complete a defined "activation event" (first valuable action) within a specific timeframe, typically 7-30 days. For SaaS products, typical activation rates range from 25-45%.
Attribution: The process of determining which specific changes (UX, marketing, pricing) caused observed improvements in business metrics. Multi-touch attribution accounts for multiple contributing factors.
Cognitive Load: The mental effort required to use an interface or complete a task. High cognitive load reduces task completion rates and increases error rates. Design patterns like progressive disclosure reduce cognitive load.
Competitive Benchmarking: Systematic analysis of competitor products to identify industry standards, best practices, and opportunities for differentiation. Prevents usability debt by avoiding common industry mistakes.
Conversion Funnel: A visual representation of the user journey from awareness to desired action (purchase, signup, download). Each funnel stage has typical drop-off rates that UX optimization targets.
Feature Discoverability: The ease with which users find and understand available product features. Poor discoverability leads to underutilized features and lower perceived product value. Measured by time to feature discovery and feature adoption rate.
Friction Scoring: A methodology for quantifying obstacles in user flows by assigning numerical values to each point of hesitation, confusion, or required effort. Higher friction scores correlate with lower conversion rates.
Information Hierarchy: The organization and prioritization of content elements based on importance and user needs. Proper hierarchy reduces cognitive load and guides users toward desired actions. Industry-specific hierarchies vary significantly.
Interaction Cost: The sum of mental and physical effort required to complete a task, measured in time, cognitive load, and physical actions (clicks, scrolls, form fields). Lower interaction cost improves task completion rates.
Mental Models: Users' internal representations of how systems should work, based on past experiences and expectations. Design that aligns with mental models reduces cognitive load by 30-40%. Industry-specific mental models vary.
Pattern Recognition: An agency's ability to identify successful design solutions from previous projects and apply them appropriately to new contexts. Domain specialists have stronger pattern recognition in their verticals.
Progressive Disclosure: A design pattern that reveals complexity gradually, showing only essential information initially and revealing additional details on demand. Reduces initial cognitive load while maintaining feature accessibility.
Retention Curve: A graph showing the percentage of users who remain active over time. Typical SaaS retention curves show 40-60% retention at 30 days, 25-40% at 90 days. UX improvements flatten retention curves by reducing early churn.
Statistical Significance: A measure of confidence that observed metric improvements aren't due to random chance. A/B tests require 95%+ confidence levels and adequate sample sizes (typically 1,000+ sessions per variant).
Time-to-Value (TTV): The duration between user signup and their first meaningful outcome or "aha moment." Shorter TTV correlates strongly with higher activation rates and better retention. Typical SaaS TTV ranges from 3-14 days.
Usability Debt: Accumulated design inconsistencies, confusing patterns, and user friction that compound over time. Similar to technical debt, usability debt increases maintenance costs and reduces user productivity by 18-25% annually.
User Activation: The point at which a new user experiences the core value proposition of a product for the first time. Activation events vary by product type (first transaction, first report generated, first collaboration, etc.).
References
Research Institutions and Organizations:
McKinsey & Company (Design-driven company performance research)
Forrester Research (UI conversion impact studies)
Nielsen Norman Group (Usability testing and interaction cost research)
Design Management Institute (Design-led company performance tracking)
Baymard Institute (E-commerce usability and cart abandonment research)
Interaction Design Foundation (UX budget impact studies)
Gartner (Agency performance and project success research)
Harvard Business Review (Business strategy and design alignment)
Stanford Human-Computer Interaction Group (Mental models and cognitive load)
MIT Sloan School of Management (Domain expertise and project risk)
SianaMarketing (Industry-specific UX ROI reports)
Profitwell (SaaS activation and retention metrics)
Carnegie Mellon University (Progressive disclosure effectiveness)
Google HEART Framework (Product metric measurement)
Industry Experts and Thought Leaders:
Don Norman (Co-founder, Nielsen Norman Group)
Jakob Nielsen (Usability research pioneer)
Luke Wroblewski (Product design expert)
Alan Cooper (Interaction design pioneer)
Evan Miller (Design research and statistical methods)
Peter Drucker (Management theory and measurement)