Last Update:
Dec 16, 2025
Share
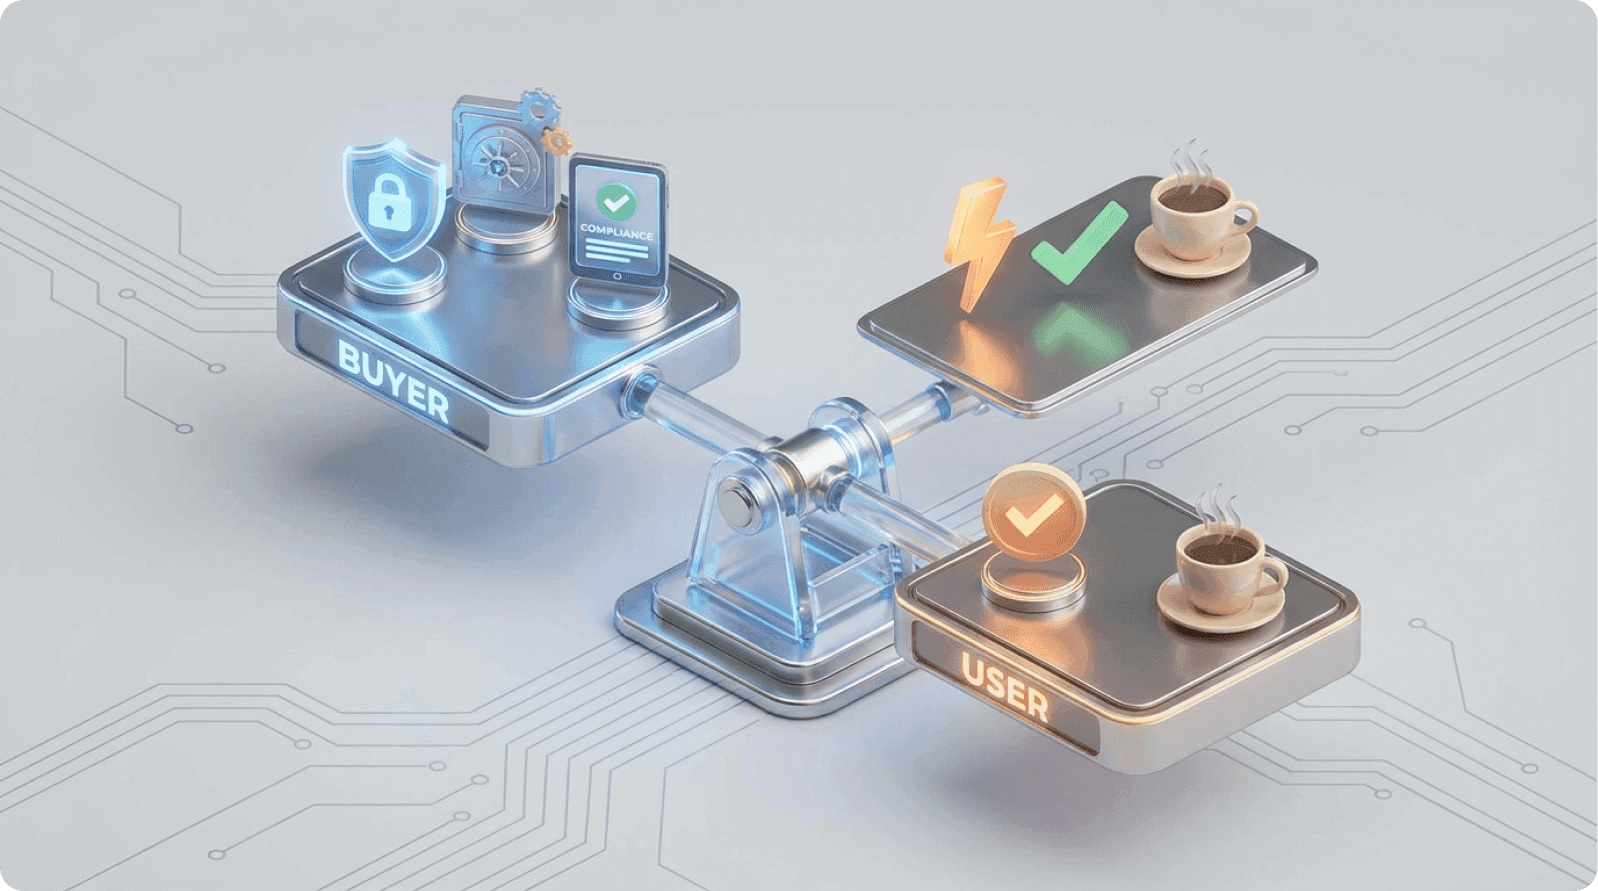
In B2B SaaS, buyers and end-users optimize for different outcomes—buyers care about risk, ROI, and compliance; users care about speed, simplicity, and getting work done
Designing only for decision-makers leads to poor adoption, higher support costs, and faster churn
Low user adoption isn't a UX problem alone—it's a revenue problem that affects retention, expansion, and CAC efficiency
Ease of use drives adoption, even in enterprise products; complexity increases cognitive load and resistance
The biggest UX failures happen during onboarding, where buyer expectations meet end-user reality
Role-based design and progressive disclosure allow enterprise capability without overwhelming daily users
Usability debt compounds over time, creating operational drag through support tickets, license waste, and longer sales cycles
Continuous testing with real end-users uncovers adoption blockers that internal teams and demos miss
Involving end-users earlier—through experience-first procurement and validation—reduces first-year adoption failure
Aligning buyer needs with user experience is not a trade-off; it's a competitive advantage that improves retention and ROI
Introduction: The Silent Crisis in B2B Product Development
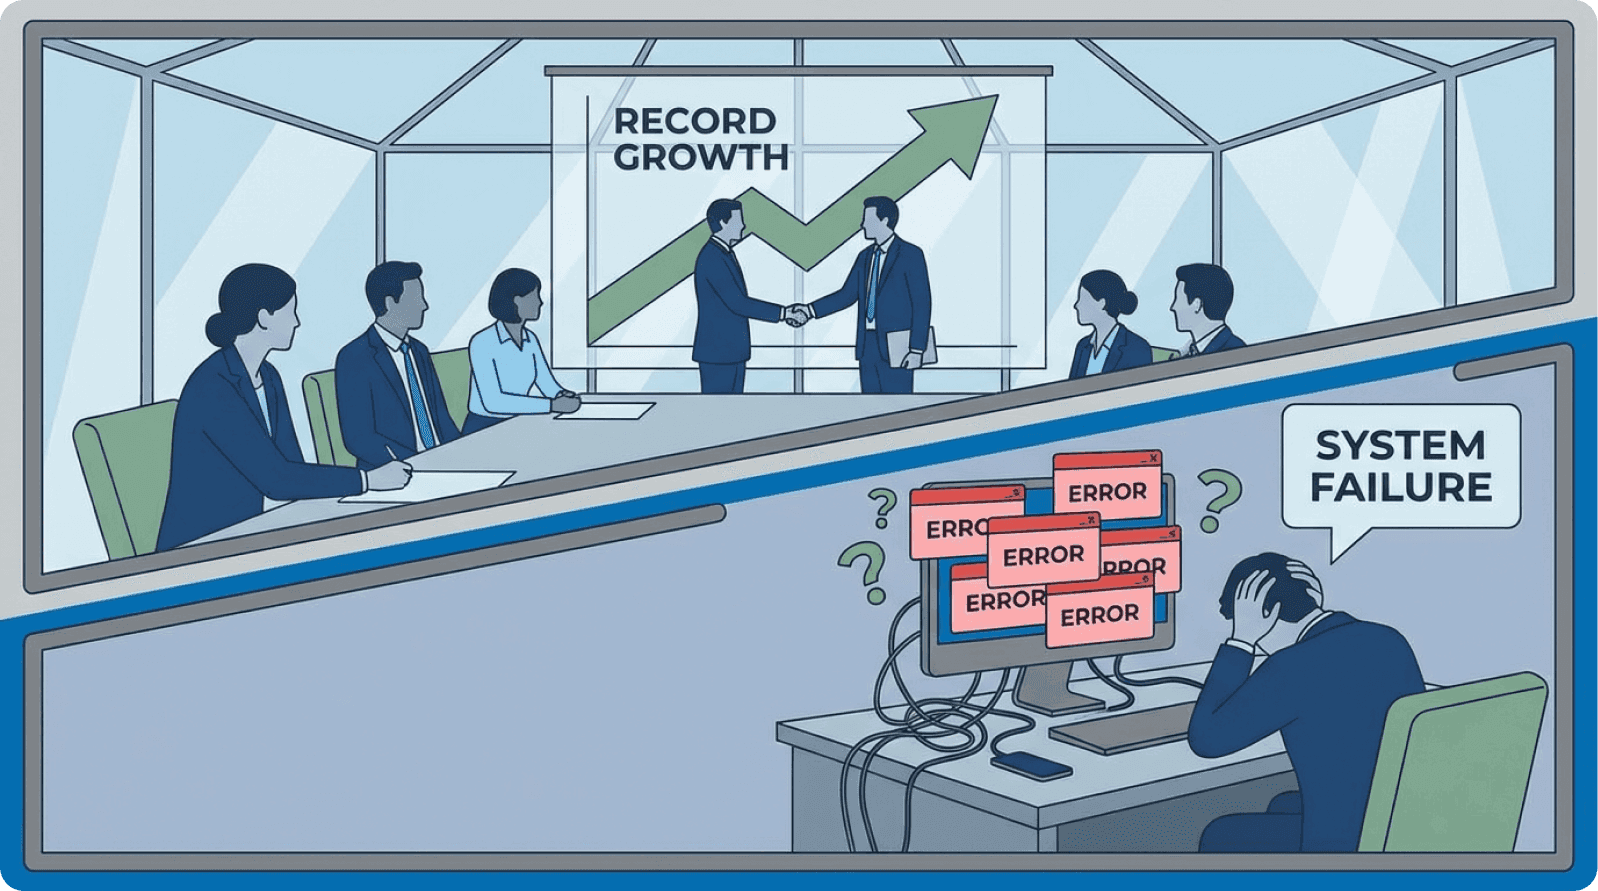
In the conference room, they're calling it a "revolutionary platform." The VP of Sales is closing a $250,000 annual contract with a Fortune 500 company.
The Chief Technology Officer is impressed by the security infrastructure. The Procurement Director is satisfied with the integration capabilities and compliance certifications. Everyone's celebrating the win.
Three months later, the actual users—the employees who will interact with the product eight hours a day—are asking how to get their old system back.
The Scale of the Misalignment Problem
This scenario plays out across thousands of B2B SaaS companies every quarter. It's the most expensive UX mistake in software development, yet it's rarely discussed in product strategy meetings.
When the person who signs the check fundamentally differs from the person who uses the product, you create what researchers call "stakeholder dissonance"—a structural contradiction that no amount of feature development can solve.
The consequences are stark. A staggering 23% of B2B companies cite poor product adoption during onboarding as a leading cause of churn.
Meanwhile, enterprises waste an astounding $21 million in annual value because only 47% of their SaaS licenses are actively used. According to Gartner research, this represents one of the largest sources of technology waste in modern organizations.
The problem isn't that these tools lack capability—it's that they were optimized for boardroom approval rather than workplace productivity. As Jakob Nielsen from Nielsen Norman Group notes:
"Enterprise software often fails not because it can't perform the required tasks, but because it makes those tasks unnecessarily difficult."
Why This Matters Now More Than Ever
This buyer-user misalignment isn't merely a UX problem; it's a revenue problem with measurable impact on three critical business metrics: activation friction, support costs, and renewal likelihood.
For modern B2B teams racing to capture market share in competitive categories, solving this misalignment isn't optional—it's foundational to sustainable growth.
The average B2B SaaS sales cycle has extended to 134 days, up from 107 days just two years ago—a 25% increase driven largely by buyer skepticism about user adoption. When procurement committees lose confidence in actual usage, they demand longer proof-of-value periods.
Part One: Understanding Why Buyers and End-Users Want Completely Different Things
The Decision-Maker's Priorities: Building the Business Case
When a procurement manager evaluates B2B software, they're answering a very specific question: "Will this investment deliver measurable business value?"
This question has led to a predictable set of priorities that dominate enterprise software buying decisions.
Security and Compliance: The Non-Negotiable Foundation
Security and Compliance rank at the top. A CTO wants SOC 2 certification, HIPAA compliance (if relevant), role-based access control (RBAC), and audit trails.
These are non-negotiable requirements that protect the organization from regulatory penalties and data breaches. According to IBM Security research:
"The average cost of a data breach now exceeds $4.45 million, making security features a business imperative, not a technical preference."
When a security concern emerges, a single vulnerability can torpedo an entire contract, regardless of how elegant the product's interface is.
Analytics and ROI Demonstration
Reporting and Analytics Capabilities matter because executives need to quantify ROI. They want dashboards that show utilization metrics, cost savings, productivity gains, and departmental performance.
McKinsey research indicates that 73% of enterprise software purchases require demonstrated ROI within the first year. If the software can't demonstrate business impact in a quarterly report, decision-makers question why they're paying for it.
Integration and Scalability Requirements
Integrations and Scalability address the practical reality of enterprise technology stacks. A financial services company might run Salesforce, NetSuite, Workday, and five other mission-critical systems.
The new solution must connect to these without expensive custom development. Forrester reports that 68% of enterprise buyers cite integration complexity as a primary evaluation criterion.
Scalability ensures the platform won't collapse when the company doubles in size—a concern particularly relevant for high-growth organizations.
Cost Optimization and Vendor Stability
Cost Savings and ROI Projections drive the purchasing conversation. A procurement manager is comparing your tool against three competitors.
Whoever can demonstrate the fastest payback period and lowest total cost of ownership often wins the deal, regardless of usability differences. Support and Service Level Agreements (SLAs) provide peace of mind.
Enterprise buyers want to know someone will answer the phone at 2 AM if the system fails. They want implementation support, training, and a vendor who will still be in business in five years.
Micro-Summary
Decision-makers are rational actors making business cases for significant investments. From their perspective, they're optimizing for risk mitigation, compliance, and measurable ROI—priorities that rarely align with daily user experience needs.
The End-User's Reality: The Daily Friction That Kills Adoption
Now consider the employee who will actually use this tool. They don't care about SOC 2 certification or RBAC implementation.
They care about one thing: getting their job done without unnecessary friction. This is what UX researchers call "interaction cost"—the sum of cognitive and physical effort required to accomplish a task.
Ease of Use: The Primary Adoption Driver
Ease of Use is paramount. If a task that previously took three clicks now takes seven, the user will resist the new system—not out of laziness, but out of legitimate frustration.
Nielsen Norman Group research demonstrates that "each additional interaction step reduces task completion rates by approximately 10%." Every additional click compounds across hundreds of users, thousands of tasks, and entire workdays wasted navigating confusing interfaces.
Mental Models and Workflow Alignment
Intuitive Workflow means the product should reflect how people actually work, not how designers theoretically imagine they work. A marketing manager doesn't think in "data schema structures."
They think, "I need to create a campaign, assign tasks to my team, and track results." When software forces them to adopt an entirely foreign mental model, what researchers call "cognitive load" increases dramatically, leading to adoption resistance.
Stanford HCI research shows that users abandon interfaces requiring more than 7 new conceptual models within the first session.
Friction Reduction in Daily Operations
Low Friction encompasses everything from onboarding ("Why do I need to fill out 15 fields before I can get started?") to daily task completion.
Each unnecessary step is a minor defeat that compounds throughout the day. UX researchers measure this as "friction scoring"—quantifying unnecessary steps in common workflows.
Simple Navigation means finding features shouldn't require extensive training. If the most common tasks are buried three menus deep, users will either give up or, worse, work around the system entirely—recreating spreadsheets to duplicate functions the software already has.
Discover how UX optimization reduces friction.
Time Efficiency as Competitive Advantage
Fast Task Completion directly impacts employee productivity. If the old process took 20 minutes and the new one takes 30 minutes, you've just handed your company a productivity tax on every transaction.
Across thousands of daily interactions, this becomes what economists call "operational drag"—a measurable cost that shows up in reduced throughput. Baymard Institute research indicates that 47% of users cite task completion speed as their primary software satisfaction factor.
The employee isn't being difficult. They're being pragmatic. They'll adopt a tool if it measurably improves their work life. They'll resist one that makes their job harder, no matter how impressive it looks in a PowerPoint presentation.
Micro-Summary
End-users prioritize interface simplicity, workflow alignment, and task completion speed—factors that directly impact their daily productivity but are rarely weighted heavily in procurement decisions.
Why These Priorities Create Structural Conflict
Here's where the misalignment becomes dangerous: these two sets of priorities are orthogonal. Meeting buyer requirements doesn't automatically satisfy end-users, and optimizing for end-user experience doesn't guarantee compliance with procurement demands.
The Architecture vs. Usability Tension
A security-first architecture might mean role-based access controls that fragment workflows into rigid silos. An "enterprise-grade" interface designed for maximum capability often means maximum complexity.
A vendor's focus on quarterly reporting and integrations can come at the cost of the moment-to-moment usability that determines whether employees actually open the application.
This creates what product researchers call "usability debt"—the accumulated cost of design decisions that prioritize features over user experience.
The AI Adoption Gap: A Case Study in Misalignment
Consider a concrete example: AI adoption in the enterprise. In January 2024, only 1 in 4 desk workers had tried AI tools at work.
Yet 81% of executives felt urgency to implement AI across their organizations. This disconnect isn't accidental—it reflects the gap between what leadership wants (AI productivity tools deployed company-wide) and what employees experience (confusing interfaces, unclear use cases, and fear of job replacement).
MIT Sloan Management Review research confirms that "executive enthusiasm for emerging technology consistently outpaces user readiness by 18-24 months."
The most telling statistic: desk workers at companies with defined AI guidelines were nearly six times more likely to try AI tools compared to companies with no guidelines.
This proves that communication, training, and ease of use matter more than raw capability in driving adoption. The technology gap wasn't the problem—the experience gap was.
Micro-Summary
Buyer and user priorities exist in fundamental tension because they optimize for different outcomes—organizational compliance versus individual productivity. This structural conflict requires intentional design architecture to resolve.
Part Two: The Real Business Costs of Getting This Wrong
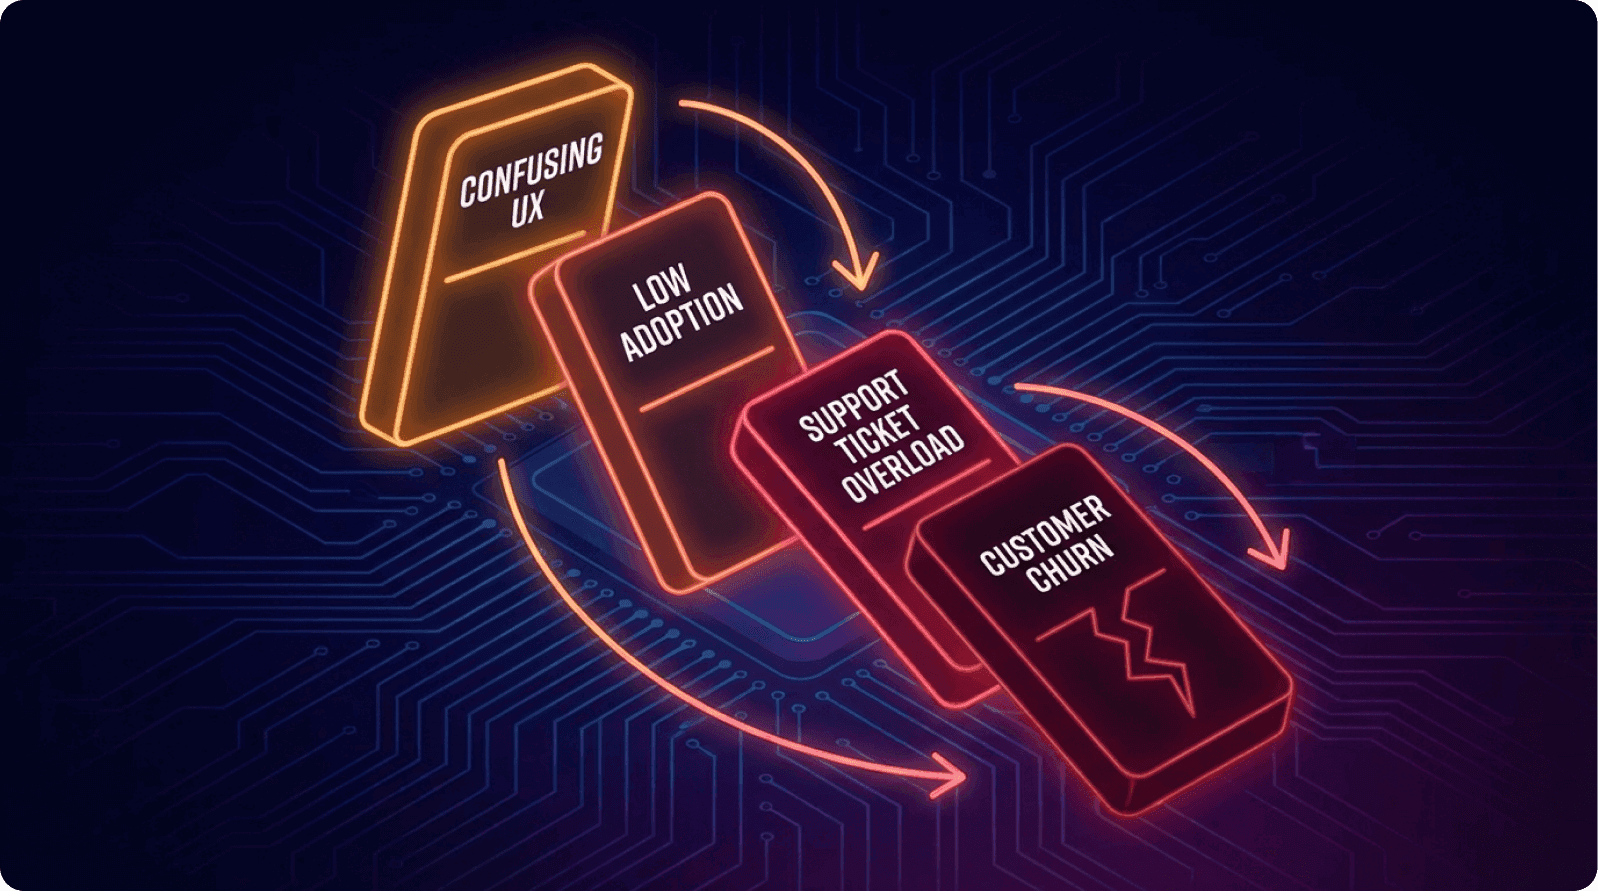
The Churn Cascade
When end-user experience doesn't match expectations set by the sales process, the consequences follow a predictable pattern that SaaS analysts call the "adoption death spiral."
Early-Stage Adoption Failure
Early churn begins 60–90 days after implementation. Users struggle with the onboarding process. They feel confused and inadequately trained. Instead of pushing through the learning curve, they default to old tools or find workarounds.
The company's investment sits unused. Forrester research indicates that 56% of enterprise software deployments fail to reach 50% user adoption within the first six months.
Support System Overload
Support overload follows. The CS team receives hundreds of "How do I...?" tickets that reveal fundamental usability problems, not feature gaps. They're debugging the product experience when they should be driving expansion.
According to Zendesk benchmarking data:
"Support ticket volume increases by 300-400% in the first quarter post-implementation for poorly designed enterprise tools."
This support burden has direct cost implications. A company with 500 active users of a complex B2B platform might expect 2–3 support tickets per user per month if the product is well-designed.
If usability problems double that rate, the CS team suddenly needs to double their headcount or reduce response times.
Renewal Risk Acceleration
Renewal risk emerges at contract evaluation. The decision-maker who approved the purchase now sees low adoption metrics in their quarterly business review. They question the investment. Vendors desperate to prevent churn offer discounts, eroding margin.
ProfitWell data shows that discounting to retain dissatisfied customers reduces lifetime value by an average of 35%.
The data is compelling: B2B SaaS companies experience a 3.5% average monthly churn rate. While that seems modest, it compounds viciously.
A company with 100 customers churning at 3.5% monthly loses 35 customers per year—requiring constant acquisition just to maintain flat revenue. At typical B2B customer acquisition costs of $702-$1,200 per customer, this represents $24,570-$42,000 in wasted acquisition spend annually.
Micro-Summary
Poor user experience triggers a predictable cascade—low adoption leads to support overload, which leads to renewal risk, which requires expensive retention discounts that permanently impair unit economics.
License Waste and Hidden Costs
The most shocking statistic in the B2B SaaS industry is this: only 47% of SaaS licenses are actively used, leading to $21 million in annual waste for large enterprises.
The Shelfware Problem
This phenomenon, called "shelfware" by IT analysts, isn't because companies are careless with budgets. It's because procurement purchases licenses based on per-seat pricing, assuming full utilization.
Then actual adoption reveals that many users either can't get productive quickly enough or find the tool too difficult to justify the learning time.
A 1,000-person enterprise paying $100 per user annually for a collaboration tool they thought would be used by 500 people just spent $50,000 on licenses that collect digital dust.
Multiply this across multiple tools (most enterprises buy 5–15 major platforms), and you understand why CFOs are increasingly demanding "adoption proof" before renewal.
Gartner estimates that "enterprises waste between 30-40% of their total SaaS spend on unused or underutilized licenses." For a mid-market company spending $500,000 annually on SaaS tools, that's $150,000-$200,000 in direct waste—not including the opportunity cost of failed productivity improvements.
Support Cost Multiplier and Sales Cycle Extension
Every usability issue becomes a support ticket. A poorly labeled button might generate 50 support calls per quarter. A confusing workflow might spawn dozens of training sessions.
If your CS team has a loaded cost of $75,000 per employee and you need to add two FTEs to handle usability-driven support volume, that's $150,000 in annual operational cost increase.
Harvard Business Review research indicates that "support costs for poorly designed enterprise software can exceed 25% of annual contract value."
When purchasing committees lose confidence in products, they extend evaluation timelines. That 27-day sales cycle extension means a 25% increase in sales carrying costs. For a team closing deals at a $702 customer acquisition cost, every day added to the cycle burns budget.
SaaS Capital research shows that each 10-day extension in sales cycle reduces sales efficiency (CAC ratio) by approximately 8%.
Micro-Summary
Poor usability creates a permanent tax on operations through support costs, license waste, and extended sales cycles—directly threatening profitability and growth efficiency.
Part Three: Proven Strategies and Real-World Solutions
Strategy 1: Stakeholder Mapping and Dual-Persona Design
The first step is acknowledging that you're designing for multiple users simultaneously. Most product teams have a primary persona and maybe secondary personas.
In B2B, you need to be explicit about the stakeholder hierarchy and design accordingly. This is called "multi-stakeholder design architecture."
Building a Stakeholder Map
Start with stakeholder mapping. Identify not just who will purchase the software, but who will influence that decision and who will live with the consequences daily.
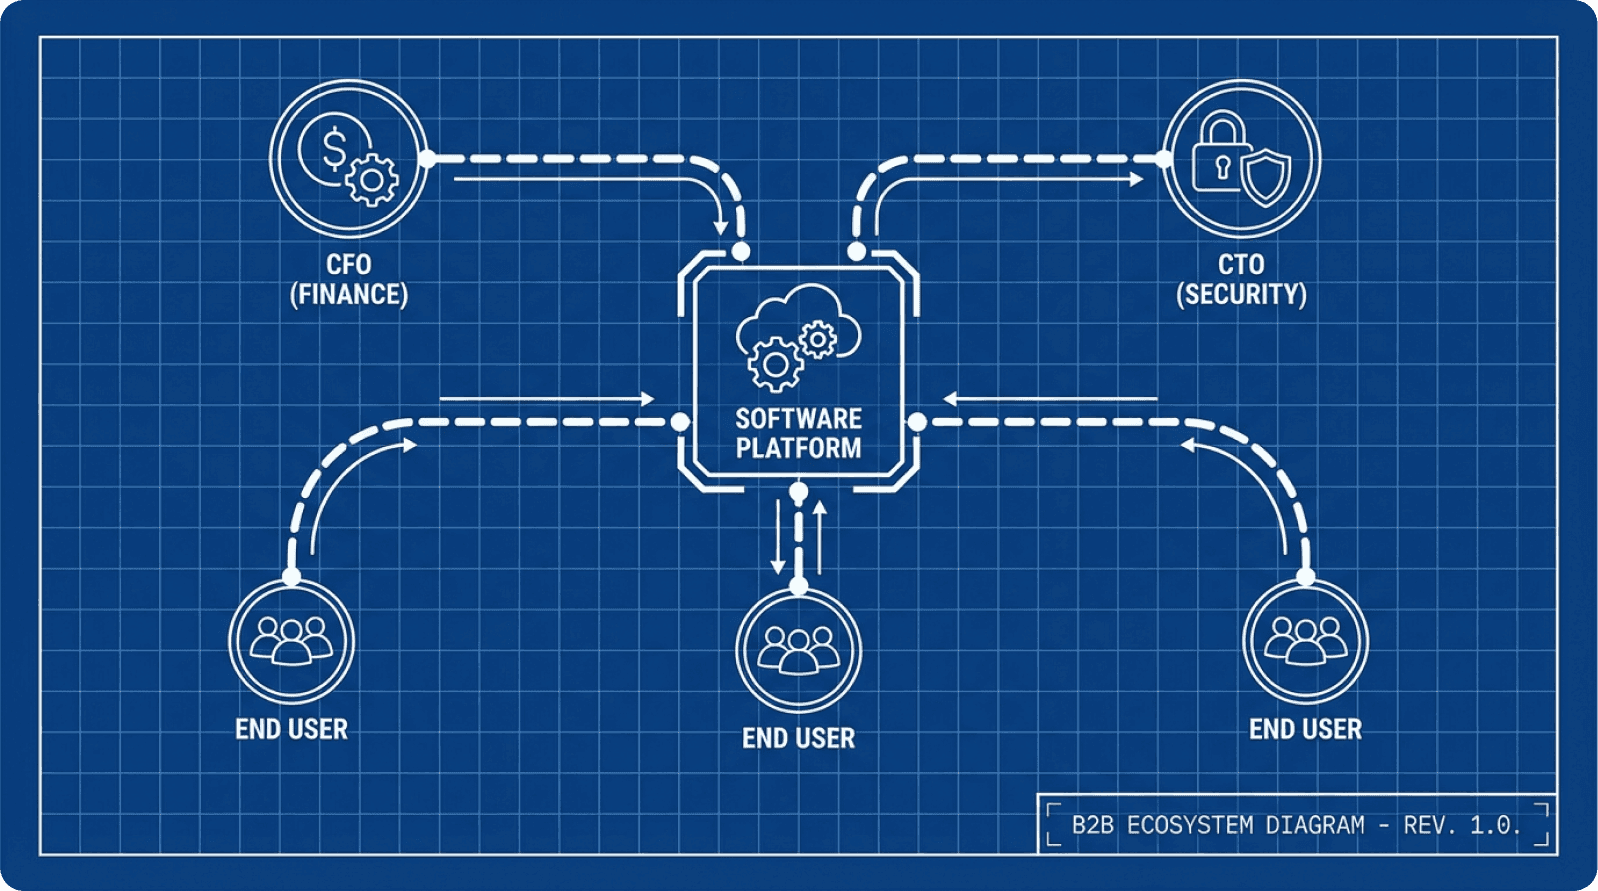
In a typical enterprise software evaluation, you'll find:
Economic Buyer (budget owner—CFO or CTO who cares about cost, compliance, risk)
User Champion (operational leader owning successful adoption—VP of Operations)
End-Users (employees who'll interact with the tool daily)
IT/Security Team (who enforce technical requirements)
Implementation Partner (if using external help)
Create a stakeholder requirement matrix:
Stakeholder | Top Priority 1 | Top Priority 2 | Top Priority 3 | Your Solution |
|---|---|---|---|---|
CTO/Security | SOC 2 Compliance | Data Encryption | Audit Trails | Built-in RBAC, encrypted DB, logging |
VP Operations | Fast Adoption | Measurable ROI | 24/7 Support | Structured onboarding, adoption dashboard |
End-User | Intuitive Interface | Fast Task Completion | Minimal Training | Clean UI, one-click workflows, in-app guidance |
IT Team | System Integrations | Vendor Stability | Technical Docs | 50+ integrations, API docs |
As Marty Cagan notes in Inspired:
"Great product teams explicitly acknowledge stakeholder tensions and design for them systematically, rather than hoping the conflicts resolve themselves."
Micro-Summary
Stakeholder mapping transforms implicit design conflicts into explicit trade-offs, enabling product teams to architect solutions that serve multiple constituencies through role-appropriate experiences.
Strategy 2: Role-Based Design and Progressive Complexity
One of the most effective ways to serve both constituencies is through role-based interfaces that surface different features and complexity levels based on who's using the system.
An IT Administrator needs comprehensive settings, audit trails, and compliance configurations. A line-level employee just needs to complete their primary task with minimal navigation. Both should be served by the same underlying system, but with radically different interfaces.
Real-World Success: SimplePractice
SimplePractice, a practice management solution for medical professionals, implemented this effectively. As the product matured, the user base became less technically savvy.
Instead of building more complex onboarding, they created a structured onboarding flow that guided users through critical setup steps, with visual progress indicators and optional advanced features for power users.
The Impact:
Onboarding completion rates improved from 52% to 87%
Time-to-first-productive-use decreased from 5.2 days to 1.8 days
Support tickets during first 30 days decreased by 41%
90-day retention improved from 73% to 89%
As Diana Stepner, VP of Implementation, noted:
"We learned that simplicity isn't about removing features—it's about revealing them at the right time."
Implementation Framework
How to implement role-based design:
Map user roles within each customer organization (Admin, Manager, Employee)
Define core tasks for each role (the 3-5 most frequent activities)
Create simplified interfaces that surface only relevant features
Provide "power user" pathways for advanced functionality
Use progressive disclosure (reveal complexity as users demonstrate proficiency)
MIT Technology Review research confirms that
"role-adapted interfaces reduce training time by 45-60% compared to one-size-fits-all designs."
Micro-Summary
Progressive disclosure through role-based interfaces resolves the complexity paradox—delivering enterprise capabilities while maintaining interface simplicity through adaptive presentation layers.
Strategy 3: Continuous Usability Testing With Real End-Users
The only reliable way to bridge buyer-user misalignment is through systematic usability testing with actual end-users—not stakeholders, not product managers, and not internal teams.
Why Testing Matters
Most teams make assumptions about user behavior. They design based on what they think users want, not what users actually need.
Nielsen Norman Group research demonstrates that user-centered design can improve usability by as much as 85%. As Don Norman states:
"The best way to design something is to watch people use it—not to ask them what they want."
The Design Sprint Approach
One effective framework is the Design Sprint methodology, which condenses months of work into five intensive days:
Day 1: Problem Understanding — Define the challenge, map user pain points, establish testing goals
Day 2-3: Ideation and Prototyping — Brainstorm solutions, create rapid prototypes (interactive wireframes)
Day 4: User Testing — Test with 4-5 real users, observe without leading, record sessions
Day 5: Analysis and Iteration — Review feedback, identify critical issues, prioritize improvements
Google Ventures research shows that "Design Sprints reduce time-to-validated-solution by 75% compared to traditional development cycles."
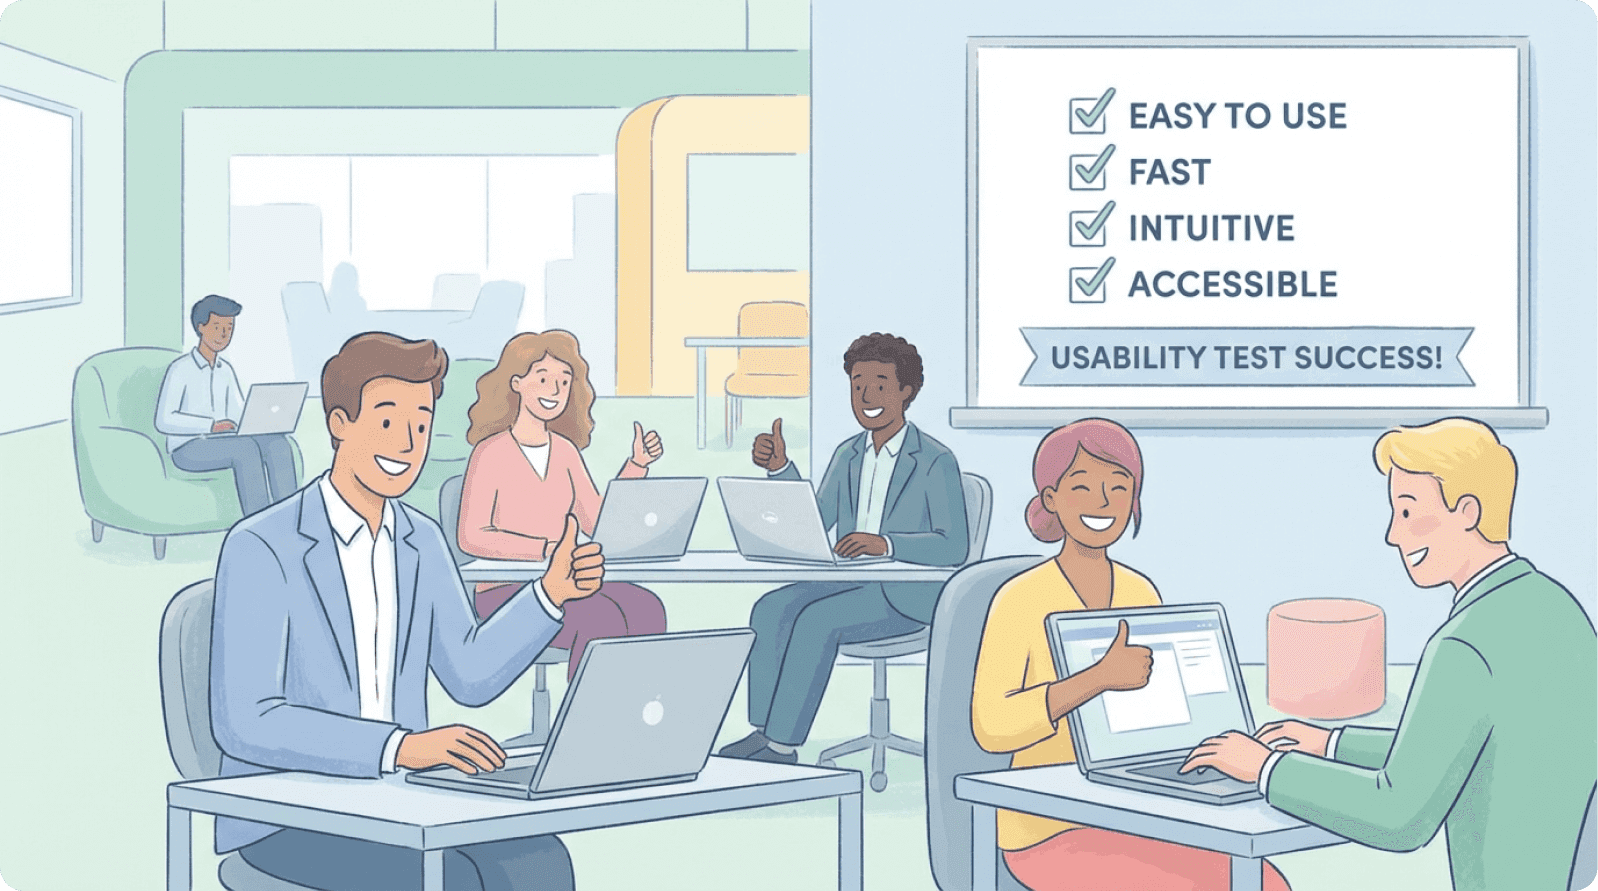
Best Practices
Test with actual end-users experiencing the product for the first time
Present tasks, not questions ("Please add a new project and assign it to your team")
Test frequently (every 2–6 weeks for major changes)
Test across user groups (power users, occasional users, different departments)
Record sessions for team review and pattern identification
Measure quantitative metrics (task success rate, time to completion, error rate)
Baymard Institute research indicates that "systematic usability testing catches 85% of critical issues before they reach production, reducing post-launch support costs by 60%."
Micro-Summary
Continuous usability testing transforms product development from assumption-driven to evidence-driven, catching critical adoption barriers before they impact customer success and revenue.
Strategy 4: Structured Onboarding That Bridges Multiple Needs
Onboarding is where buyer expectations meet end-user reality. 23% of B2B companies cite poor product adoption during onboarding as a leading cause of churn.
Wyzowl research shows that 86% of users say they'd stay with a product longer if the onboarding experience was better.
Multi-Stakeholder Onboarding Architecture
Effective onboarding serves multiple audiences:
For Decision-Makers: Demonstrate value delivery through ROI metrics and compliance confirmation
For IT Teams: Prove security, clean integration, and minimal infrastructure disruption
For End-Users: Provide clear, guided pathways to first successful task completion
Real-World Example: Sears Marketplace
When Sears redesigned their B2B SaaS retail marketplace platform, they recognized that aggregators needed more intuitive access to product performance insights.
Their solution:
Simplified dashboard layout with information hierarchy principles
Improved navigation by eliminating irrelevant options
Clearer data visualizations using best practices
User surveys and usability studies informing redesign
The Impact:
47% increase in user satisfaction
33% more daily active users
28% revenue lift quarter-over-quarter
As their UX lead noted:
"We realized we were designing for ourselves, not for the users who actually needed to make decisions quickly."
Key Elements
Guided setup with visual progress indicators ("You're 40% done")
Role-specific pathways (branching onboarding based on user role)
First-task success (accomplish something real in first session)
Embedded guidance (in-app tooltips, contextual help, video tutorials)
Success metrics dashboard for executive stakeholders
Live support (reach someone within 24 hours when stuck)
Role-specific training content (IT admins, managers, individual users)
Appcues data shows that in-context guidance improves feature adoption by 40%.
Intercom research indicates that
"companies offering live onboarding support see 50% higher activation rates."
Micro-Summary
Structured onboarding bridges the expectation-reality gap by serving multiple stakeholder needs simultaneously—proving value to buyers while enabling success for users through role-appropriate guidance.
Strategy 5: User-Centered Procurement Process
Here's a revolutionary idea: involve usability evaluation in the procurement process itself. This practice, called "experience-first procurement," is gaining traction among sophisticated IT buyers.
The Demo Trap
Most enterprise software vendors conduct demos, but these are problematic for evaluating real usability. Vendors walk clients through the "happy path"—the ideal user journey where everything works perfectly.
Forrester estimates that demo experiences overstate actual usability by 300-400%.
Implementing User-Centered Evaluation
Pioneering procurement teams now ask vendors: "Let our actual end-users try your product, without vendor guidance, on realistic tasks."
This approach involves:
Plan the evaluation (define critical tasks like creating an expense report, generating a report)
Define success criteria (task completion time, click count, first-try success rate)
Conduct usability testing during demos (users attempt tasks without vendor guidance)
Observe and document (note where users hesitate or struggle)
Weight usability in decisions (30-40% for self-service tools, 15-20% for expert tools)
Compare across platforms (same users, same tasks, objective comparison)
Gartner research shows that
"companies using experience-first procurement reduce first-year adoption failures by 65%."
Micro-Summary
User-centered procurement catches usability problems during vendor selection rather than after implementation, dramatically reducing adoption risk and increasing ROI likelihood.
Strategy 6: Slack's Dual-Audience Masterclass
Slack exemplifies a B2B tool that successfully serves both procurement needs and end-user desires through what researchers call "experience parity design."
Serving Both Constituencies
The Buyer's Perspective:
Security teams get fine-grained RBAC, compliance certifications (SOC 2, ISO 27001)
IT administrators appreciate scalability (tested to 500,000+ users), audit logs
Finance teams see clear ROI: 32% reduction in email volume and 25% faster decision-making
The End-User's Perspective:
Intuitive interface (learn core functions in minutes)
Logical navigation (one-click access to common tasks)
Integration ecosystem (connects to Zoom, Google Meet, Salesforce)
Measurable Impact
Slack users report 15% higher satisfaction scores than Microsoft Teams users in UX surveys. Despite Teams having larger resources and zero marginal distribution cost, Slack wins on user experience.
Slack integrations deliver up to 296% ROI by reducing ticket handling times by 40%, escalations by 35%, and operational costs by 21% while boosting revenue by 27%.
Teams using Slack report 27% improvement in team alignment compared to email-heavy teams, with 78% of workplace interactions using emoji reactions and threads.
As Stewart Butterfield noted:
"We designed Slack to feel fast, responsive, and delightful—not because those are nice-to-haves, but because they're the difference between software people use and software people tolerate."
Micro-Summary
Slack demonstrates that buyer requirements and user preferences aren't opposing forces—products designed for user delight can simultaneously deliver enterprise-grade capabilities and measurable ROI.
Part Four: Building Your Buyer-User Alignment Program
Month 1: Stakeholder Mapping and Discovery
Weeks 1-2: Conduct Discovery Interviews
Interview 3-5 major customers across different company sizes
Ask about buying committee structure and decision criteria
Document where expectations diverged from reality
Map the influence network
Weeks 3-4: Create Frameworks
Build your stakeholder requirement matrix
Identify conflicts and assign severity scores
Establish resolution principles (e.g., "We use progressive disclosure when security conflicts with usability")
Create one-page stakeholder map
Deliverable: Documented stakeholder map with design principles and resolution frameworks.
Month 2-3: Baseline Metrics and Testing
Conduct Initial Usability Tests:
Select 5-8 new users matching target personas
Give realistic tasks without guidance
Measure: task success rate, completion time, error rate, satisfaction
Document friction points
Establish Adoption Benchmarks:
Track: onboarding completion, time-to-first-value, feature adoption by role
Compare against industry benchmarks (OpenView, ChartMogul, ProfitWell)
Identify high-impact improvement opportunities
Deliverable: Usability baseline report with current state, friction points, severity rankings, and industry comparison.
Month 4-5: Design Sprint for High-Impact Improvements
Select Focus Area:
Choose one critical workflow causing churn or low adoption
Consider frequency of use × severity of friction × business impact
Run 5-Day Design Sprint:
Day 1: Map current journey, define success criteria
Days 2-3: Brainstorm solutions, create prototypes
Day 4: Test with 4-5 real users
Day 5: Analyze findings, prioritize improvements
Target: 80% of users successfully completing the redesigned task without questions, in 50% less time.
Deliverable: Validated prototype with design specifications, success metrics, and implementation plan.
Month 6+: Continuous Testing and Improvement
Establish Testing Cadence:
Monthly usability testing for major feature changes
Quarterly onboarding experience testing
Ongoing analytics monitoring
Create Feedback Loop:
Weekly product team review of findings
Monthly design prioritization based on impact
Quarterly engineering integration into roadmap
Track Progress:
Monitor adoption, support, business, and efficiency metrics
Create monthly one-pagers for executives
Quarterly deep-dives with user video highlights
Annual ROI analysis
Deliverable: Sustainable testing program that continuously identifies and resolves usability issues.
The Financial Case for Buyer-User Alignment
The ROI Calculation
Consider a typical mid-market B2B SaaS company with 100 customers paying $10,000 annually:
Current State:
Annual revenue: $1 million
Monthly churn rate: 3.5% (industry average)
Annual customer loss: 35 customers
CAC to replace churned customers: $105,000–$175,000
With 25% Churn Reduction:
Customers saved: 9 customers
Retained revenue: $90,000 annually
Support cost savings: $75,000–$150,000 (1-2 FTE)
Expansion revenue increase: $50,000 (5% lift)
Sales efficiency gains: $35,000 (shorter cycles, less discounting)
Total benefit: $250,000–$325,000
Investment Required:
Usability testing: $30,000–$50,000 annually
Design resources: $40,000–$60,000 annually
Total investment: $70,000–$110,000 annually
Net ROI: $140,000–$215,000 (127-195% return) with 4-8 month payback.
Forrester research confirms:
"Companies that invest in UX see an average return of $100 for every $1 invested—a 9,900% ROI."
Micro-Summary
The financial case is overwhelming—modest usability improvements yield 127-195% ROI through reduced churn, lower support costs, and increased expansion revenue, with full payback in under 9 months.
Conclusion: From Misalignment to Strategic Advantage
The buyer-user misalignment in B2B SaaS is costly but fixable. Unlike technical debt requiring months to unwind, improving user-centric design yields immediate adoption improvements.
The Six-Strategy Playbook:
Map stakeholders explicitly and document their priorities
Design role-based interfaces with progressive disclosure
Test continuously with real users (every 2-6 weeks)
Structure onboarding for multiple stakeholders simultaneously
Involve users in procurement through experience-first evaluation
Measure adoption by role and customer segment
Companies like Slack, SimplePractice, and Sears prove that designing for end-users while satisfying buyer requirements isn't a trade-off—it's a competitive advantage.
In today's B2B market, where 77% of B2B buyers now involve end-user input in purchase decisions (up from 44% three years ago), this alignment separates products that scale from those that stall.
Start small: Pick one critical workflow. Run a 5-day design sprint. Test with 5 real users. Measure the impact. Then scale the process.
Glossary of Key Terms
Activation Friction: Cumulative difficulty users experience completing their first valuable action; high friction leads to low activation and early abandonment.
Cognitive Load: Total mental effort required to use an interface; high cognitive load causes frustration and errors.
Experience-First Procurement: Purchasing methodology including usability testing with end-users during vendor evaluation before contract signature.
Friction Scoring: Quantitative measurement of unnecessary steps, decisions, or obstacles users encounter when completing tasks.
Interaction Cost: Sum of cognitive and physical effort required to accomplish a task; measured in time, clicks, and mental effort.
Mental Model: Internal understanding users have about how a system works; misalignment forces users to learn entirely new conceptual frameworks.
Multi-Stakeholder Design Architecture: Intentional product design explicitly acknowledging multiple distinct user types and systematically addressing each group's needs.
Operational Drag: Accumulated productivity loss from software requiring more time and effort than alternatives; measurable in hours lost per user per week.
Progressive Disclosure: Design technique presenting information gradually, showing only what users need at each step and revealing complexity as proficiency increases.
Role-Based Access Control (RBAC): Security model restricting system access based on user roles; in user-centered design, extends to adapting interface complexity.
Shelfware: Software purchased but unused or severely underutilized; originally referred to boxed software, now applied to cloud SaaS with low adoption.
Stakeholder Dissonance: Fundamental misalignment between what different stakeholder groups need, expect, and value from a B2B product.
Usability Debt: Accumulated cost of design decisions prioritizing features over user experience; compounds over time like technical debt.
User-Centered Design: Design philosophy placing actual user needs, behaviors, and limitations at the center through iterative testing with real users.
References and Further Reading
UX Research: Nielsen Norman Group (enterprise UX), Baymard Institute (usability benchmarks), Stanford HCI Group (interface design research)
Enterprise Analysis: Gartner (technology and buyer behavior), Forrester Research (B2B adoption and ROI), McKinsey Digital (enterprise transformation)
Product Management: Teresa Torres (Continuous Discovery Habits), Marty Cagan (B2B product frameworks), Product Management Society (stakeholder management)
Business Strategy: Harvard Business Review (UX ROI studies), MIT Sloan Management Review (technology adoption), SaaS Capital (B2B metrics)
Methodologies: Google Ventures (Design Sprint), Lean UX (rapid testing frameworks), Jobs to Be Done Institute (customer need analysis)
Analytics: OpenView Partners (SaaS metrics), ProfitWell (subscription benchmarks), ChartMogul (growth and churn analysis)