Last Update:
Feb 15, 2026

Share
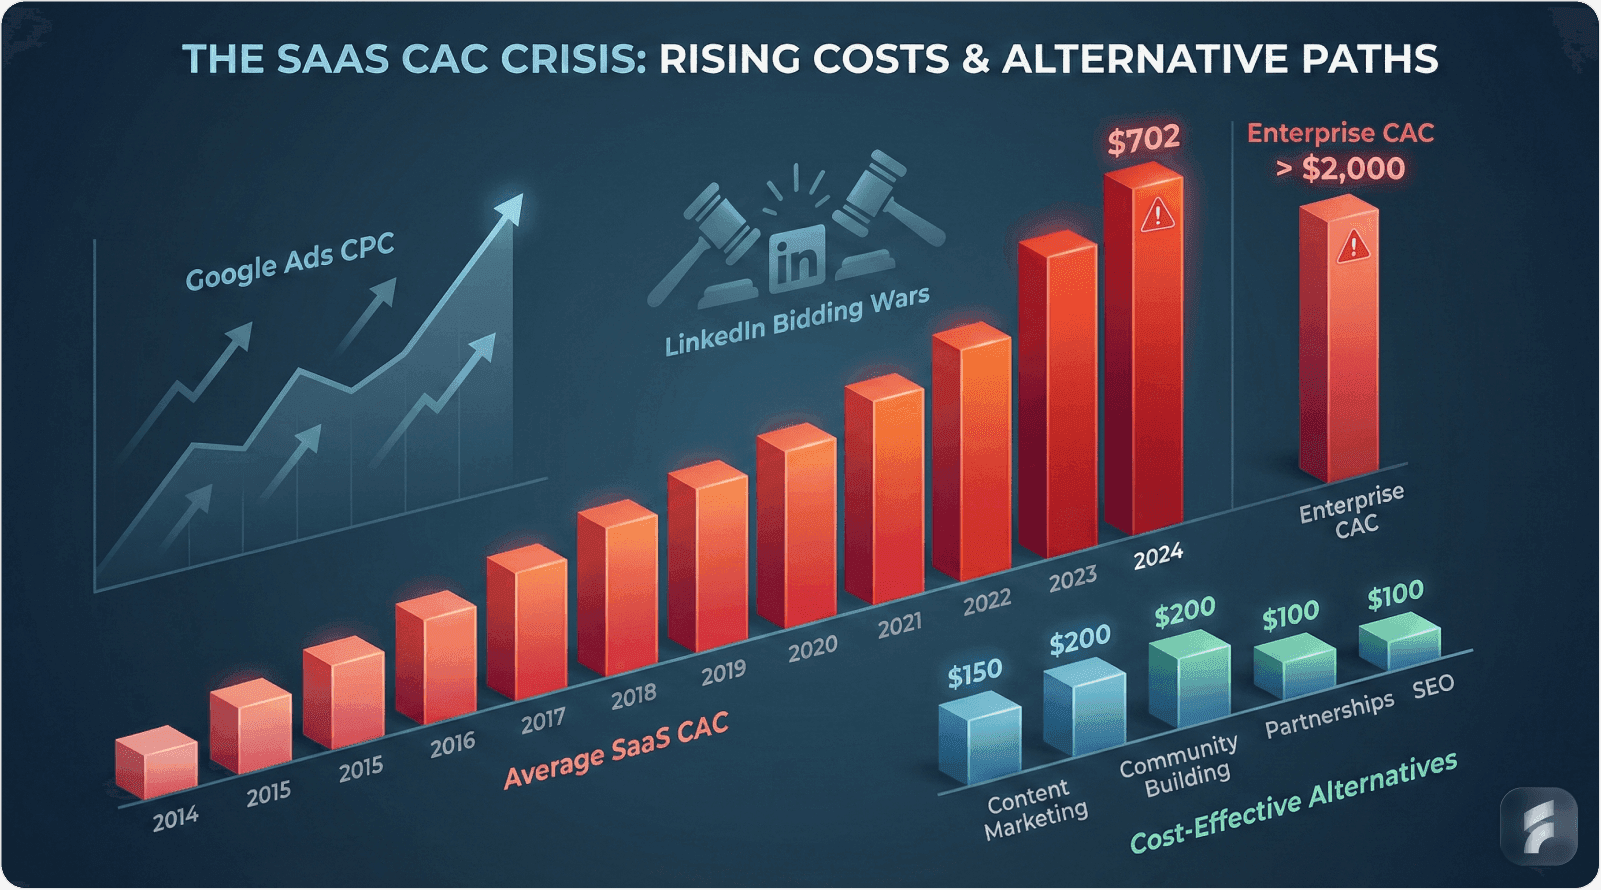
SaaS CAC Crisis: The average customer acquisition cost (CAC) is $702, with enterprise segments exceeding $2,000. High CAC hampers profitability and scalability.
Six Strategies to Lower CAC: Implementing strategies such as content marketing, product-led growth (PLG), onboarding optimization, referral programs, channel attribution, and retention optimization can reduce CAC by 40-60%.
Product-Led Growth (PLG): Companies using PLG models achieve 50% lower CAC compared to sales-led competitors. PLG focuses on self-service acquisition, freemium models, and viral growth mechanisms.
Content Marketing Efficiency: Content marketing can reduce CAC by 61% compared to paid advertising, with organic leads converting at 3x higher sales qualification rates.
CAC Payback Period: A target payback period of under 12 months is essential for sustainable SaaS growth. Extended payback periods limit growth velocity and create financial constraints.
Effective Referral Programs: Referral programs generate high-quality leads at low cost. Programs like Airbnb’s dual-sided incentive model have proven successful in accelerating adoption and reducing CAC.
Attribution Models: Implementing multi-touch attribution models helps allocate marketing budgets effectively, improving channel performance and optimizing CAC across different acquisition channels.
Lifetime Value (LTV) and Retention: A high LTV:CAC ratio (above 3:1) is crucial for ensuring sustainable unit economics. Retention and expansion strategies can optimize LTV, making higher CAC sustainable.
Understanding the CAC Crisis in Modern SaaS
The Financial Reality
Customer acquisition cost has increased 222% across SaaS companies over the past decade. This acceleration outpaces revenue growth for 68% of B2B software companies according to Pacific Crest's SaaS Survey .
The average SaaS company now spends $702 to acquire each customer. Enterprise-focused solutions face significantly higher barriers—CAC often exceeds $2,000 per customer due to extended sales cycles and high-touch engagement requirements.
According to Bessemer Venture Partners' ↗ cloud index research, "Efficient growth requires maintaining CAC payback periods under 12 months while sustaining net dollar retention above 110%."
Why Traditional Acquisition Models Break
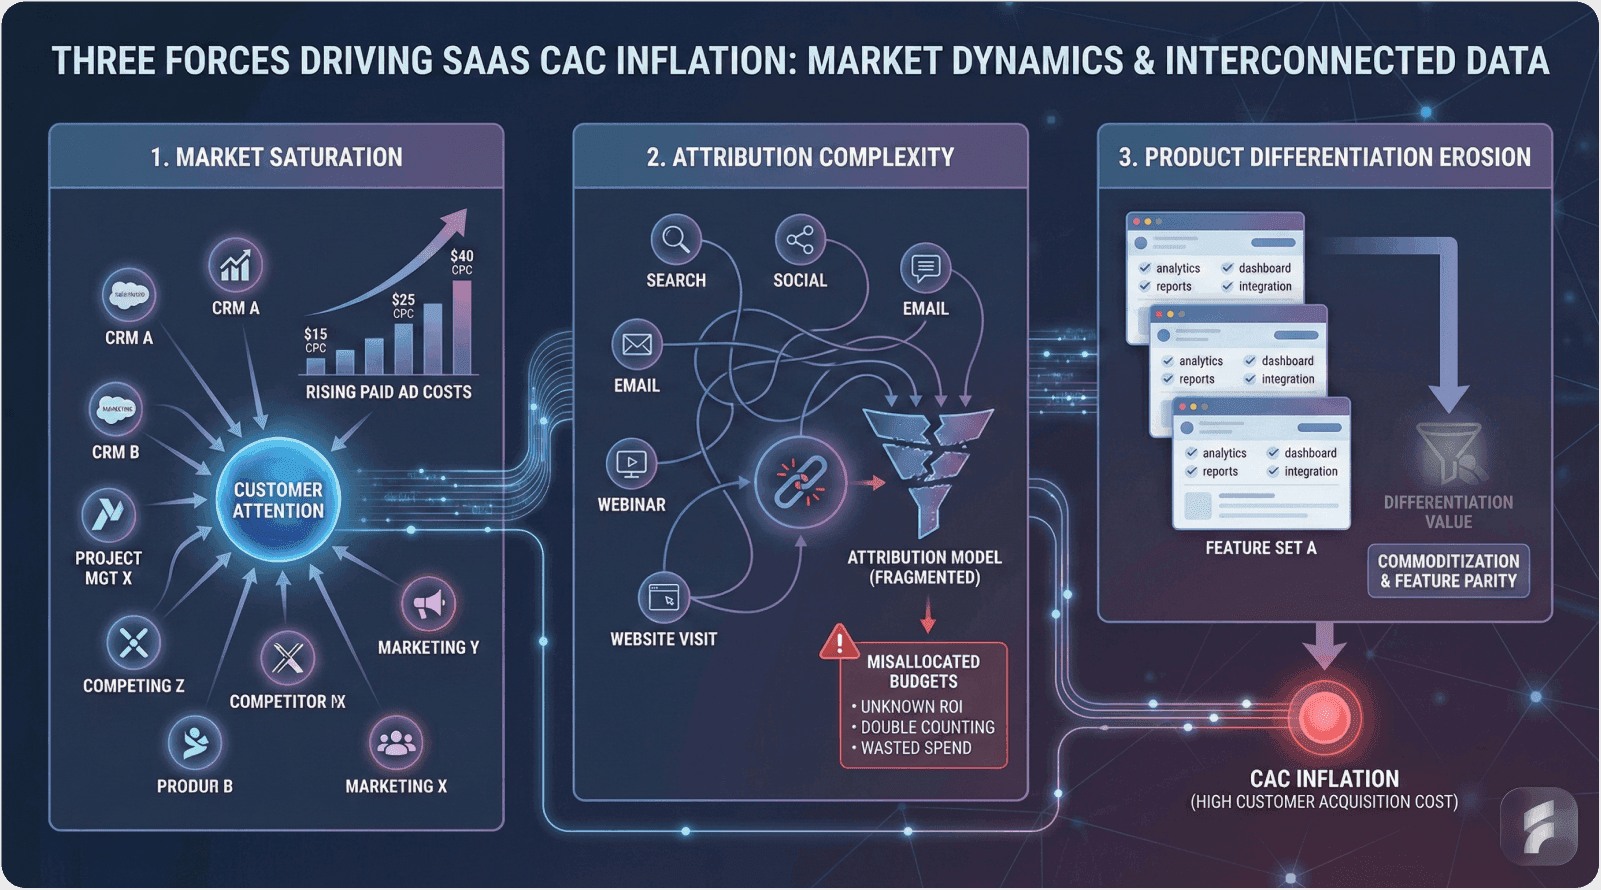
Three structural forces drive CAC inflation in contemporary SaaS markets.
Market Saturation Intensifies Competition
The average SaaS category now contains 47 competing solutions. This density creates bidding wars for paid advertising placements and search visibility.
Google Ads cost-per-click rates for SaaS keywords increased 164% between 2019 and 2024. LinkedIn advertising costs rose 89% during the same period. These inflationary pressures directly impact acquisition efficiency.
Attribution Complexity Obscures Performance
Modern B2B buyers interact with 27 content pieces before purchasing. This multi-touch journey spans organic search, paid advertising, content consumption, peer reviews, and sales conversations.
Without sophisticated attribution modeling, companies misallocate budgets to underperforming channels while underfunding efficient acquisition pathways.
Product Differentiation Erodes
As SaaS categories mature, feature parity emerges across competitors. When products become functionally similar, acquisition shifts from product education to brand preference—requiring higher marketing investment per conversion.
Gartner research indicates that 73% of B2B buyers complete their purchase research independently before engaging sales teams. This self-directed discovery phase demands extensive content infrastructure and technical demonstration capabilities.
The CAC Payback Period Challenge
CAC payback period measures months required to recover customer acquisition costs through gross margin. Industry benchmarks suggest target thresholds based on sales motion:
Sales Model | Target Payback Period | Median Actual Performance |
|---|---|---|
Self-serve PLG | 3-6 months | 8 months |
Inside Sales | 12-18 months | 24 months |
Enterprise Field Sales | 24-36 months | 42 months |
Companies exceeding these benchmarks face cash flow constraints limiting growth velocity. Extended payback periods force founders to choose between growth rate and profitability—a false dichotomy that systematic optimization eliminates.
Micro-Summary: High CAC stems from intensifying competition, attribution complexity, and eroding product differentiation. The average $702 per customer cost becomes unsustainable when payback periods extend beyond 12-18 months. Understanding these structural forces enables targeted intervention rather than generic cost-cutting that damages growth quality.
Root Cause Analysis: Why Your CAC Remains Elevated
Cause 1: Extended Enterprise Sales Cycles
Enterprise SaaS sales cycles average 6-9 months from initial contact to signed contract. During this period, companies invest in sales engineering, custom demonstrations, proof-of-concept deployments, security reviews, and executive presentations.
Salesforce Case Analysis
Salesforce pioneered cloud CRM but faced 9-12 month enterprise sales cycles requiring dedicated account executives, solution engineers, and customer success managers throughout the buying journey.
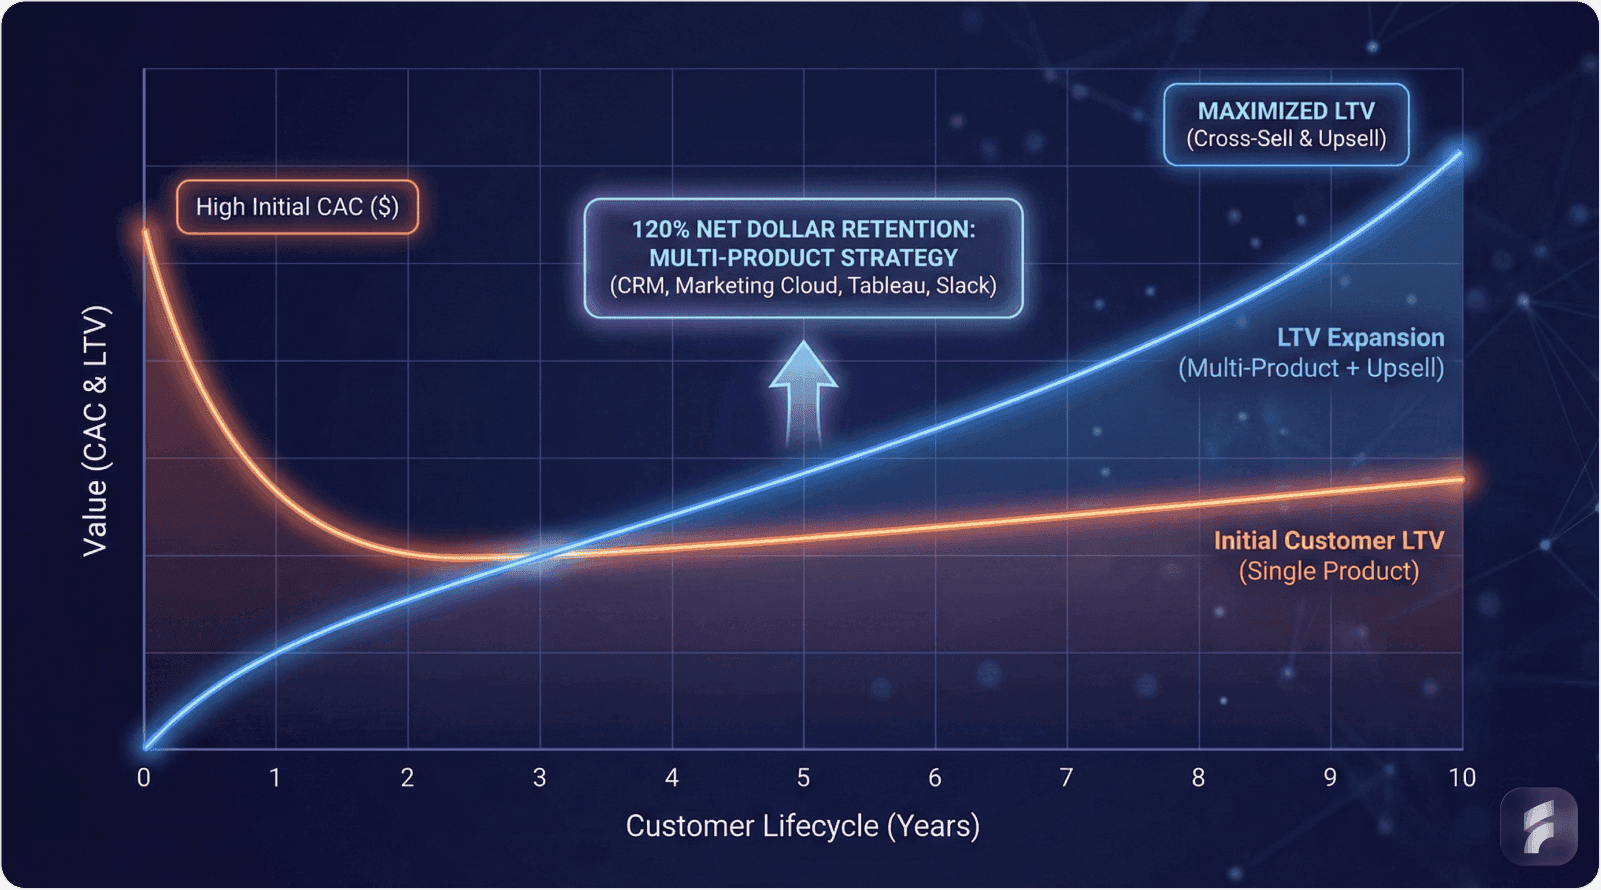
Their approach: Accepted high initial CAC (estimated $3,000-$5,000 per enterprise account) while optimizing for lifetime value. Through aggressive upselling and cross-selling, Salesforce achieved 120% net dollar retention, making elevated acquisition costs economically viable.
The company's multi-product strategy expanded average customer value from $15,000 annually to over $100,000 within three years of initial purchase.
Professor David Skok, Matrix Partners, notes: "Enterprise sales models succeed when LTV exceeds CAC by minimum 5:1 ratios—anything less indicates pricing or retention problems, not just acquisition inefficiency."
Cause 2: Competitive Market Dynamics
Crowded categories force aggressive bidding for attention across paid channels. The marketing automation space exemplifies this dynamic—over 8,000 solutions compete for essentially identical keyword targeting.
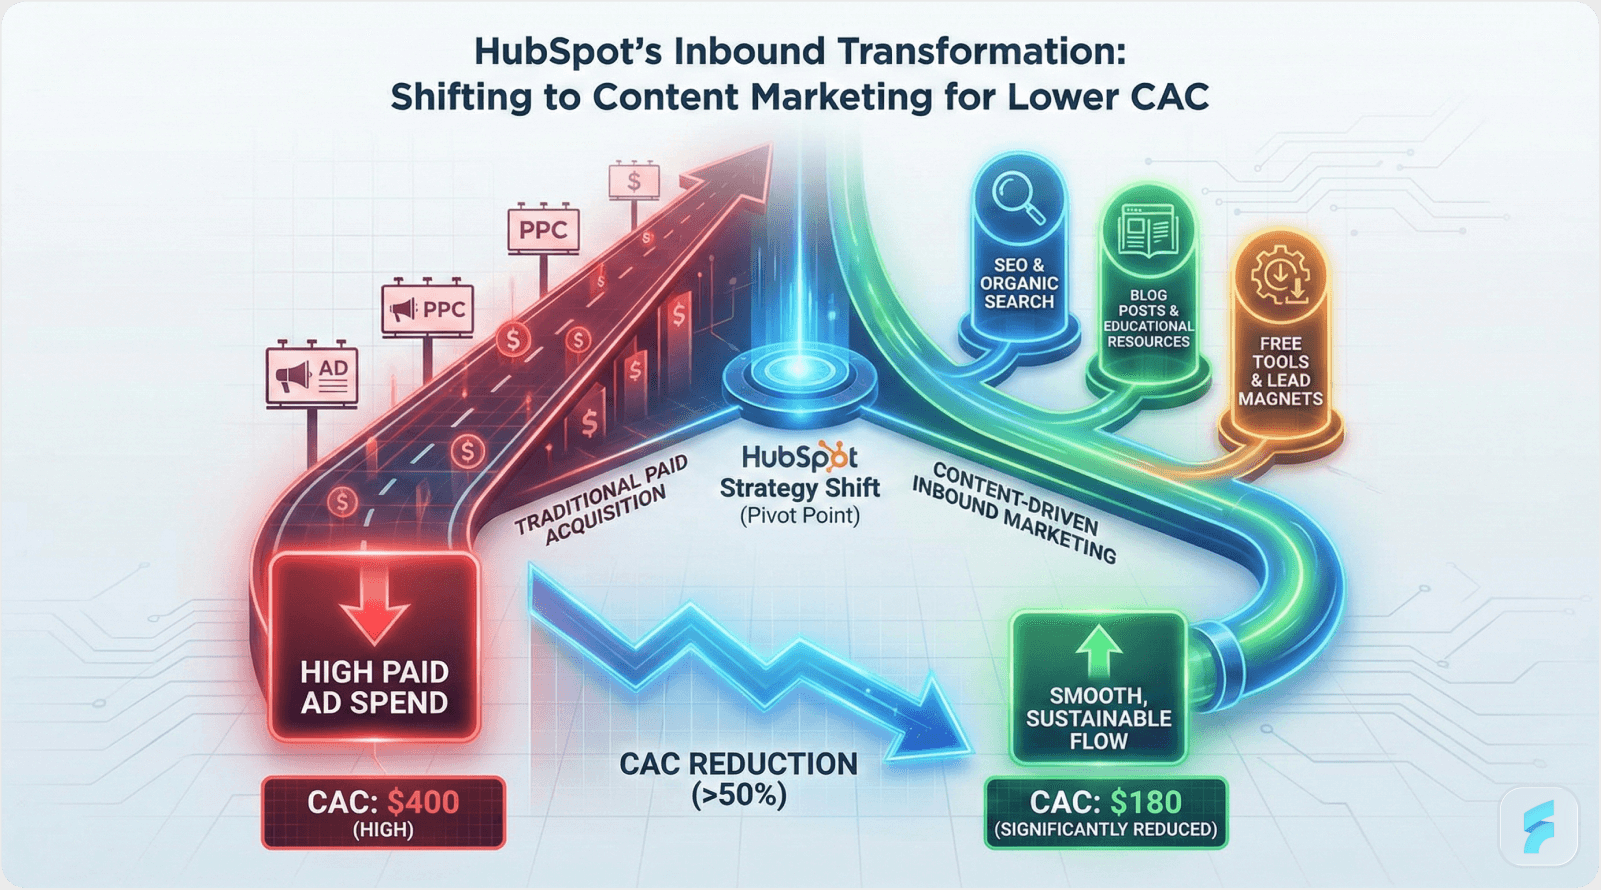
HubSpot's Strategic Pivot
HubSpot initially competed through paid search advertising in the crowded marketing automation category. Their analysis revealed $400+ CAC for customers with $300 annual contract value—negative unit economics requiring immediate correction.
Strategic response: Shift to inbound marketing methodology. HubSpot invested heavily in free tools (Website Grader, Email Signature Generator), educational content (Marketing Blog, HubSpot Academy), and freemium CRM offering.
Results within 24 months:
Organic traffic increased 340%
CAC decreased from $400 to $180
Free tool users converted at 12% versus 2% for paid traffic
Average customer LTV increased due to higher-quality leads
According to Content Marketing Institute research, companies prioritizing content marketing achieve CAC reductions averaging 62% compared to paid-advertising-dependent competitors.
Cause 3: Product-Market Fit Ambiguity
Without clear product-market fit, companies waste acquisition budgets attracting wrong-fit customers who churn rapidly. This creates a vicious cycle: high acquisition costs paired with low retention rates destroy unit economics. Professional UX optimization can help align product offerings with market demand.
Slack's Positioning Refinement
Slack's original positioning targeted gaming communities for team coordination. Acquisition proved expensive ($200+ CAC) with poor retention (30% churned within 90 days).
After analyzing usage patterns, Slack identified business teams as their true value proposition. Repositioning toward workplace collaboration reduced CAC to $50 while improving 90-day retention to 85%.
The repositioning strategy included:
Revised messaging emphasizing team productivity
Case studies from business customers
Integration partnerships with business tools
Freemium model enabling viral team adoption
Sequoia Capital's growth framework emphasizes: "Product-market fit manifests in organic word-of-mouth, retention curves flattening above 60% at day 90, and customers expressing frustration when product becomes unavailable."
Definition Block: Product-Market Fit Indicators
Quantitative Signals: 40%+ monthly organic growth, NPS >50, magic number >0.75, 60%+ day-90 retention, CAC payback <12 months
Qualitative Signals: Customers recommend unprompted, express frustration during downtime, request features indicating deep engagement, resist switching despite competitor offers
Micro-Summary: Extended sales cycles, competitive intensity, and product-market fit ambiguity represent the three primary CAC drivers. Salesforce accepted high enterprise CAC while optimizing lifetime value. HubSpot pivoted from paid acquisition to content-driven inbound methodology. Slack repositioned from gaming to business collaboration, reducing CAC by 75%. Each case demonstrates that sustainable CAC reduction requires strategic intervention addressing root causes rather than superficial budget cuts.
Strategy 1: Content Marketing for Organic Lead Generation
The Compounding Returns Model
Content marketing generates asymmetric returns—initial investment produces perpetual traffic without recurring costs. A high-ranking blog post written in 2024 continues attracting qualified leads throughout 2025, 2026, and beyond.
Demand Curve research shows that content marketing reduces CAC by 61% compared to paid advertising while generating 3x higher lead quality as measured by sales qualification rates.
HubSpot's Inbound Architecture
HubSpot's content strategy spans multiple formats optimized for different buyer journey stages.
Awareness Stage Content
4,000+ blog posts targeting educational keywords
Free tools (Website Grader analyzed 4 million sites)
Social media distribution reaching 2.5 million followers
Consideration Stage Content
Comparison guides (HubSpot vs. Competitors)
Educational webinars (150+ annually)
HubSpot Academy certification courses
Decision Stage Content
Product documentation and demos
Free CRM offering (eliminate switching costs)
ROI calculators and implementation guides
This content infrastructure generates over 7 million monthly organic visitors. Assuming 2% conversion to free CRM and 10% freemium-to-paid conversion, HubSpot acquires approximately 14,000 customers monthly through content—representing $2.5 million in CAC savings versus paid acquisition equivalents.
Ann Handley, Chief Content Officer at MarketingProfs, states: "Content marketing's compounding returns transform it from expense to appreciating asset—blog posts published three years ago still drive 23% of our monthly pipeline."
Implementation Framework
Month 1-3: Foundation Building
Keyword research identifying 100 target terms (search volume >500, difficulty <30)
Competitor content gap analysis revealing underserved topics
Editorial calendar mapping keywords to buyer personas and journey stages
Month 4-6: Content Production
Publish 2-3 comprehensive articles weekly (2,000+ words each)
Create supporting visual assets (infographics, comparison tables, frameworks)
Develop lead magnets (ebooks, templates, calculators) for email capture
Month 7-12: Optimization and Scaling
Monitor ranking progress and traffic patterns
Update underperforming content based on search console data
Build internal linking structure strengthening topical authority
Scale production to 4-5 weekly articles
Ahrefs analysis of 2 million pages reveals that content ranking in positions 1-3 receives 10x more traffic than positions 4-10. This winner-take-most dynamic rewards sustained content investment over time.
For more insights on creating compelling content, visit our blog for expert perspectives on SaaS growth strategies.
Micro-Summary: Content marketing generates compounding returns through perpetual organic traffic without recurring costs. HubSpot's 4,000+ blog posts drive 7 million monthly visitors, acquiring 14,000 customers through educational content rather than paid advertising. Implementation requires 12-month commitment before realizing substantial CAC reductions, but subsequent returns justify initial investment through 61% lower acquisition costs and 3x higher lead quality.
Strategy 2: Product-Led Growth (PLG) Transformation
The Self-Service Acquisition Model
Product-led growth inverts traditional sales funnels—products demonstrate value before extracting payment. Users experience core functionality through freemium tiers or free trials, converting to paid plans as usage expands.
OpenView Partners research indicates that PLG companies achieve 50% lower CAC compared to sales-led competitors while maintaining equivalent or superior growth rates.
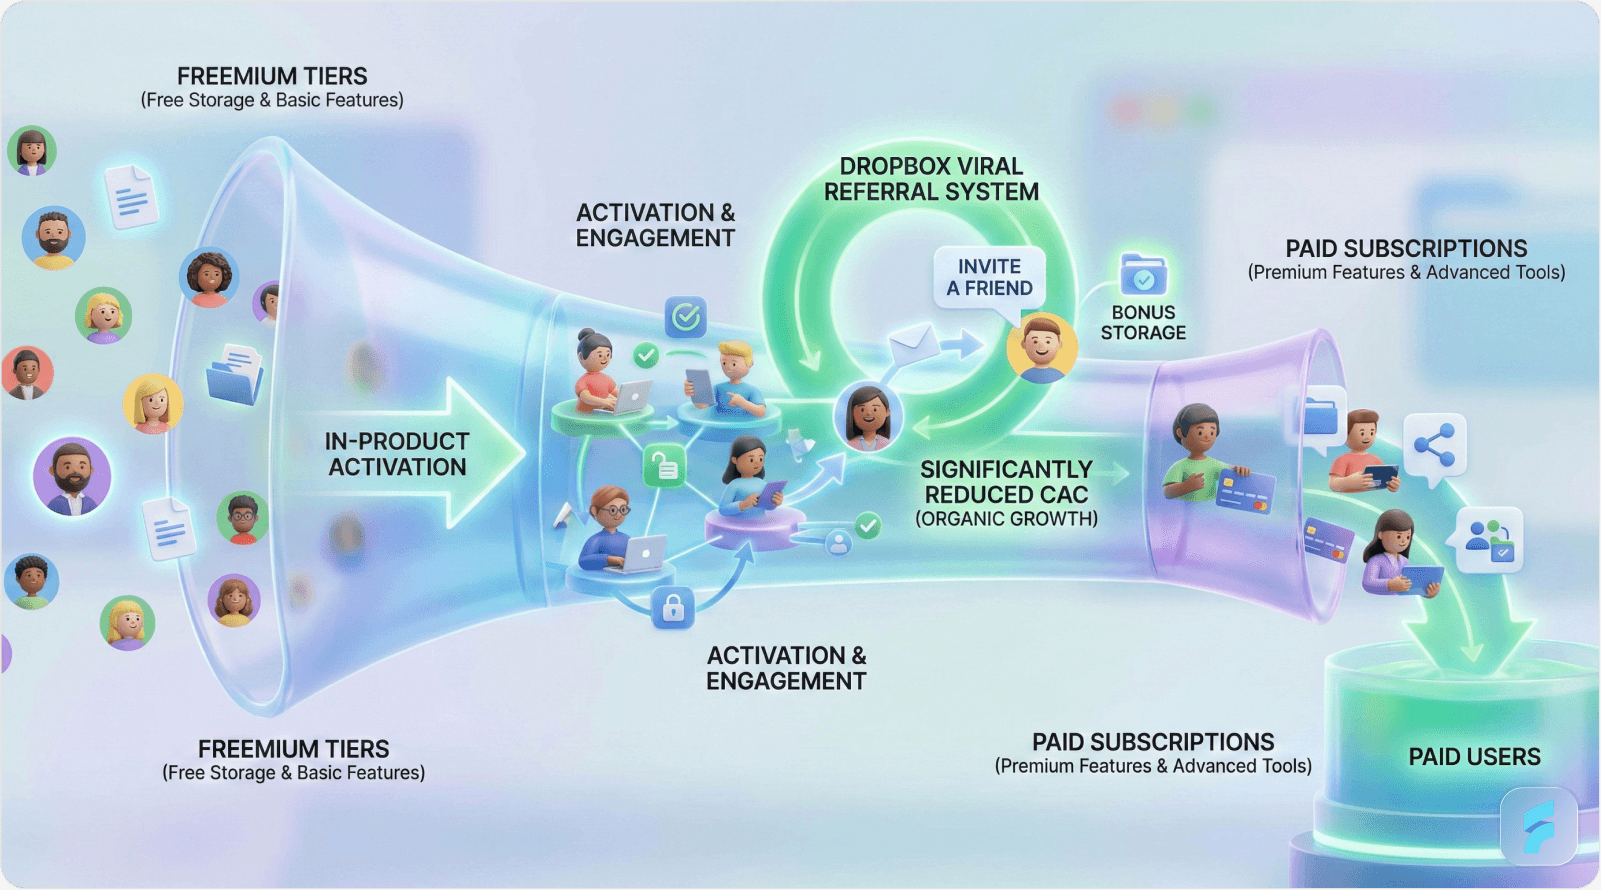
Dropbox's Viral Mechanics
Dropbox launched with 2GB free storage offering, enabling users to experience file synchronization without sales interaction. The freemium model incorporated viral mechanics accelerating adoption.
Referral Loop Architecture
Users receive 500MB additional storage per successful referral
Referred users receive 500MB bonus upon signup
Both parties benefit, creating incentive alignment
This dual-sided incentive structure generated 2.8 million referral signups within 15 months—equivalent to $40 million in saved advertising spend assuming $14 average CAC.
Dropbox's PLG approach reduced sales team requirements. At $1 billion ARR, Dropbox employed 67% fewer salespeople than comparable enterprise software companies, directly improving unit economics.
Sean Ellis, growth advisor and "growth hacking" term originator, explains: "PLG succeeds when products deliver immediate value—users must reach their 'aha moment' within first session or conversion rates collapse regardless of pricing."
Critical PLG Success Factors
Time-to-Value Optimization
Users must experience meaningful value within first 5 minutes. Analytics company Amplitude found that users completing 3+ key actions in first session demonstrate 70% higher conversion rates compared to those completing fewer actions.
Friction Removal
Every additional form field reduces conversion by 7% according to Baymard Institute. PLG leaders minimize signup requirements—Slack initially required only email address, reducing friction maximally.
Usage-Based Expansion
Optimal pricing scales with value received. Dropbox's storage-based pricing, Slack's per-active-user model, and Stripe's transaction-based fees align costs with customer success.
PLG Implementation Checklist
Identify core feature demonstrable without sales interaction
Design freemium tier delivering genuine value (not demo mode)
Implement in-product upsell prompts at natural expansion moments
Build viral mechanics (referrals, team invitations, public sharing)
Establish activation metrics tracking time-to-value
Create self-serve payment flow with minimal friction
Retrieval Block: PLG Conversion Benchmarks
Free Trial → Paid: 15-25% (30-day trials), 8-12% (14-day trials)
Freemium → Paid: 2-5% overall, 15-20% among active users
Time to Conversion: 14-28 days median for trials, 60-120 days for freemium
Activation Rate: 40-60% complete first key action within 24 hours
Micro-Summary: Product-led growth reduces CAC by 50% through self-service acquisition models. Dropbox's freemium tier with referral mechanics generated 2.8 million signups worth $40 million in saved advertising. PLG requires immediate value delivery, minimal friction, and usage-based pricing. Implementation focuses on activation optimization—users completing 3+ key actions in first session convert at 70% higher rates.
Strategy 3: Onboarding Optimization and Activation Engineering
The Activation Economics
User activation—completing setup and experiencing core value—directly determines conversion efficiency. Improved activation rates reduce effective CAC by converting higher percentages of acquired users into paying customers. Effective product design plays a crucial role in creating intuitive onboarding experiences.
Userpilot's Activation Framework
Userpilot provides no-code tools for personalized onboarding experiences. Their internal analysis across 200 SaaS clients reveals activation rate improvements averaging 38% after implementing guided onboarding flows.
Key optimization principles:
Progressive Disclosure
Present complexity gradually rather than overwhelming users initially. Show 3-5 features during first session, introducing advanced capabilities after basic mastery.
Contextual Assistance
Deploy in-app prompts at decision points rather than generic welcome tours. When users hover over unfamiliar features, display tooltips explaining functionality and benefits.
Goal-Based Personalization
Ask users their primary objective during signup, customizing onboarding toward that specific use case. Email marketing tools might offer "newsletter launch" versus "drip campaign setup" pathways.
Wes Bush, author of Product-Led Growth, notes: "Activation optimization yields 3-5x ROI compared to acquisition investment—converting 40% of trials instead of 20% doubles revenue without increasing top-of-funnel spend."
Measuring Activation Quality
Leading Indicators
Time to first key action (target: <5 minutes)
Percentage completing setup checklist (target: >60%)
Feature adoption breadth (target: 3+ features used in week 1)
Lagging Indicators
Free trial to paid conversion rate
Freemium to paid upgrade rate
30-day retention among activated users
Mixpanel's benchmark data shows that users reaching activation within 24 hours convert at 4x the rate of those requiring multiple days to activate.
Practical Implementation
Week 1: Baseline Measurement
Identify current activation rate (% completing core action)
Map user journey from signup to activation
Identify abandonment points through session recordings
Week 2-3: Intervention Design
Create checklist guiding users through setup
Build contextual tooltips at confusion points
Implement progress indicators showing completion percentage
Week 4-6: Testing and Iteration
A/B test onboarding variations
Monitor activation rate changes
Collect qualitative feedback through user interviews
Stripe's onboarding demonstrates these principles—developers integrate payment processing through clear documentation, test mode enabling experimentation, and contextual code examples accelerating implementation.
Micro-Summary: Activation optimization improves conversion rates by 38% on average, effectively reducing CAC by converting higher percentages of acquired users. Userpilot's framework emphasizes progressive disclosure, contextual assistance, and goal-based personalization. Users activating within 24 hours convert at 4x higher rates. Implementation requires identifying current activation rates, designing guided experiences, and iteratively testing improvements.
Strategy 4: Referral Programs and Advocacy Systems
The Network Effect Multiplier
Referrals generate highest-quality leads at lowest acquisition costs. Referred customers demonstrate 16% higher lifetime value and 37% better retention compared to other acquisition channels according to Wharton School research.
The trust transfer from referrer to prospect reduces sales friction dramatically. When existing customers recommend solutions, new prospects bypass skepticism stages, accelerating conversion.
Airbnb's Dual-Sided Incentive Model
Airbnb's referral program offered travel credits to both referring users and new signups—creating aligned incentives that accelerated viral adoption.
Program Mechanics
Existing users receive $25 travel credit per successful referral
New users receive $40 credit toward first booking
Credits expire within 12 months, encouraging usage
Launch results within 24 months:
Referral signups represented 25% of new user acquisition
Referred users booked at 2.1x the rate of other channels
CAC for referred customers: $25 versus $120 for paid advertising
Jonah Berger, Wharton professor and author of Contagious, states: "Referral programs succeed when sharing provides social currency—users must feel good about recommending the product, which requires delivering exceptional value first."
Designing Effective Referral Programs
Incentive Calibration
Rewards must exceed psychological sharing friction. Offering $5 credit for $1,000 product referrals fails to motivate action. Effective incentives provide 10-20% of first purchase value.
Friction Minimization
One-click sharing mechanisms outperform manual processes. Provide pre-populated email templates, unique referral links, and social media sharing buttons.
Tracking and Attribution
Implement unique referral codes enabling precise attribution. Display referral progress dashboards showing pending and completed referrals, maintaining engagement.
Social Proof Amplification
Beyond formal referral programs, systematic collection and display of customer testimonials reduces acquisition costs through trust building.
BrightLocal research shows that 79% of consumers trust online reviews as much as personal recommendations. This trust transfer reduces conversion friction, improving marketing efficiency.
Implementation Checklist
Automate review request emails 30 days post-purchase
Display testimonials prominently on landing pages
Create case study library organized by industry and use case
Implement review aggregation (G2 , Capterra , TrustRadius )
Feature customer logos on homepage and sales materials
Micro-Summary: Referral programs generate highest-quality leads at lowest costs—referred customers show 16% higher LTV and 37% better retention. Airbnb's dual-sided incentive model drove 25% of new signups at $25 CAC versus $120 for paid channels. Effective programs require meaningful incentives (10-20% of purchase value), minimal friction (one-click sharing), and precise tracking. Social proof through reviews and testimonials provides continuous trust-building without ongoing costs.
Strategy 5: Channel Attribution and Budget Optimization
The Misallocation Problem
Most SaaS companies cannot accurately attribute revenue to acquisition channels. This blindness causes budget misallocation—overspending on underperforming channels while underfunding efficient pathways.
ProfitWell research indicates that 68% of SaaS companies lack reliable attribution models, leading to suboptimal marketing spend distribution.
Multi-Touch Attribution Models
First-Touch Attribution
Credits conversion to initial discovery channel. Useful for understanding awareness-stage effectiveness but ignores nurturing impact.
Last-Touch Attribution
Credits final interaction before conversion. Overvalues bottom-funnel tactics while undervaluing top-funnel contribution.
Linear Attribution
Distributes credit equally across all touchpoints. Simple but fails to recognize that certain interactions drive more influence.
Time-Decay Attribution
Weights recent interactions more heavily. Reflects reality that proximity to conversion often indicates influence.
Custom Attribution Modeling
Assigns weights based on observed conversion patterns. Most accurate but requires sophisticated analytics infrastructure.
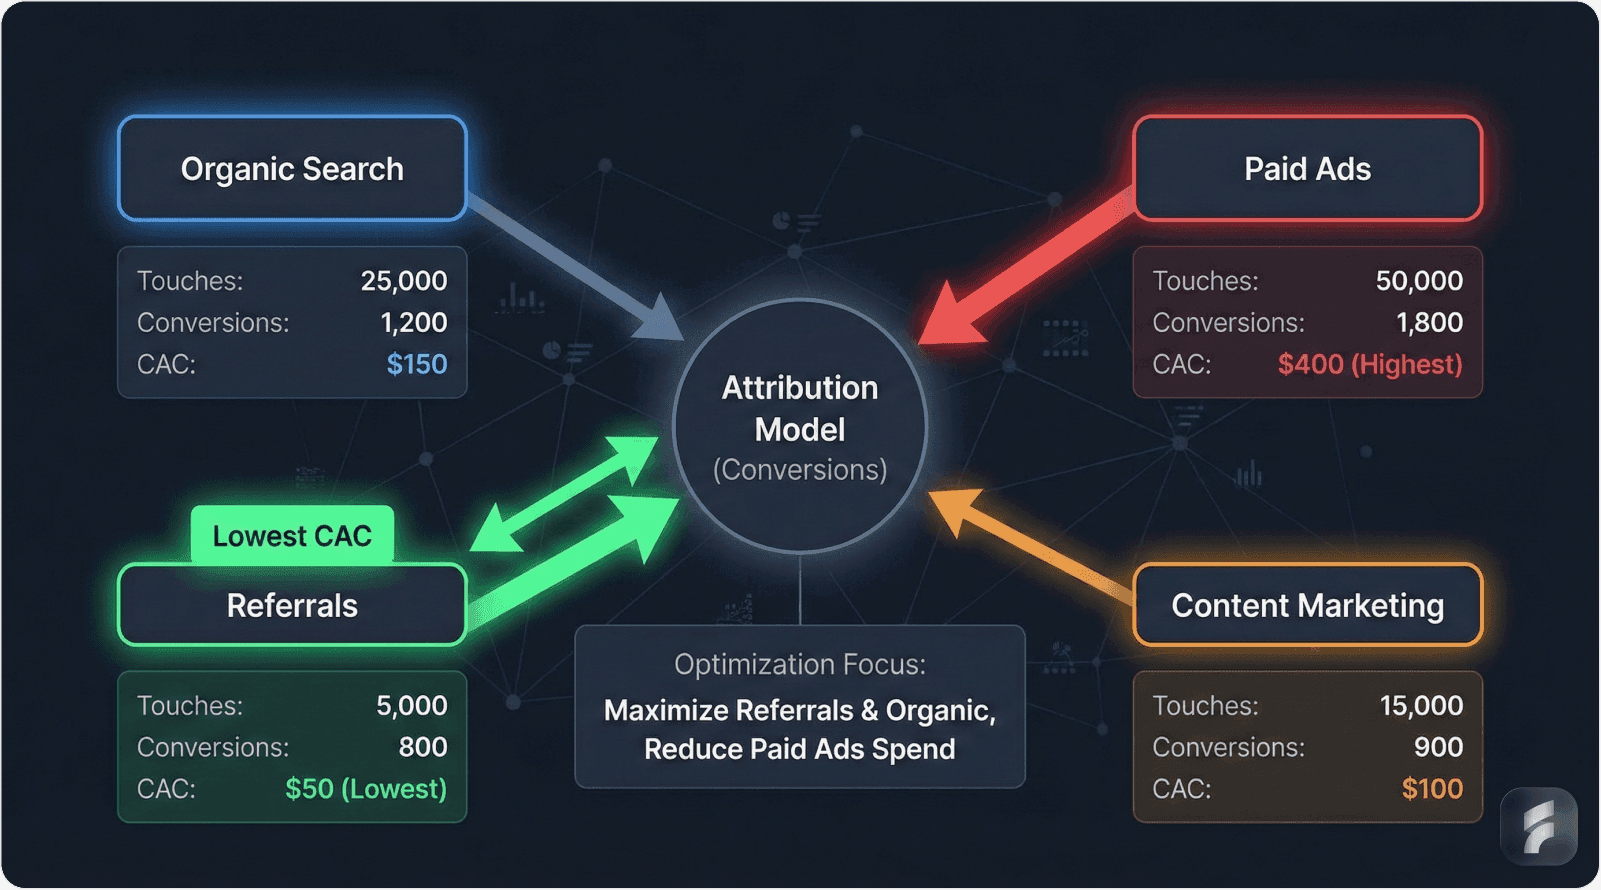
Channel Performance Analysis
Effective optimization requires calculating CAC by channel, not just blended averages.
Example Channel Breakdown
Channel | Monthly Spend | Customers Acquired | CAC | 90-Day Retention | Effective CAC |
|---|---|---|---|---|---|
Organic Search | $8,000 | 45 | $178 | 72% | $247 |
Paid Search | $15,000 | 35 | $429 | 48% | $894 |
Content Marketing | $12,000 | 55 | $218 | 78% | $279 |
LinkedIn Ads | $10,000 | 18 | $556 | 41% | $1,356 |
Referrals | $2,000 | 22 | $91 | 81% | $112 |
This analysis reveals that LinkedIn Ads generate 12x higher effective CAC than referral programs after accounting for retention differences. Budget reallocation from LinkedIn toward content and referrals improves overall unit economics.
Professor Thomas Steenburgh, University of Virginia Darden School, explains: "Channel optimization requires calculating fully-loaded CAC including sales costs, retention rates, and lifetime value—surface-level cost-per-lead metrics mislead strategic allocation."
Implementation Roadmap
Phase 1: Tracking Infrastructure
Implement UTM parameter taxonomy across all campaigns
Configure Google Analytics goals and conversion paths
Establish CRM integration for closed-loop reporting
Phase 2: Data Collection
Gather 90 days minimum data for statistical significance
Track customer journey from first touch through conversion
Record retention and expansion rates by acquisition channel
Phase 3: Analysis and Optimization
Calculate channel-specific CAC and LTV
Identify overperforming and underperforming channels
Reallocate 20% of budget toward top performers
Phase 4: Continuous Iteration
Review channel performance monthly
Test new channels at 10% budget allocation
Sunset channels failing to achieve target efficiency
Micro-Summary: Sixty-eight percent of SaaS companies lack reliable attribution, causing budget misallocation. Multi-touch attribution models provide visibility into channel performance beyond surface-level metrics. Example analysis revealed 12x CAC variance between channels after accounting for retention. Implementation requires tracking infrastructure, 90-day data collection, systematic analysis, and continuous optimization. Reallocating budget from underperforming channels reduces blended CAC by 30-40%.
Strategy 6: Retention Optimization and LTV Enhancement
The Unit Economics Relationship
CAC cannot be evaluated independently—it exists within the broader context of customer lifetime value. The LTV:CAC ratio determines business viability.
Benchmark Targets
Below 1:1 = Unsustainable (losing money per customer)
1:1 to 3:1 = Marginal viability
3:1 to 5:1 = Healthy unit economics
Above 5:1 = Excellent efficiency
Improving retention and expansion directly increases LTV, making higher CAC economically sustainable. A comprehensive UX audit can identify friction points impacting user retention.
Salesforce's Expansion Strategy
Salesforce accepts elevated initial CAC by optimizing for lifetime value through aggressive cross-selling and upselling.
Multi-Product Strategy
Sales Cloud (initial purchase point)
Service Cloud (customer support expansion)
Marketing Cloud (marketing automation upsell)
Commerce Cloud (e-commerce expansion)
Tableau (analytics cross-sell)
This product suite enables account expansion from $15,000 initial contracts to $100,000+ annual spend within 36 months. The company's 120% net dollar retention rate means existing customers generate 20% more revenue annually even before new customer acquisition.
Patrick Campbell, ProfitWell founder, notes: "Retention optimization provides 3-5x ROI compared to acquisition optimization—a 5% retention improvement can increase profits by 25-95% depending on business model."
Retention Optimization Tactics
Proactive Customer Success
Assign customer success managers to high-value accounts, conducting quarterly business reviews and identifying expansion opportunities.
Value Realization Tracking
Monitor product usage indicating value reception. Users not achieving outcomes face high churn risk requiring intervention.
Educational Programming
Develop certification programs, webinars, and documentation helping customers maximize product value. Educated users demonstrate 40% higher retention according to Gainsight research.
Churn Prediction Modeling
Implement machine learning models predicting churn risk based on usage patterns, support ticket volume, and engagement metrics. Early identification enables retention interventions.
Expansion Revenue Mechanics
Usage-Based Upselling
As customer usage grows, pricing scales automatically. Twilio's communication API charges per message/call—customer growth directly increases revenue without sales intervention.
Feature-Based Upgrades
Segment features across pricing tiers, prompting upgrades as customer needs expand. Slack's free tier limits message history, encouraging paid upgrades for growing teams.
Seat-Based Expansion
Price per user enables frictionless expansion as teams grow. Initial 5-person team purchase expands to 50+ users organically.
Retrieval Block: Net Dollar Retention Benchmarks
Below 90%: Significant churn problem requiring immediate attention
90-100%: Retention acceptable but lacks expansion
100-110%: Healthy combination of retention and expansion
110-120%: Excellent performance indicating strong product-market fit
Above 120%: Elite performance seen in top-tier SaaS companies
Micro-Summary: LTV:CAC ratio determines unit economics viability—target minimum 3:1 for sustainable growth. Salesforce optimizes lifetime value through multi-product cross-selling, expanding accounts from $15K to $100K+ annually. Retention optimization provides 3-5x ROI versus acquisition optimization. Implementation requires proactive customer success, value tracking, educational programming, and churn prediction modeling. Expansion mechanisms include usage-based, feature-based, and seat-based pricing models.
Conclusion: Systematic CAC Reduction
High customer acquisition costs threaten SaaS sustainability, but systematic optimization reduces CAC by 40-60% without compromising growth quality.
The six strategies form an integrated system: content marketing generates organic leads, product-led growth enables self-service conversion, activation engineering improves trial success, referral programs create viral acquisition, channel optimization eliminates waste, and retention enhancement justifies acquisition investment.
Implementation requires commitment—content marketing demands 12 months before substantial returns, PLG requires product refactoring, and attribution infrastructure needs technical investment. But companies implementing these strategies achieve sustainable competitive advantages through superior unit economics.
Bessemer Venture Partners' efficiency score framework confirms that companies maintaining CAC payback under 12 months while achieving 100%+ net dollar retention command premium valuations and sustainable growth trajectories.
Begin with channel attribution establishing baseline performance. Implement quick wins through activation optimization and referral programs. Build long-term assets through content marketing and PLG transformation.
The playbook exists. Execution determines outcomes.
For expert guidance on optimizing your SaaS product and reducing acquisition costs through better user experience, explore our comprehensive services at Saasfactor, or learn more about our UX optimization strategies.
Glossary of Key Terms
Activation Rate: Percentage of new users completing setup and experiencing core product value within defined timeframe (typically 7-30 days). Higher activation directly improves conversion efficiency.
Blended CAC: Total sales and marketing expenses divided by new customers acquired—provides aggregate view but obscures channel-specific performance requiring deeper analysis.
CAC Payback Period: Months required to recover customer acquisition cost through gross margin. Calculated as CAC ÷ (Monthly Recurring Revenue × Gross Margin %). Target under 12 months for sustainable growth.
Churn Rate: Percentage of customers discontinuing subscriptions in defined period (typically monthly or annually). High churn destroys unit economics regardless of acquisition efficiency.
Cohort Analysis: Grouping customers by acquisition timeframe to analyze retention, expansion, and lifetime value patterns. Reveals whether unit economics improve or deteriorate over time.
Conversion Rate: Percentage of prospects completing desired action (trial signup → paid customer, freemium → paid upgrade). Small conversion improvements dramatically impact CAC.
Customer Lifetime Value (LTV): Total gross profit generated by customer over entire relationship duration. Calculated as Average Revenue Per User × Gross Margin % × Average Customer Lifespan.
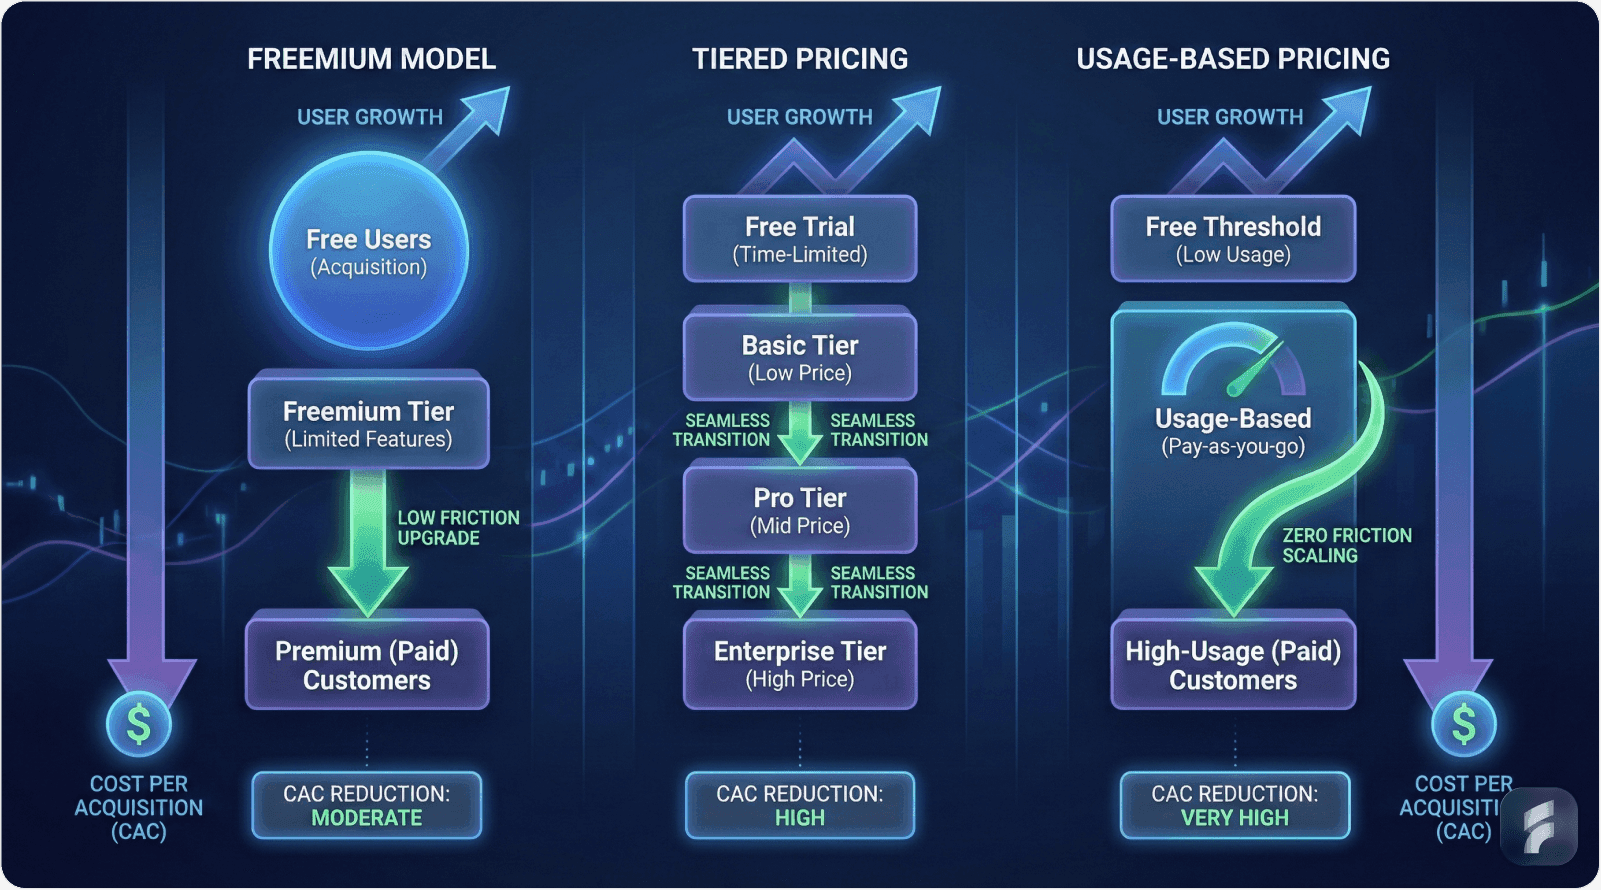
Freemium Model: Pricing strategy offering perpetual free tier with limited functionality, prompting upgrades as usage or needs expand. Reduces acquisition friction but requires compelling upgrade triggers.
Lead Velocity Rate (LVR): Month-over-month growth rate of qualified leads—leading indicator of future revenue growth. LVR >15% monthly indicates strong pipeline health.
Magic Number: Sales and marketing efficiency metric calculated as (Quarterly Recurring Revenue Growth × 4) ÷ Prior Quarter Sales & Marketing Spend. Values >0.75 indicate efficient spending.
Net Dollar Retention (NDR): Revenue retained from existing customer cohort including expansion, downgrades, and churn. Above 100% means existing customers generate growth independent of new acquisition.
Product-Market Fit: Degree to which product satisfies strong market demand. Manifests in organic growth, high retention, unsolicited recommendations, and customer frustration during downtime.
Time-to-Value: Duration from initial signup to experiencing meaningful product benefit. Shorter time-to-value improves activation and conversion rates substantially.
Viral Coefficient: Number of new users generated per existing user through referrals or sharing. Coefficient >1.0 creates exponential growth independent of paid acquisition.
Authoritative References
Research Institutions and Data Sources Cited
Pacific Crest SaaS Survey - Annual SaaS metrics benchmarking across growth-stage companies
Bessemer Venture Partners - Cloud index research and efficiency score framework
Gartner Research - B2B buyer behavior and technology adoption patterns
OpenView Partners - Product-led growth benchmarking and implementation research
Content Marketing Institute - Content strategy ROI and implementation effectiveness
Demand Curve - Growth marketing tactics and conversion optimization
Wharton School - Referral economics and customer acquisition research
ProfitWell - SaaS pricing, retention, and attribution analysis
Baymard Institute - Conversion optimization and user experience research
Mixpanel - Product analytics and user behavior benchmarking
Ahrefs - SEO strategy and organic search performance research
BrightLocal - Online review impact and consumer trust research
Gainsight - Customer success metrics and retention optimization
University of Virginia Darden School - Marketing attribution and channel optimization
Industry Thought Leaders Referenced
Professor David Skok - Matrix Partners venture capitalist and SaaS metrics authority
Ann Handley - MarketingProfs Chief Content Officer and content marketing strategist
Sean Ellis - Growth hacking methodology creator and PLG advisor
Wes Bush - Product-Led Growth book author and implementation framework architect
Jonah Berger - Wharton professor and viral marketing researcher
Professor Thomas Steenburgh - Marketing attribution and channel optimization expert
Patrick Campbell - ProfitWell founder and SaaS pricing researcher
Companies and Case Studies Analyzed
Salesforce - Enterprise CRM platform pioneering cloud software model
HubSpot - Marketing automation and inbound methodology leader
Slack - Workplace communication platform demonstrating PLG success
Dropbox - File synchronization service exemplifying viral growth mechanics
Airbnb - Marketplace platform with sophisticated referral program
Userpilot - Product adoption platform specializing in onboarding optimization
Stripe - Payment infrastructure with developer-focused PLG approach
Twilio - Communications API demonstrating usage-based pricing model