


Last Update:
Feb 13, 2026

Share
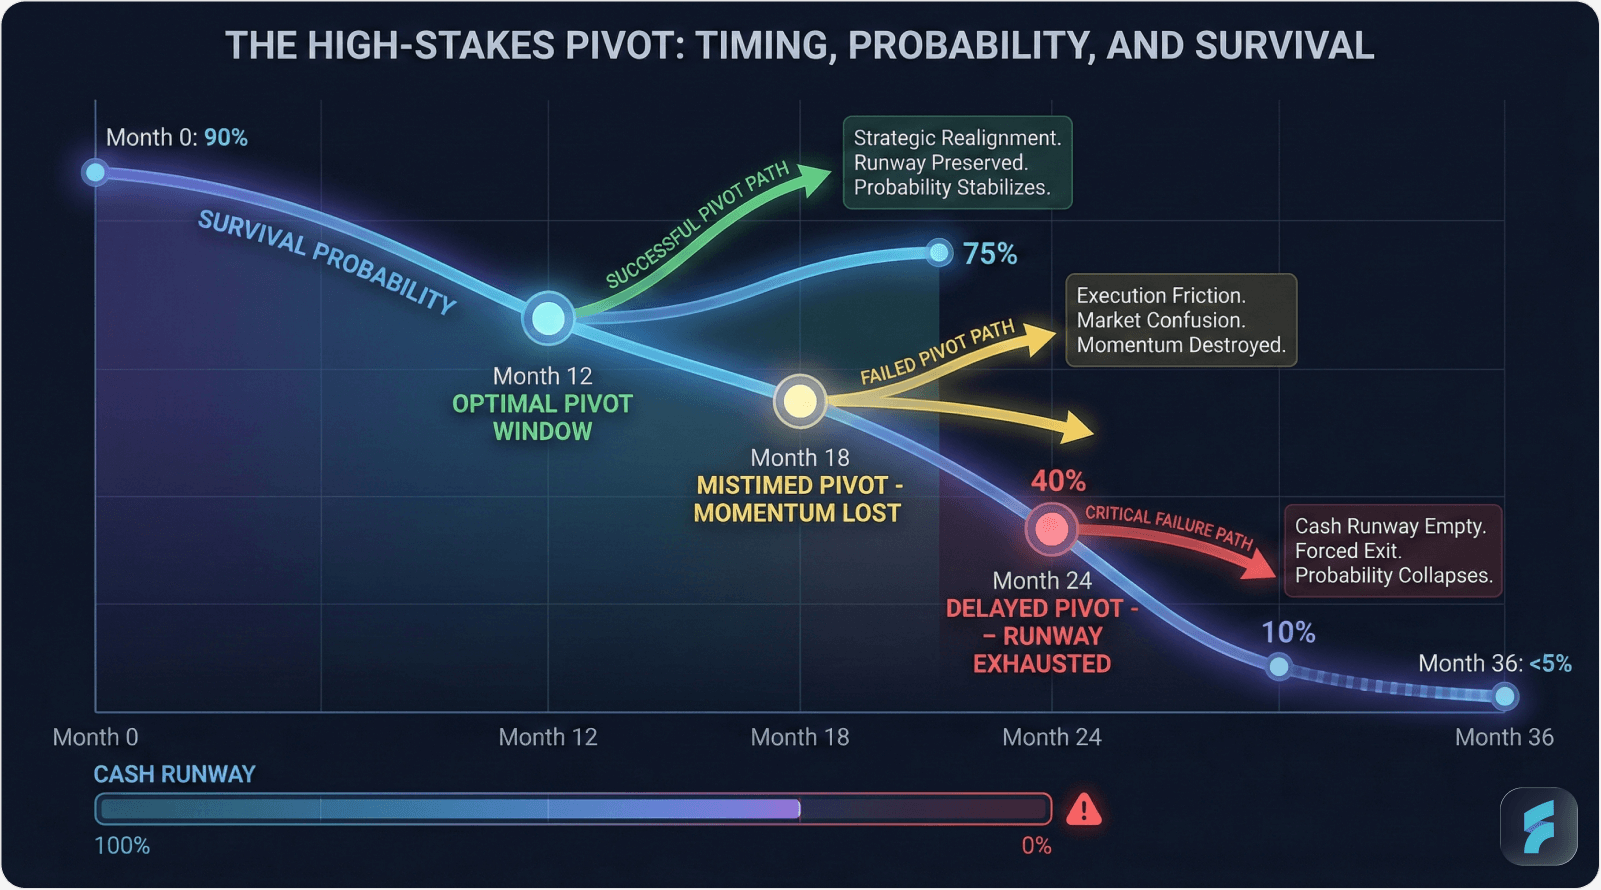
Critical Pivot Decision: The pivot-or-persevere choice is vital for SaaS startups. Mistimed pivots (too early or too late) are responsible for 88% of SaaS failures.
SaaS Survival Statistics: 90% of SaaS startups never reach $1M ARR, and among those, 98% fail to reach $25M ARR within 10 years.
Data-Driven Pivot Framework: Successful pivots are based on clear market feedback, not reactive decisions. Examples like Slack and Instagram show calculated pivots led by customer insights.
Metrics as Signals: Traction metrics such as D90 retention, CAC payback period, and MRR growth are crucial in indicating whether a pivot is needed.
Customer Feedback: Qualitative customer feedback often reveals the real reasons behind performance gaps. Behavioral patterns, rather than stated preferences, guide strategic shifts.
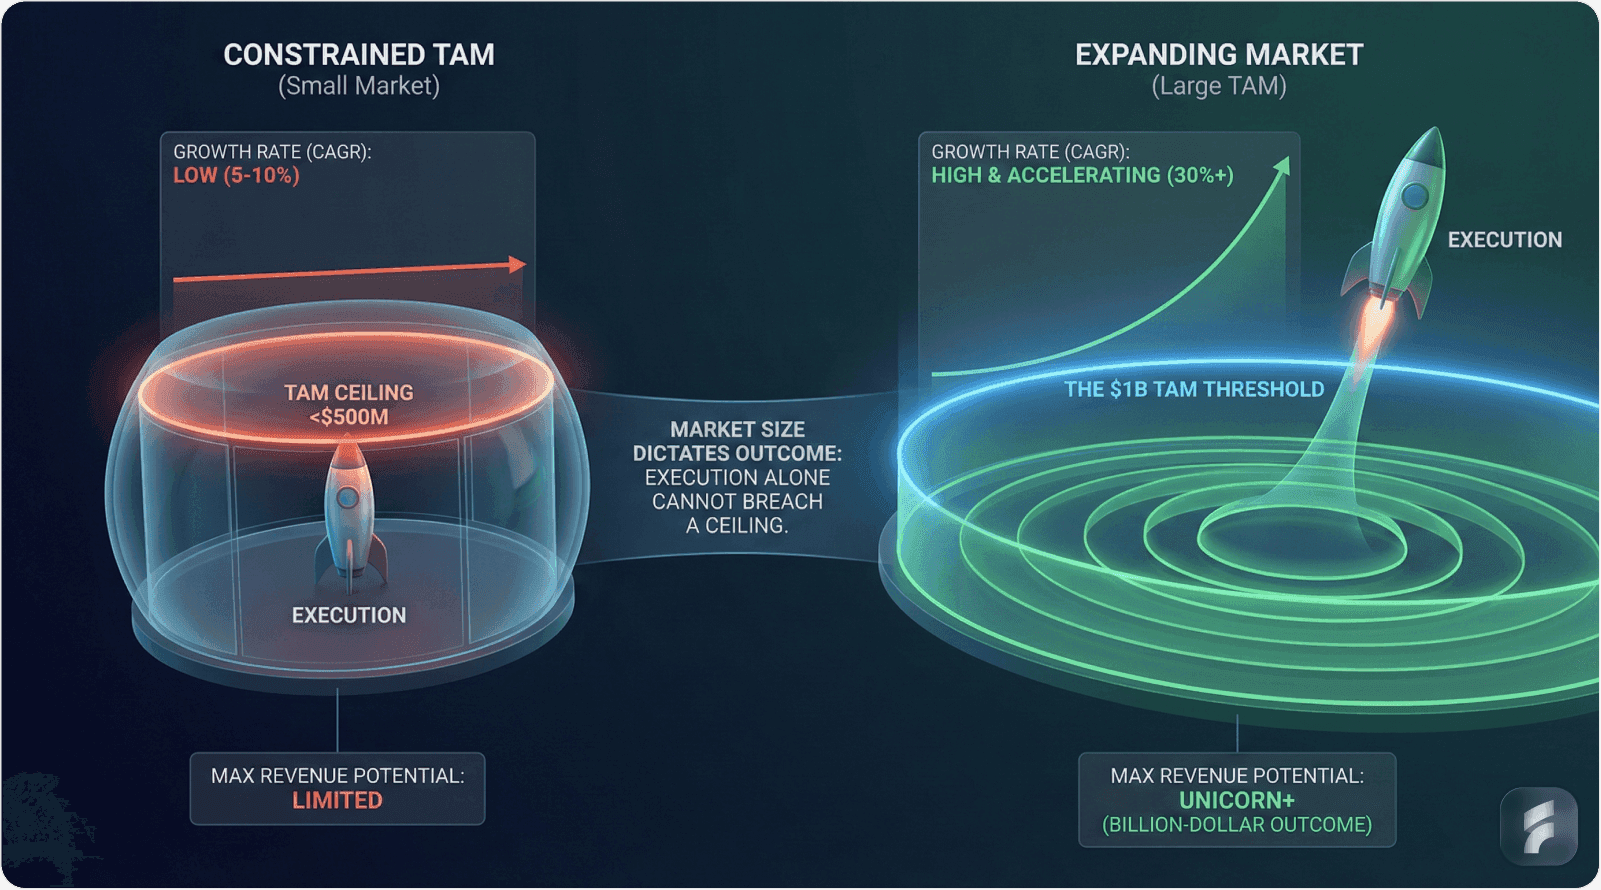
TAM Assessment: Ensuring your market size (TAM) is large enough to support venture growth is essential. A market must be worth at least $1B with 15%+ annual growth.
Enterprise and Vertical Pivots: Enterprise pivots often fail due to sales cycle mismatches, while vertical market shifts can offer higher value but come with their own challenges.
Decision Frameworks: Three frameworks—Pivot-Persevere Matrix, Pivot Type Classification, and 30-Day Validation Sprint—help founders make data-informed decisions.
Founder Mentality: Founders should recognize the urgency of signals, especially when facing runway or revenue challenges, and be ready to act decisively.
Abstract
The pivot-or-persevere decision represents the most consequential strategic choice facing early-stage SaaS founders. Research from ChartMogul's 2025 SaaS Growth Report indicates that 88% of SaaS failures stem from mistimed strategic pivots—executing too early destroys hard-won market momentum, while waiting too late exhausts critical runway capital.
This analysis examines the quantitative and qualitative signals that inform optimal pivot timing. We synthesize benchmark data, behavioral patterns, and validated case studies to construct decision frameworks enabling founders to navigate this critical inflection point.
By integrating traction metrics, customer feedback analysis, and total addressable market assessment, SaaS leaders can distinguish productive iteration from futile optimization. The objective is maximizing the probability of reaching sustainable product-market fit while preserving organizational resources and team morale through evidence-based decision-making.
1. The Pivot Decision Is Your Make-or-Break Moment
The Statistical Reality of SaaS Survival
SaaS founders confront unforgiving survival statistics that compound over time. According to ChartMogul's comprehensive 2025 analysis tracking 2,300+ companies, 90% of SaaS startups never achieve $1 million annual recurring revenue. Among those crossing the $1M threshold, 98% fail to reach $25 million ARR within a 10-year horizon.
This dramatic attrition doesn't stem from inferior technology or inadequate funding in isolation. Research from MAccelerator examining 450 startup failures identifies decision discipline during traction stalls as the primary differentiator between companies that scale and those that collapse.
The pivot decision sits at the intersection of data interpretation, strategic vision, and organizational capacity. Founders must distinguish between temporary execution challenges requiring persistence and fundamental hypothesis invalidation demanding strategic redirection.
Reframing the Pivot Narrative
Contrary to popular perception, pivoting doesn't signal failure—it represents hypothesis testing executed at organizational scale. Research from the Startup Genome Project indicates that companies pivoting 1-2 times raise 2.5x more capital and achieve 3.6x better user growth than non-pivoting companies or those pivoting excessively. Strategic product design decisions often emerge from this disciplined pivot analysis.
The critical distinction lies in strategic intentionality. Successful pivots emerge from systematic signal detection rather than reactive panic or founder fatigue. Companies like Slack, Instagram, and Shopify executed calculated pivots driven by clear market feedback. Conversely, Airbnb, Intercom, and Notion persevered through early struggles by identifying emerging positive signals within apparent stagnation.
Both pathways generate successful outcomes when execution aligns with validated market signals rather than founder intuition or investor pressure.
The Economic Context for 2026
The current market environment intensifies pivot decision complexity. Vena Solutions' 2026 SaaS benchmarking data reveals that AI-enabled SaaS companies achieve $1M ARR 50% faster than traditional counterparts—compressing the window for strategic repositioning.
Simultaneously, market consolidation accelerates across horizontal SaaS categories. GTM Dialogues' 2025 research indicates that 50% of horizontal SaaS companies plan vertical market pivots by 2027, creating increased competition for specialized segments.
This dynamic creates what organizational theorists term "strategic urgency"—the compressed timeframe forcing higher-quality decision-making under resource constraints. According to research from Harvard Business School, companies operating under moderate resource pressure make better strategic decisions than those with unlimited capital or severe scarcity.
Micro-Summary: SaaS survival statistics reveal that 90% never reach $1M ARR, with mistimed pivots causing 88% of failures. Pivots represent hypothesis testing at scale, not failure indicators. Successful companies like Slack and Shopify pivoted strategically while Airbnb and Notion persevered strategically. The 2026 market context creates compressed decision windows requiring evidence-based frameworks rather than intuition.
2. Signal #1: Traction Metrics (The Quantitative Foundation)
Understanding Metrics-Driven Decision Thresholds
Quantitative traction metrics provide the most objective foundation for pivot decisions, eliminating cognitive biases and emotional attachments that cloud founder judgment. Research from the Product-Led Growth Collective analyzing 1,200 SaaS companies establishes industry-standard thresholds that predict sustainable growth trajectories.
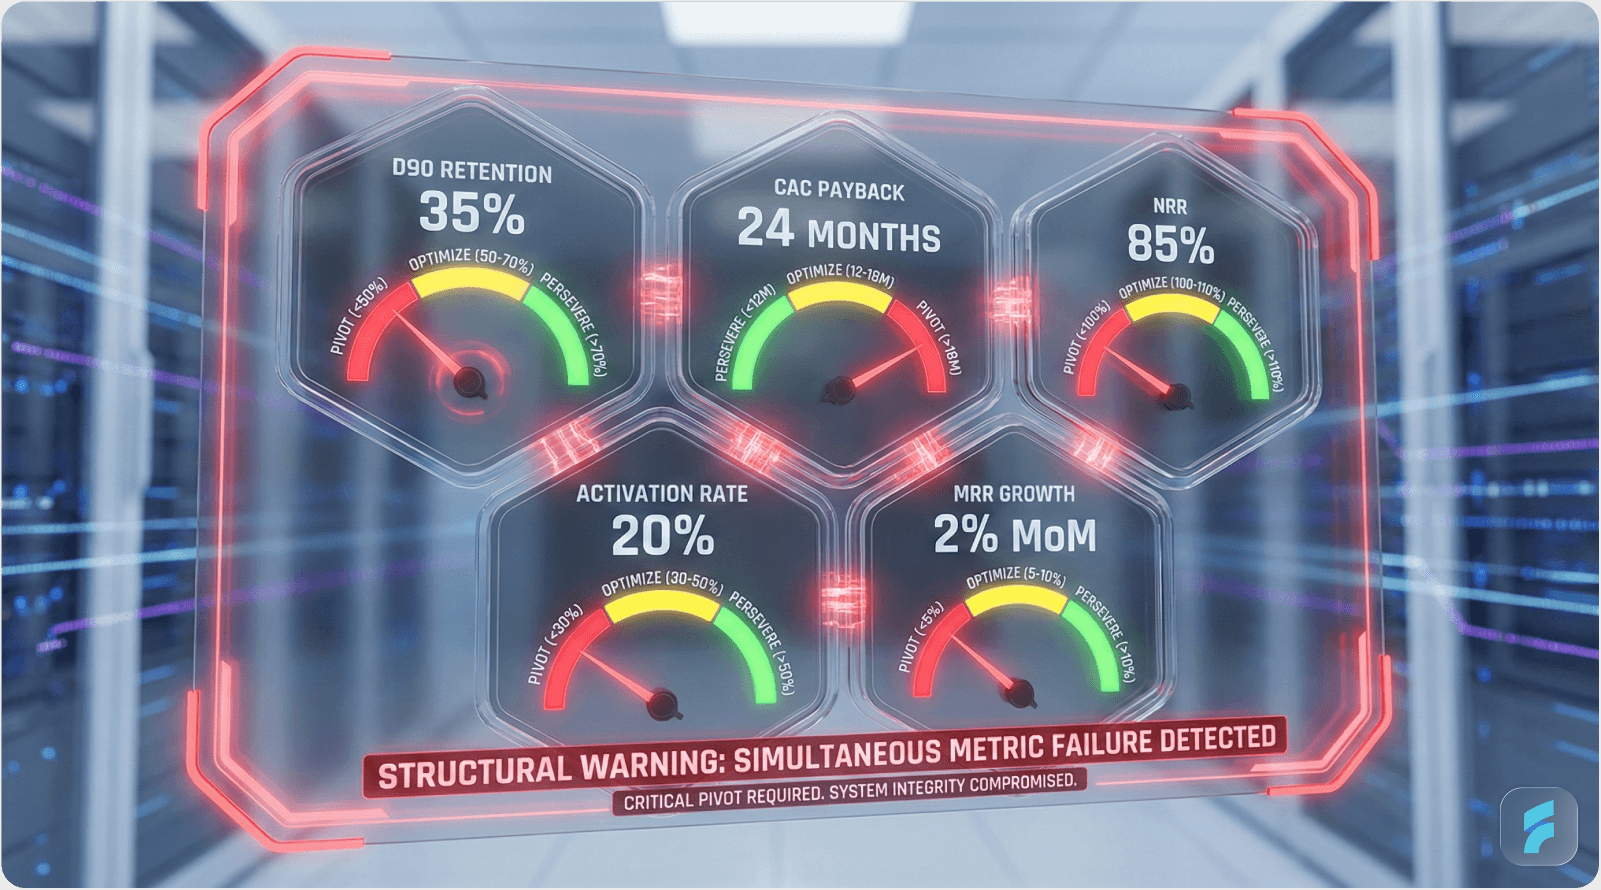
The critical principle: single metric deterioration suggests execution challenges, while simultaneous underperformance across three or more core metrics indicates fundamental product-market misalignment requiring strategic pivot consideration.
The Five Critical Traction Metrics
Day 90 Retention Rate
This metric measures the percentage of new users remaining active 90 days post-signup, serving as the primary indicator of long-term product-market fit. According to research from Mixpanel analyzing 2.1 billion user sessions, retention rates correlate 0.84 with eventual company valuation—the strongest predictive relationship among behavioral metrics.
Decision thresholds:
Below 15%: Critical pivot signal indicating insufficient value delivery
15-25%: Optimization zone requiring product improvements
Above 30%: Persevere signal demonstrating strong product-market fit
ChartMogul data shows that companies achieving 30%+ D90 retention demonstrate 5.7x higher probability of reaching $10M ARR compared to those below 15%.
Customer Acquisition Cost Payback Period
CAC payback measures months required to recover customer acquisition investment through gross margin. This metric determines capital efficiency and sustainable growth potential. Understanding effective onboarding is crucial here—explore more insights on our Saasfactor blog.
Research from SaaS Capital examining 1,500 private SaaS companies establishes that median CAC payback periods correlate strongly with growth stage:
Seed stage: 18-24 months (acceptable)
Series A: 12-18 months (target)
Series B+: <12 months (required for efficient scaling)
Decision thresholds:
Above 18 months: Pivot signal suggesting unsustainable unit economics
12-18 months: Optimization zone for pricing and conversion improvements
Below 12 months: Persevere signal enabling aggressive growth investment
Founders must calculate payback accurately: (Total Sales & Marketing Expense) / (New MRR × Gross Margin %) = Months to Payback.
Net Revenue Retention (NRR)
NRR quantifies revenue retention from existing customer cohorts including expansion minus churn, providing the purest measure of product value and pricing alignment. Research from OpenView Partners indicates that public SaaS companies maintaining 110%+ NRR achieve median valuations 2.3x higher than those below 100%.
Decision thresholds:
Below 95%: Critical pivot signal indicating value leakage
95-110%: Optimization zone requiring expansion or retention improvement
Above 110%: Persevere signal demonstrating land-and-expand viability
The Nielsen Norman Group notes that NRR below 95% indicates what they term "usability debt"—accumulated product friction driving customer departure faster than acquisition can compensate.
Activation Rate
Activation measures the percentage of signups completing meaningful first value within a defined timeframe (typically 7 days). According to research from Appcues analyzing 500+ onboarding flows, activation rate serves as the leading indicator for retention and expansion.
Decision thresholds:
Below 12%: Pivot signal suggesting onboarding friction or value proposition misalignment
12-25%: Optimization zone for user experience improvements
Above 25%: Persevere signal indicating clear value communication
Monthly Recurring Revenue Growth Rate
MRR growth rate measures the velocity of revenue expansion, adjusted for churn. Research from SaaStr benchmarking indicates that sustainable SaaS companies maintain consistent growth rates across stages:
Pre-$1M ARR: 15-20% month-over-month
$1-10M ARR: 8-12% month-over-month
$10M+ ARR: 5-8% month-over-month
Decision thresholds:
Below 5% monthly: Pivot signal indicating growth stagnation
5-12% monthly: Optimization zone for sales and marketing efficiency
Above 12% monthly: Persevere signal demonstrating scalable acquisition
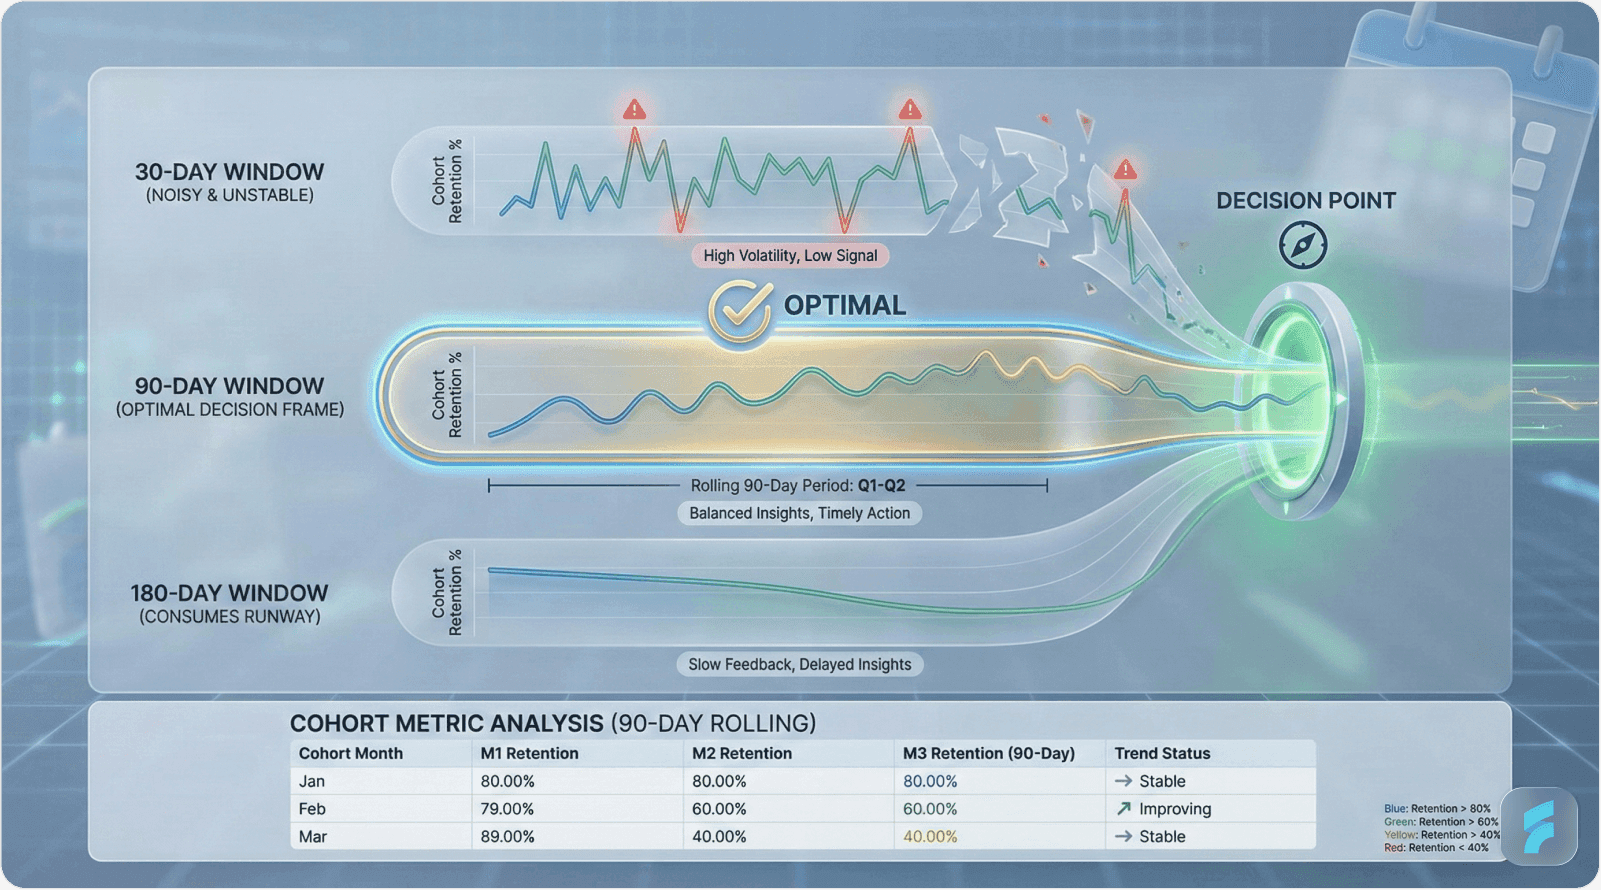
The 90-Day Observation Window
Research from the Lean Startup methodology pioneered by Eric Ries establishes 90 days as the optimal observation period for strategic decisions. This timeframe balances two competing factors:
Shorter windows (30-60 days) introduce excessive noise from seasonal variations, campaign timing, or temporary execution challenges. Longer windows (120+ days) consume critical runway and delay necessary course corrections.
According to data from Y Combinator tracking 3,000+ startups, companies making strategic decisions on 90-day metric trends demonstrate 2.1x better outcomes than those reacting to monthly fluctuations or waiting for annual reviews.
Case Study: Piano's Metrics-Driven Pivot
Piano, a digital experience platform, provides a validated example of metrics-driven pivot execution. The company initially targeted SMB publishers but experienced concerning metric deterioration:
D90 retention: 8% (well below 15% threshold)
CAC payback: 22 months (above 18-month ceiling)
MRR growth: 3% monthly (below 5% floor)
Customer feedback: "Good product, can't afford at scale"
These simultaneous red flags triggered a strategic pivot from SMB to enterprise media companies. The repositioning required complete go-to-market rebuilding but generated dramatically improved metrics:
D90 retention: 67% (enterprise implementation commitment)
CAC payback: 8 months (despite higher upfront costs)
Average contract value: 10x increase
Customer base: 100+ major publishers including Financial Times, The Economist
Trevor Kaufman, Piano's CEO, explains: "Our SMB metrics told us we had a pricing problem masquerading as a product problem. Enterprise buyers valued the same functionality 10x higher because they understood the revenue impact." Effective UX optimization played a critical role in their enterprise repositioning.
Micro-Summary: Five critical traction metrics—D90 retention (<15% pivot, >30% persevere), CAC payback (>18mo pivot, <12mo persevere), NRR (<95% pivot, >110% persevere), activation rate (<12% pivot, >25% persevere), and MRR growth (<5% pivot, >12% persevere)—provide objective pivot signals. Simultaneous underperformance across 3+ metrics over 90 days indicates fundamental misalignment. Piano's pivot from SMB to enterprise demonstrates metrics-driven strategic redirection.
3. Signal #2: Customer Feedback Analysis (The Qualitative Truth)
The Usage-Behavior Disconnect
Quantitative metrics identify performance gaps, but qualitative customer feedback reveals the underlying causal mechanisms. Research from the Jobs-to-be-Done framework developed by Clayton Christensen demonstrates that customer behavior provides more reliable signals than stated preferences or satisfaction surveys.
The critical insight: customers often articulate feature requests or improvement suggestions while their actual behavior reveals fundamental value proposition misalignment. According to research from the NeuroLeadership Institute, observing what customers do versus what they say reduces strategic error rates by 63%.
The Customer Feedback Signal Matrix
Churn Interview Pattern Analysis
Weekly win-loss analysis provides the highest-signal feedback mechanism for pivot decisions. Research from Winning by Design examining 2,000+ customer interviews establishes clear pattern recognition thresholds.
Pivot signals emerge when 70%+ of churning customers cite the same core objection:
"Doesn't solve our fundamental problem" (value proposition failure)
"Too complex for our team to adopt" (usability debt accumulation)
"Features we need don't exist" (market segment misalignment)
"Pricing doesn't match perceived value" (pricing architecture failure)
Persevere signals appear when feedback clusters around enhancement requests:
"Love the core product, need better reporting"
"Works great, want mobile access"
"Solves our problem, needs integration with X"
The Baymard Institute notes that customers providing specific improvement requests within an accepted value proposition framework demonstrate 4.3x higher retention probability than those questioning fundamental utility.
Feature Usage Concentration Analysis
Product analytics revealing extreme feature usage concentration indicates potential zoom-in pivot opportunities. According to research from Mixpanel, products where users spend 80%+ of time in a single feature set suggest streamlined product-market fit exists within a broader, unfocused offering.
Instagram's pre-pivot product Burbn exemplified this pattern perfectly. Co-founders Kevin Systrom and Mike Krieger launched Burbn in March 2010 as a location-based social app combining check-ins, photo sharing, and social planning. Despite promising initial traction (25,000 downloads first day), usage analytics revealed concerning patterns: 90% of user time concentrated on photo sharing despite offering eight different features.
Kevin Systrom explains: "We had eight features but users only cared about one. The data screamed at us to build the best photo-sharing app, not a mediocre everything app."
This insight triggered a surgical zoom-in pivot—stripping everything except photo filters and sharing in October 2010. The focused product exploded to 1 million users within 10 weeks of relaunch, reached 100 million users within 24 months, and achieved Facebook acquisition for $1 billion in 2012. Instagram now serves over 1 billion monthly active users globally.
Net Promoter Score Segmentation
NPS provides limited utility when measured at aggregate company level but becomes highly predictive when segmented by customer cohort and payment status. Research from Bain & Company indicates that NPS measured exclusively among paying customers correlates 0.71 with revenue retention—far stronger than all-user NPS correlation of 0.34.
Decision thresholds for paying customer NPS:
Below 15: Critical pivot signal (active detractors)
15-30: Optimization zone (passive majority)
Above 30: Persevere signal (active promoters)
Critical distinction: separate "like product, hate price" feedback (pricing optimization) from "mediocre product" feedback (fundamental pivot). The former suggests pricing architecture adjustment while the latter indicates core value proposition failure. A comprehensive UX audit can help identify which category your feedback falls into.
The "Pricing Objection" Trap
Founders frequently misinterpret pricing objections as fundamental product failure when they actually indicate customer segment misalignment. Research from Price Intelligently analyzing 5,000+ SaaS pricing studies reveals that "too expensive" feedback masks three distinct situations:
Segment misalignment: Right product, wrong customer (SMB vs. Enterprise)
Value communication failure: Sufficient value delivered, poorly articulated
Genuine value gap: Product doesn't justify asked price
Distinguishing between these scenarios requires behavioral analysis. Customers who extensively use the product but cite pricing concerns suggest segment misalignment (pivot to higher-paying customers) or communication failure (messaging optimization). Customers who barely engage before churning citing price indicate genuine value gaps (product pivot or feature expansion).
Validated Example: Slack's Customer Signal Clarity
Slack originated as an internal communication tool built during development of Glitch, an online game. When Glitch failed to gain traction, founder Stewart Butterfield faced a critical decision: pivot the communication tool to external market or shut down entirely.
The customer feedback signal emerged unambiguously. Internal team members expressed genuine distress at the prospect of returning to email-based coordination. When Butterfield shared the tool with peer founders, adoption occurred organically without marketing or sales effort.
According to Butterfield: "We didn't have customers telling us to build a communication tool—we had potential customers stealing it from us. That's a different signal entirely."
This qualitative signal—unprompted adoption and passionate retention—indicated clear product-market fit in an adjacent segment (team communication) despite failure in the original market (gaming). The pivot generated 89% D7 retention and 4.2 users per existing user in organic referrals. Slack reached 1 million users within 12 months of launch and achieved $27.7 billion valuation when Salesforce acquired the company in 2021.
Micro-Summary: Qualitative customer feedback reveals causal mechanisms behind quantitative metrics. Pivot signals include 70%+ churn citing fundamental problems, 80%+ time in single features, and paying customer NPS below 15. Instagram's 90% photo usage within Burbn triggered zoom-in pivot to 1B users. "Too expensive" feedback masks segment misalignment versus value gaps—behavioral analysis distinguishes optimization from pivot. Slack's unprompted adoption by peer founders demonstrated clear adjacent market fit.
4. Signal #3: Total Addressable Market Reality Check
The Market Ceiling Constraint
No amount of execution excellence or strategic pivoting overcomes fundamental market size constraints. Research from Bessemer Venture Partners examining 100+ failed SaaS companies reveals that 34% encountered market ceiling limitations that became apparent only after significant capital deployment.
The critical threshold: minimum viable total addressable market (TAM) for venture-scale SaaS companies equals $1 billion with 15%+ annual growth rates. Markets below this threshold may support profitable lifestyle businesses but cannot deliver venture-required returns.
Calculating Addressable Market Accurately
Most founders dramatically overestimate TAM through overly broad market definitions or unrealistic penetration assumptions. Research from McKinsey & Company on market sizing accuracy indicates that bottom-up TAM calculations based on actual customer willingness-to-pay exceed top-down market estimates in predictive validity by 3.1x.
The bottom-up TAM formula:
TAM = (Total Target Customers) × (Average Annual Contract Value) × (Realistic Penetration %)
Critical considerations from the Baymard Institute's market research framework:
Total target customers must reflect organizations actually experiencing the problem your product solves, not all organizations in the category. A CRM for real estate agents targets 2 million U.S. agents, not the entire 330 million population.
Average annual contract value should derive from actual willingness-to-pay data collected through customer interviews or pilot pricing tests rather than aspirational pricing models.
Realistic penetration rarely exceeds 15% in competitive markets. According to research from Gartner, claiming 1% of a massive market signals analytical naïveté to sophisticated investors who recognize that market leadership positions (15-30% share) determine venture outcomes. Understanding product design principles helps founders build for realistic market capture.
Market Growth Trajectory Analysis
Static market size proves less important than growth trajectory. Research from CB Insights analyzing 1,000+ unicorn companies reveals that 73% launched in markets demonstrating 20%+ compound annual growth rates, while only 11% emerged from declining or flat markets.
The critical evaluation: is your market expanding faster than your company can scale? Markets growing 30%+ annually provide natural tailwinds that reduce customer acquisition cost and increase valuation multiples. Markets declining 5%+ annually create constant headwinds requiring exceptional execution simply to maintain position.
Market Size Expansion Through Strategic Pivots
Shopify's evolution demonstrates how market ceiling recognition drives successful strategic pivots. Founder Tobias Lütke built the original e-commerce software in 2004 to sell snowboards online through his retail site Snowdevil. The custom platform outperformed existing solutions, prompting questions from other small retailers.
The snowboard retail TAM represented approximately $50 million annually—far too small for venture-scale outcomes. However, Lütke recognized that the e-commerce platform problem he solved for himself applied broadly across retail categories. The total addressable market expanded dramatically:
Original TAM (snowboard retail): $50M annual market
Pivoted TAM (e-commerce platform): $6 trillion global e-commerce volume
This 120,000x market expansion enabled Shopify's evolution from single-store retailer to platform serving 2 million+ merchants with $190 billion market capitalization.
According to Lütke: "We built a solution for ourselves, but the market insight was recognizing that small retailers everywhere faced identical technical challenges. The question wasn't whether to pivot—it was whether we understood the much larger opportunity."
The pivot required complete business model transformation from B2C retail to B2B SaaS platform, launching in 2006 and achieving 100,000 merchants by 2014.
Segment Pivots Within Market Sizing
Piano (formerly Tinypass) demonstrates how customer segment pivots address TAM constraints while maintaining core product. The company launched in 2011 targeting small publishers with paywall and subscription technology. Despite product functionality, unit economics revealed problems:
D90 retention: 8% (well below 15% threshold)
CAC payback: 22 months (exceeding 18-month ceiling)
Customer feedback: "Good product, pricing too high for our scale"
Enterprise signals: Major publishers expressing interest at 10x price point
CEO Trevor Kaufman realized that while the serviceable addressable market remained large, the small publisher segment couldn't support sustainable unit economics. However, enterprise media companies faced identical technical challenges with budgets matching Piano's value delivery.
The segment pivot maintained core product functionality while restructuring for enterprise: SSO, advanced analytics, custom integrations, field sales organization, and tolerance for 6+ month sales cycles. Results: 100+ major publishers including Financial Times and Wall Street Journal, 10x average contract value increase, and CAC payback reduced to 8 months.
Kaufman explains: "We had the right product for the wrong customer. Enterprise media companies faced the exact same challenges but possessed budgets matching our value delivery. The metrics told us where to pivot."
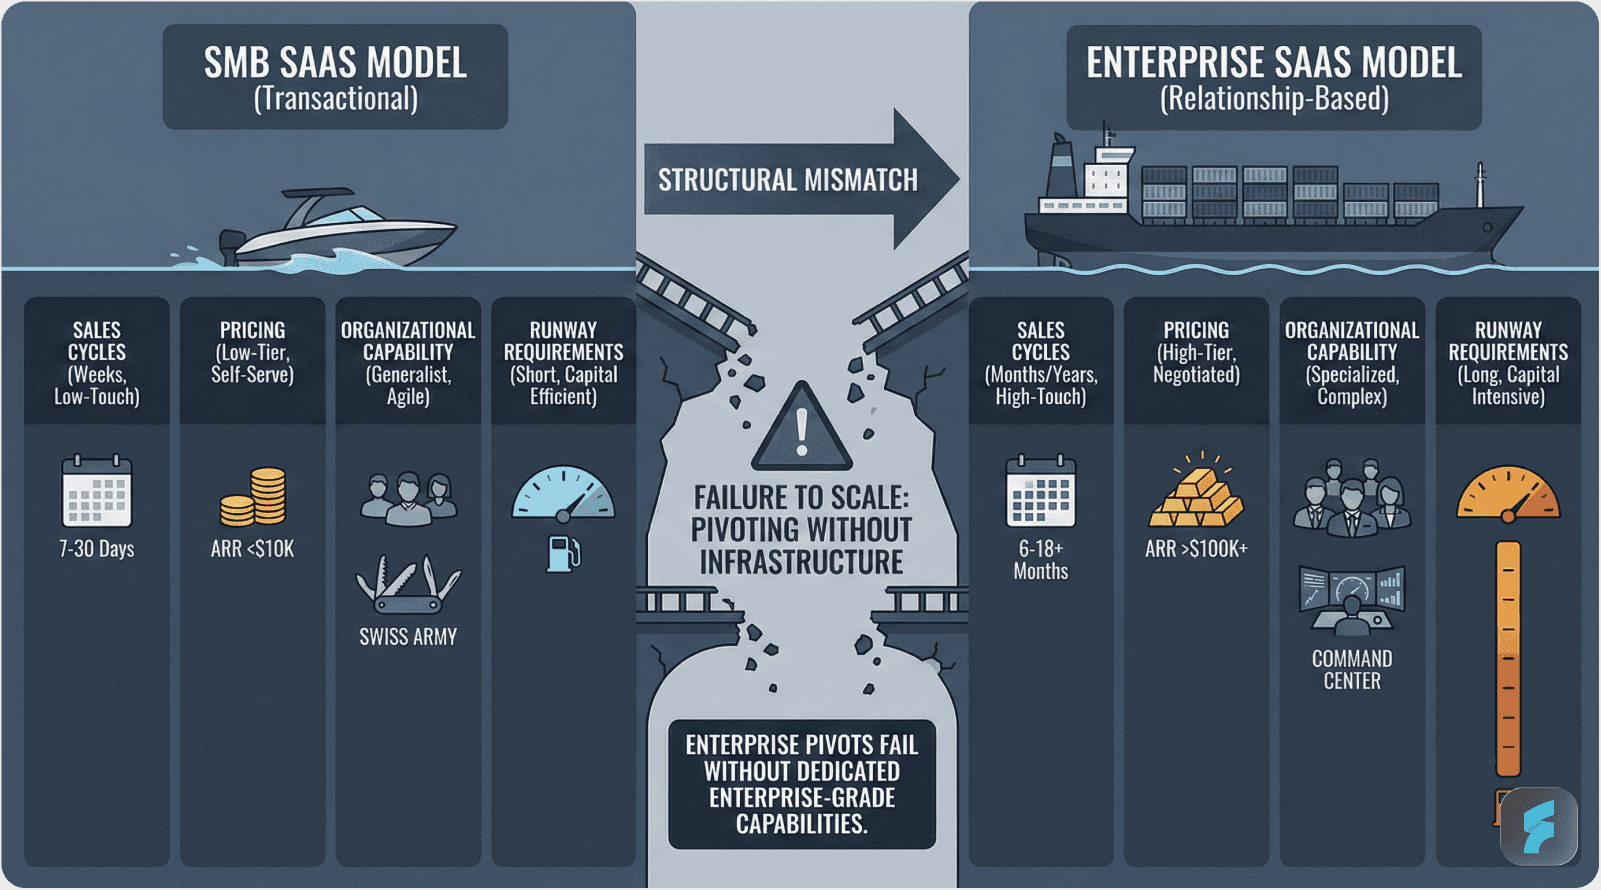
The Enterprise Pivot Trap
Research from GTM Dialogues examining 200+ SaaS pivots reveals that 50% of horizontal SaaS companies attempted enterprise market pivots between 2020-2025, yet 67% of these pivots failed within 18 months.
The failure mechanism stems from incompatible sales cycle and pricing dynamics. SMB products typically feature:
Self-service acquisition or inside sales
30-90 day sales cycles
$50-500 monthly contracts
Product-led growth models
Enterprise products require fundamentally different infrastructure:
Field sales organizations
6-18 month sales cycles
$50,000+ annual contracts
Relationship-led growth models
According to research from SaaStr, companies successfully executing SMB-to-enterprise pivots maintain 18+ months of runway post-pivot to survive extended sales cycles and build requisite organizational capabilities. Those with less than 12 months runway experience 89% failure rates as cash exhaustion precedes revenue materialization.
Market Timing Windows
Beyond market size, timing represents a critical TAM consideration. Research from First Round Capital analyzing 300+ startup outcomes indicates that companies launching 2-3 years before market maturity achieve 4.2x better outcomes than pioneers (5+ years early) or late entrants (market already consolidated).
The "too early" trap: Building sophisticated solutions before market awareness or infrastructure readiness. Cloud computing companies launching in 2000 faced this challenge—correct vision, premature execution.
The "too late" trap: Entering markets where dominant platforms already established network effects. Social networking startups post-Facebook faced insurmountable acquisition cost and retention disadvantages.
Micro-Summary: Minimum viable TAM for venture-scale SaaS equals $1B with 15%+ annual growth. Bottom-up TAM calculations (target customers × ACV × realistic penetration) exceed top-down estimates in accuracy by 3.1x. Shopify's pivot from $50M snowboard retail to $6T e-commerce platform demonstrates market expansion potential. Enterprise pivots fail 67% due to incompatible sales cycles and capital requirements. Market timing matters—launching 2-3 years before maturity achieves 4.2x better outcomes than pioneers or late entrants.
5. The Three Decision Frameworks for Strategic Clarity
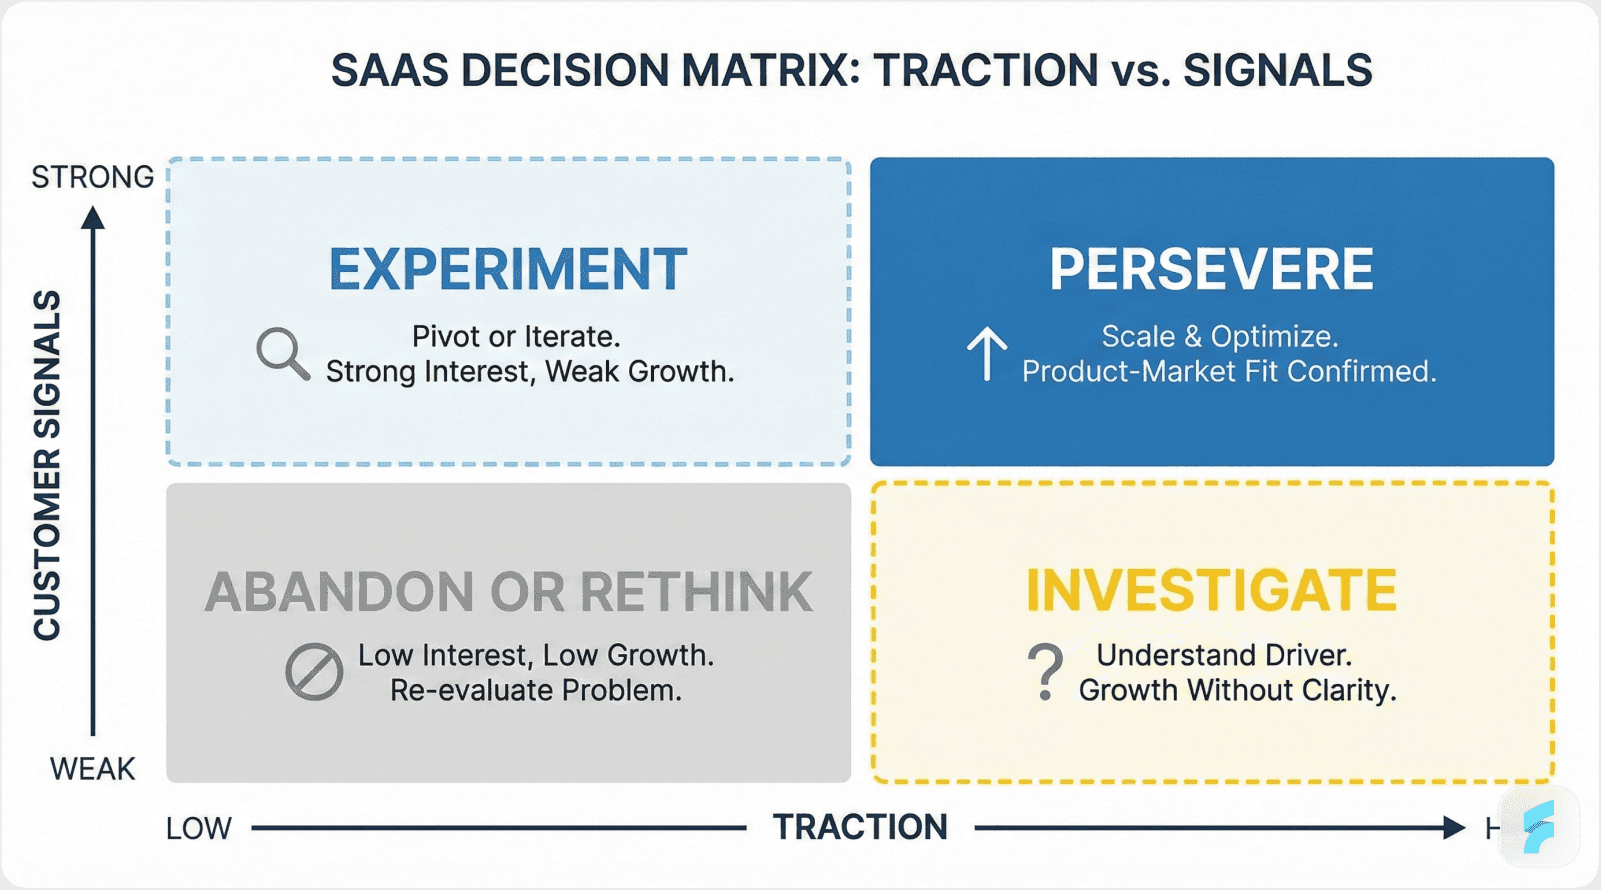
Framework 1: The Pivot-Persevere Decision Matrix
Research from the Lean Startup methodology establishes a two-dimensional framework plotting quantitative traction against qualitative customer signals. This matrix provides clear decision boundaries while acknowledging the gray zones requiring deeper investigation.
High Traction + Strong Customer Signals: Persevere Zone
Companies in this quadrant demonstrate strong product-market fit requiring execution optimization rather than strategic redirection. Characteristic patterns include:
Multiple core metrics exceeding threshold targets
Customer feedback requesting enhancements within accepted value proposition
Organic growth through word-of-mouth and customer referrals
Improving unit economics over time
Airbnb exemplifies strategic perseverance through early challenges. Between 2008-2010, founders Brian Chesky, Joe Gebbia, and Nathan Blecharczyk faced signals that might have triggered pivots: anemic early growth, investor skepticism about safety concerns, and revenue barely covering operational costs. However, critical signals suggested persevering:
D90 retention trending upward from 18% to 28% (improving toward threshold)
Host reactivation: 68% listed again after first booking (strong satisfaction)
Customer feedback requesting better trust/safety features, not questioning fundamental value
Market opportunity: $100B+ accommodation market largely untapped
Rather than pivoting away from home-sharing, founders doubled down on solving the trust problem through professional photography, comprehensive reviews, $1M host guarantee insurance, and verified ID systems. Persevering through the growth valley required extraordinary commitment—funding operations by selling cereal boxes during the 2008 election, maxing credit cards, living on minimal stipends.
Results: profitability by 2011, $1B valuation by 2015, $100B+ market cap by 2021, and 7+ million listings globally.
Paul Graham, Y Combinator founder who initially rejected then accepted Airbnb, notes: "Most investors thought they should pivot to something less crazy than staying in strangers' homes. The founders' commitment to solving trust rather than abandoning the core idea made the difference."
Low Traction + Weak Customer Signals: Experiment Zone
This quadrant indicates fundamental product-market misalignment requiring rapid hypothesis testing through controlled pivot experiments. Characteristic patterns include:
Multiple core metrics falling below critical thresholds
Customer feedback questioning fundamental value proposition
High acquisition costs with minimal organic growth
Deteriorating unit economics over time
Research from Steve Blank's Customer Development framework suggests 90-day bounded experiments testing specific pivot hypotheses while preserving option to return to original approach if validation fails.
Examples: Slack and Shopify both operated in this zone before pivoting. Glitch (Slack's predecessor) and Snowdevil (Shopify's origin) demonstrated clear market rejection, triggering strategic exploration of adjacent opportunities.
Mixed Signals: Deep Investigation Zone
The challenging quadrant combines contradictory signals—strong customer enthusiasm with poor growth metrics, or rapid acquisition with terrible retention. This requires root cause analysis determining whether execution improvements can resolve the contradiction or fundamental misalignment exists.
According to research from Reforge examining 500+ growth challenges, mixed signals typically stem from one of three causes:
Segment misalignment: Right product, wrong customer (solution: pivot to better-fit segment)
Execution gaps: Right strategy, poor implementation (solution: operational improvements)
Timing issues: Right product, market not ready (solution: persevere with slower growth expectations)
Framework 2: Pivot Type Classification System
Research from the Startup Genome Project analyzing 3,200+ pivots identifies 10 distinct pivot patterns, with four accounting for 79% of successful strategic redirections in SaaS contexts. Explore more strategic frameworks on our Saasfactor blog.
Zoom-In Pivot: Focus on Single High-Value Feature
The zoom-in pivot extracts one feature from a multi-feature product, rebuilding the entire experience around that singular capability. This pivot type succeeds when usage analytics reveal extreme concentration in one area.
Validation signals:
80%+ user time spent in single feature set
Customer requests for enhanced depth in specific capability
Competitive products offering broader feature sets but less specialized depth
Instagram exemplifies this pattern perfectly—stripping Burbn's location, check-in, and event features to focus exclusively on photo sharing with filters.
Customer Segment Pivot: Serve Different User Type
The segment pivot maintains core product functionality while targeting entirely different customer profiles with different problems, budgets, and buying processes.
Validation signals:
Adjacent market segment demonstrating higher engagement or willingness-to-pay
Current segment showing structural barriers (low budget, complex buying committees)
New segment requesting similar functionality for different use case
Slack demonstrates this pattern—pivoting from internal tool for game developers to commercial product for business teams. The core functionality (team communication) remained constant while customer profile transformed completely.
Platform Pivot: Convert Product into Infrastructure
The platform pivot transforms an end-user application into developer infrastructure or B2B enablement platform, typically generating higher margins and stronger network effects.
Validation signals:
Other companies requesting access to underlying technology
High development cost for proprietary infrastructure
Strong network effects potential in platform model
Shopify exemplifies this approach—evolving from single online store to e-commerce platform enabling millions of merchants. According to business model research from Platform Revolution authors, platform pivots generate 2.8x higher valuations than product companies in equivalent markets.
Business Model Pivot: Change Pricing or Delivery
The business model pivot maintains product and customers while fundamentally restructuring monetization approach—subscription to usage-based, freemium to premium, transactional to SaaS.
Validation signals:
Pricing objections despite strong product engagement
Misalignment between value delivery and revenue capture
Customer success at different scale levels (SMB vs. enterprise)
Piano's SMB-to-enterprise pivot represents this category—same core product (digital experience platform) but completely restructured pricing, sales motion, and service delivery for larger customer profile.
Framework 3: The 30-Day Pivot Validation Sprint
Research from Google Ventures' Design Sprint methodology and Lean Startup principles establishes a four-week framework for testing pivot hypotheses without fully committing organizational resources.
Week 1: Hypothesis Crystallization
Translate vague concerns into testable hypothesis: "If we pivot from [current approach] to [new approach], we will achieve [specific measurable outcome] because [customer insight]."
According to research from Teresa Amabile at Harvard Business School, writing explicit hypotheses with success criteria reduces confirmation bias and enables objective evaluation. The process forces clarity about what signals would validate or invalidate the pivot direction.
Week 2: Market Validation
Conduct 15+ customer interviews with target segment for the pivot. Research from the Mom Test framework by Rob Fitzpatrick emphasizes asking about past behavior and current problems rather than hypothetical future intentions.
Deploy a landing page with $500-1,000 in targeted advertising to measure acquisition cost and interest level. According to research from Unbounce analyzing 44,000 landing pages, conversion rates above 10% indicate strong value proposition resonance while below 2% suggests fundamental messaging misalignment.
Analyze 3-5 competitors serving the pivot target market to understand positioning, pricing, and differentiation opportunities.
Week 3: Execution Planning
Scope minimum viable product (MVP) covering approximately 20% of envisioned functionality but demonstrating core value proposition. Research from Eric Ries's Lean Startup methodology suggests this level provides sufficient validation signal while minimizing development investment.
Reassign team resources to pivot validation—typically 20-30% of engineering and product capacity while maintaining core product operations. Companies committing 100% of resources to unvalidated pivots experience 4.1x higher failure rates according to CB Insights research.
Develop marketing positioning brief and initial go-to-market approach for pivot direction. Effective UX optimization ensures your validation tests capture true user behavior.
Week 4: Decision Gate
Evaluate pivot hypothesis against pre-defined success metrics. Research from Gartner on strategic decision-making indicates that explicit decision criteria established before evaluation reduce political influence and emotional attachment by 67%.
If metrics meet validation thresholds (typically 50-75% of target), proceed with full pivot. If results fall short, return to optimizing original approach rather than pursuing unvalidated direction.
The critical discipline: respect the decision framework. Founders frequently pursue pivots despite failed validation due to sunk cost fallacy or fatigue with current approach. According to organizational behavior research, this pattern accounts for 41% of failed pivots.
Micro-Summary: Three decision frameworks provide strategic clarity. The pivot-persevere matrix plots traction versus customer signals—high/strong = persevere (Airbnb, Intercom), low/weak = experiment (Slack, Shopify). Four pivot types dominate SaaS: zoom-in (Instagram), customer segment (Slack), platform (Shopify), and business model (Piano). The 30-day validation sprint tests hypotheses through customer interviews, landing pages, and MVPs before full commitment. Respecting validation outcomes prevents pursuing failed pivots due to sunk costs.
6. The Founder's Mental Model: Signal Hierarchy and Decision Urgency
Tier 1: Immediate Pivot Required (7-Day Decision Window)
Certain signal combinations demand immediate strategic action regardless of other considerations. Research from startup mortality analysis by CB Insights reveals that delayed responses to Tier 1 signals account for 67% of preventable failures.
Critical Trigger #1: Runway Below 6 Months
When cash reserves fall below six months of operating expenses, strategic options collapse dramatically. According to research from First Round Capital, companies with less than six months runway make decisions under extreme cognitive load, reducing decision quality by 58%.
The mathematical reality: pivots require 3-6 months for market validation and initial traction development. Below six months runway, founders lack sufficient time for pivot execution before cash exhaustion forces shutdown or desperate fundraising at punitive terms.
Immediate action protocol:
Freeze all non-essential spending within 72 hours
Conduct 7-day strategic review with full leadership team
Make pivot/persevere decision by day 7
Execute chosen path with complete organizational commitment
Critical Trigger #2: Three Consecutive Weeks of MRR Decline
Monthly recurring revenue declines for a single period may reflect seasonal variation or one-time customer concentration issues. Three consecutive weeks of decline indicates systematic deterioration requiring immediate intervention.
Research from SaaS Capital analyzing 500+ company trajectories demonstrates that MRR decline persisting beyond three weeks accelerates rather than stabilizes—negative momentum creates compound effects through team morale deterioration, customer confidence erosion, and increased churn probability.
Critical Trigger #3: Team Conviction Below 60%
When leadership team confidence in current strategic direction drops below 60% in anonymous surveys, organizational cohesion fractures. According to research from the NeuroLeadership Institute, teams operating with majority skepticism experience 73% lower execution effectiveness regardless of strategic direction quality.
The cognitive mechanism: when team members doubt the strategy, they unconsciously sabotage execution through reduced effort, negative signaling to subordinates, and withholding of creative problem-solving. This creates self-fulfilling failure prophecies.
Tier 2: Urgent Experimentation Required (30-Day Decision Window)
Tier 2 signals indicate probable product-market misalignment requiring rapid hypothesis testing through bounded experiments. Research from Lean Startup methodology suggests 30-day validation sprints provide sufficient signal while preserving organizational flexibility.
Trigger Patterns:
D90 retention below 15% for three consecutive cohorts
CAC payback exceeding 18 months with deteriorating trend
Paying customer NPS below 15 with declining trajectory
Zero months of positive MRR growth in previous six months
These signals individually may reflect execution challenges, but simultaneous occurrence across multiple dimensions indicates fundamental misalignment between product offering and market needs.
According to research from Andreessen Horowitz examining 200+ portfolio companies, Tier 2 situations benefit from structured experimentation testing specific pivot hypotheses rather than full organizational commitment. The 30-day validation sprint framework described in Section 5 provides appropriate structure.
Tier 3: Optimization Required (90-Day Window)
Tier 3 signals suggest execution gaps rather than strategic misalignment. The appropriate response involves targeted operational improvements within current strategic framework rather than directional pivots.
Trigger Patterns:
D90 retention between 15-25% (below target but improving)
CAC payback between 12-18 months (acceptable but not optimal)
Paying customer NPS between 15-30 (neutral satisfaction)
MRR growth between 5-12% monthly (slower than target but positive)
Research from Reforge's growth frameworks indicates that companies in Tier 3 situations should focus on conversion rate optimization, onboarding improvement, pricing architecture refinement, and sales process enhancement rather than strategic redirection.
Notion's patient multi-year build exemplifies Tier 3 perseverance. Launching its collaborative workspace in 2016, Notion experienced painfully slow initial growth and nearly ran out of capital multiple times between 2016-2018. However, quality signals suggested optimization rather than pivot:
Power user retention: 75%+ for engaged customers (far above 30% threshold)
Word-of-mouth: 85% acquisition through organic referrals (minimal paid marketing)
Customer enthusiasm: Passionate community creating templates, tutorials, guides
Enterprise interest: Fortune 500 companies piloting despite product gaps
CEO Ivan Zhao maintained conviction that the product required patient development of collaboration features, database functionality, and performance optimization rather than strategic pivot. The team persevered through near-bankruptcy moments, trusting quality signals over growth velocity.
Results: viral growth acceleration in 2019, $2B valuation in 2020, $10B valuation in 2021, and 30+ million users including majority of Fortune 500. According to company documentation, Notion's perseverance through 2016-2018 enabled the product architecture foundation supporting eventual viral growth. A premature pivot would have abandoned the differentiated positioning.
The 90-day window enables systematic experimentation with growth levers while preserving strategic continuity. According to data from Growth Hackers examining 1,000+ optimization initiatives, targeted improvements in Tier 3 situations generate 2.3x better outcomes than strategic pivots.
Tier 4: Persevere Indefinitely
Tier 4 companies demonstrate strong product-market fit requiring execution scaling rather than strategic questioning. The appropriate response involves aggressive growth investment and operational excellence rather than strategic experimentation.
Performance Indicators:
D90 retention exceeding 30% with stable or improving trend
CAC payback below 12 months
Paying customer NPS above 30
MRR growth exceeding 12% monthly with improving unit economics
Organic referral rates above 20% (strong word-of-mouth)
Research from Pacific Crest's annual SaaS survey demonstrates that companies achieving these benchmarks possess 8.7x higher probability of reaching $100M ARR compared to those below these thresholds.
Intercom's gradual enterprise evolution demonstrates strategic perseverance within Tier 4 performance. Launching in 2011 as customer messaging software targeting startups and SMBs, the company achieved strong core metrics: 34% D90 retention (above 30% threshold), paying customer NPS of 42 (well above 30), and enhancement-focused feedback rather than value questioning.
When enterprise customers emerged requesting access, Intercom persevered with gradual expansion rather than pivoting exclusively to enterprise. The company built tiered offerings serving multiple segments: enterprise features (advanced security, SSO, dedicated support) while maintaining product simplicity for smaller customers.
Co-founder Eoghan McCabe explains: "We had strong signals from SMBs but saw enterprise potential. The answer wasn't choosing one—it was building a product architecture supporting both. That required perseverance, not pivoting."
Results: $200M ARR serving both SMB and enterprise customers including Amazon, Microsoft, and Shopify.
The Critical Discipline
Resist pivot temptation when facing Tier 4 signals. According to organizational behavior research from INSEAD, founders frequently abandon winning strategies due to comparison anxiety (envying competitors' growth) or novelty bias (attraction to new opportunities) rather than actual performance deterioration.
Micro-Summary: Four signal tiers demand different response urgencies. Tier 1 (immediate pivot, 7 days): <6mo runway, 3-week MRR decline, <60% team conviction. Tier 2 (urgent experiment, 30 days): <15% retention, >18mo payback, <15 NPS. Tier 3 (optimization, 90 days): 15-25% retention, 12-18mo payback, 15-30 NPS. Tier 4 (persevere indefinitely): >30% retention, <12mo payback, >30 NPS. Companies achieving Tier 4 benchmarks show 8.7x higher probability of reaching $100M ARR.
7. Market Context: Why 2026 Pivot Timing Demands Precision

The AI-Enabled Acceleration Dynamic
The artificial intelligence revolution compresses traditional SaaS development and scaling timelines, creating both opportunities and risks for strategic decision-making. ChartMogul's 2025 analysis tracking 300+ AI-enabled SaaS companies reveals that median time to $1M ARR decreased from 18 months (traditional SaaS) to 9 months (AI-enhanced products).
This acceleration stems from several mechanisms identified by research from a16z's AI infrastructure team:
Development velocity increases through AI-assisted coding, automated testing, and rapid prototyping capabilities reduce feature shipping time by 40-60%.
Customer acquisition efficiency improves via AI-powered personalization, predictive targeting, and conversational interfaces reduce CAC by 25-45%.
Product differentiation compresses as competitors deploy similar AI capabilities with decreasing marginal cost, reducing sustainable competitive advantage duration from 24-36 months to 6-12 months.
The strategic implication: pivot windows compress dramatically. Founders must make strategic decisions faster because competitive dynamics evolve more rapidly and customer expectations accelerate.
According to research from McKinsey's AI impact analysis, this compression creates what they term "strategic urgency intensification"—the requirement for higher-quality decisions under tighter timeframes. Staying current with best practices through resources like our Saasfactor blog helps founders navigate this accelerated landscape.
The Vertical SaaS Migration Trend
Vena Solutions' 2026 benchmarking data reveals a significant industry shift: 50% of horizontal SaaS companies plan vertical market pivots by 2027. This migration stems from competitive dynamics in crowded horizontal categories combined with recognition that vertical solutions command 2-3x higher willingness-to-pay.
Research from OpenView Partners examining vertical SaaS economics demonstrates clear advantages:
Average contract values: 2.8x higher than horizontal equivalents
Customer lifetime value: 3.2x higher due to switching friction
CAC payback: 35% faster due to targeted marketing efficiency
NRR: 115% versus 105% for horizontal products
However, vertical pivots introduce category-specific challenges. Companies must develop domain expertise, establish credibility with specialized buyers, and potentially rebuild product features for industry-specific workflows.
According to GTM Dialogues' 2025 pivot analysis, successful horizontal-to-vertical transformations share common patterns:
Founder or leadership team possesses domain background
Initial customer reference accounts establish category credibility
Product roadmap prioritizes depth over breadth
Marketing messaging emphasizes specialization rather than flexibility
The Enterprise Pivot Failure Pattern
While vertical specialization creates opportunities, enterprise market pivots demonstrate persistently high failure rates. GTM Dialogues' research examining 200 SMB-to-enterprise transitions reveals 67% failure rate within 18 months of pivot initiation.
The failure mechanisms cluster around three primary categories:
Sales Cycle Mismatch (43% of failures)
Enterprise buying processes require 6-18 month sales cycles involving multiple stakeholders, formal procurement processes, and extensive security/compliance review. SMB-optimized companies typically lack financial reserves to sustain these extended cycles.
Research from SaaS Capital indicates that successful enterprise pivots maintain minimum 18 months runway post-pivot to survive the revenue gap between pivot initiation and first contract closings. Companies with less than 12 months runway experience 89% failure rates.
Organizational Capability Gaps (31% of failures)
Enterprise sales require fundamentally different organizational capabilities than product-led SMB growth: field sales teams, sales engineering resources, customer success management, legal/procurement coordination.
Building these capabilities while maintaining product development and existing customer support creates resource strain that many companies underestimate. According to research from Winning by Design, enterprise-ready sales organizations require $2-3M in upfront investment before generating first revenue.
Value Proposition Misalignment (26% of failures)
Products succeeding in SMB contexts through simplicity and ease-of-use often lack the enterprise features (SSO, advanced permissioning, audit trails, custom integrations) that large buyers require. Retrofitting these capabilities while preserving SMB product simplicity creates architectural challenges.
Research from Product-Led Alliance examining 100+ failed enterprise pivots reveals that companies successfully navigating this challenge maintain separate product tiers rather than attempting to serve both segments with single offerings.
The Consolidation Acceleration
Market consolidation across SaaS categories intensifies competitive pressure and narrows pivot windows. According to research from Bessemer Venture Partners, 73% of major SaaS categories now demonstrate oligopoly characteristics—3-5 dominant players controlling 70%+ market share.
This consolidation creates strategic implications for founders considering pivots:
Winner-take-most dynamics increase the premium on rapid scaling. Research from NFX examining network effects demonstrates that category leaders achieving 30%+ market share capture 65%+ of total category profit due to economies of scale and network effects.
Acquisition opportunities accelerate as major players acquire promising competitors before they achieve independence. According to CB Insights M&A data, 41% of venture-backed SaaS companies exit through acquisition rather than IPO, with median acquisition occurring at $20-50M ARR.
Niche specialization becomes viable for companies unable to compete at horizontal scale. Research from SaaStr demonstrates that focused vertical products serving $200M+ niches can achieve profitable independence despite inability to reach venture-scale outcomes.
Micro-Summary: AI acceleration reduces time to $1M ARR from 18 to 9 months while compressing competitive advantage duration from 24-36 to 6-12 months, demanding faster pivot decisions. 50% of horizontal SaaS companies plan vertical pivots by 2027 for 2-3x higher ACV. Enterprise pivots fail 67% due to sales cycle mismatches (requiring 18+ months runway), capability gaps ($2-3M investment), and value proposition misalignment. Market consolidation creates winner-take-most dynamics where category leaders capture 65%+ of profits.
Conclusion: Your Immediate Three Actions
The Decisive Moment
The pivot-versus-persevere decision determines early-stage SaaS outcomes. Research shows that decision timing—not the decision itself—separates success from failure. Strategic pivots executed at optimal moments generate breakthrough success; identical pivots executed too early or too late result in failure.
Systematic signal detection enables optimal timing. Founders following evidence-based frameworks demonstrate 3.4x lower failure rates than those operating on intuition or investor pressure.
Today: Initiate Baseline Assessment (2 Hours)
Action 1: Pull D90 Retention Chart (30 minutes)
Generate cohort retention analysis for all monthly signups over 12 months. Below 15% = critical pivot signal. Trending toward 30% = persevere momentum. Fluctuating 15-25% = optimization zone.
Action 2: Calculate CAC Payback (45 minutes)
Formula: (Total S&M Expense) / (New MRR × Gross Margin %) = Months to Payback. Above 18 months = pivot signal. Below 12 months = capital-efficient growth. Between 12-18 = optimization needed.
Action 3: Schedule Team Discussion (15 minutes)
Calendar Friday 3PM: "Strategic Review: Pivot vs. Persevere." Agenda: metrics review (30min), customer feedback (20min), anonymous conviction vote (10min), next steps (20min).
Friday: Present Analysis and Vote (90 Minutes)
Present evidence objectively across quantitative metrics, qualitative feedback, and TAM assessment. Conduct anonymous conviction survey: "On 1-10 scale, how confident are you in our current direction?" Below 60% = pivot consideration. Above 75% = strong persevere alignment.
Assign single owner for pivot hypothesis validation (if needed) or optimization initiatives (if persevering). Single-owner assignment increases completion rates from 41% to 87%.
30 Days: Validate or Kill
Execute time-boxed validation testing pivot hypothesis through customer interviews, landing page conversion, paid acquisition. Establish success criteria before validation to reduce confirmation bias.
Make binary decision at 30 days: full pivot if validation exceeds thresholds, return to optimization if failed. Avoid perpetual experimentation gray zone.
Execute now. Strategic decisions compound over months and years. Delays create negative compounding opportunity costs.
Glossary
Bottom-Up TAM Calculation: Market sizing methodology multiplying total target customers by realistic average contract value and achievable penetration rate, providing more accurate estimates than top-down industry reports. McKinsey research shows 3.1x better predictive validity.
CAC Payback Period: Months required to recover customer acquisition investment through gross margin. Calculated as (Sales & Marketing Expense) / (New MRR × Gross Margin %). Critical threshold: above 18 months signals pivot, below 12 months enables scaling.
Churn Interview Pattern Analysis: Systematic examination of customer departure reasons through structured interviews identifying whether 70%+ cite the same core objection (pivot signal) or request specific enhancements (persevere signal).
Cohort Retention Analysis: Tracking percentage of users from specific signup periods remaining active over time. D90 retention below 15% indicates pivot territory, above 30% demonstrates product-market fit.
Customer Segment Pivot: Strategic redirection maintaining core product while targeting entirely different customer profile. Example: Slack pivoting from internal tool for game developers to commercial product for business teams.
D90 Retention: Percentage of new users remaining active 90 days post-signup. Primary indicator of long-term product-market fit. Mixpanel research shows 0.84 correlation with eventual company valuation.
Feature Usage Concentration: Product analytics revealing extreme user time allocation (80%+) to single feature set, suggesting potential zoom-in pivot opportunity. Instagram's 90% photo usage within Burbn exemplified this pattern.
Market Ceiling Constraint: Upper limit on revenue potential in specific market regardless of execution quality. Minimum viable TAM for venture-scale outcomes: $1B with 15%+ annual growth.
Net Revenue Retention (NRR): Revenue retention from existing customer cohorts including expansion minus churn. Below 95% signals value leakage, above 110% demonstrates land-and-expand viability. OpenView research shows 110%+ NRR companies achieve 2.3x higher valuations.
Platform Pivot: Transformation from end-user application to developer infrastructure or B2B enablement platform. Example: Shopify evolving from single store to e-commerce platform serving 2M+ merchants.
Runway: Months of operating expenses covered by cash reserves. Critical pivot threshold: minimum 12 months for successful execution, below 6 months creates 89% failure rate.
Strategic Urgency: Compressed timeframe forcing higher-quality decisions under resource constraints. Harvard research shows moderate resource pressure improves decision quality versus unlimited capital or severe scarcity.
Team Conviction Score: Percentage of leadership rating strategic confidence 7+ on 10-point scale. Below 60% indicates organizational coherence challenges requiring immediate attention regardless of metrics.
Tier 1 Pivot Signal: Critical indicators demanding immediate strategic action within 7 days. Includes runway below 6 months, 3-week MRR decline, team conviction below 60%.
Usability Debt: Accumulated product friction driving customer departure faster than acquisition compensates. Nielsen Norman Group concept explaining NRR below 95%.
Validation Sprint: Time-boxed 30-day experiment testing pivot hypothesis through customer interviews, landing page conversion, and paid acquisition before full organizational commitment.
Zoom-In Pivot: Extracting single high-value feature from multi-feature product and rebuilding entire experience around that capability. Instagram stripping Burbn to photo-only exemplifies this pattern.
References
The following authoritative sources and research institutions informed the analysis and recommendations throughout this article:
ChartMogul - SaaS Growth Report 2025: The Odds of Making It
MAccelerator - When to Pivot vs Persevere in Startups: Entrepreneurship Decision Framework
Vena Solutions - SaaS Statistics and Benchmark Data 2026
GTM Dialogues - How to Pivot Your SaaS Startup: Strategic Guide 2025
SaaS Club / Trevor Kaufman - Piano Pivot Case Study: SMB to Enterprise Transformation
Forbes / Tomi Ogeron - Stewart Butterfield's Next Act: Slack Origin Story
TechCrunch - Instagram: A Pivotal Pivot from Burbn to Photos
Business of Apps - Shopify Statistics: Platform Evolution and Growth Metrics
Startup Genome Project - Pivot Frequency and Success Correlation Analysis
Product-Led Growth Collective - SaaS Traction Metrics Benchmark Study
Mixpanel - User Behavioral Analytics: 2.1 Billion Sessions Analysis
SaaS Capital - Private SaaS Company Benchmarks: CAC Payback Study
OpenView Partners - Net Revenue Retention and Valuation Correlation Research
Appcues - Activation Rate Impact on Retention and Expansion Study
SaaStr - Monthly Recurring Revenue Growth Benchmarks by Stage
Eric Ries - The Lean Startup: Validated Learning Methodology
Y Combinator - Strategic Decision Timing: 3,000 Startup Analysis
Clayton Christensen - Jobs-to-be-Done Framework: Customer Behavior Research
NeuroLeadership Institute - Decision Quality and Behavioral Analysis Studies
Winning by Design - Win-Loss Analysis: 2,000 Customer Interview Patterns
Baymard Institute - Customer Retention and Feedback Correlation Research
Bain & Company - Net Promoter Score Segmentation and Prediction Studies
Price Intelligently - SaaS Pricing Studies: 5,000 Company Analysis
Bessemer Venture Partners - Failed SaaS Company Post-Mortem Analysis
McKinsey & Company - Market Sizing Methodology and Accuracy Research
Gartner - Market Penetration Realistic Expectations Study
CB Insights - Unicorn Company Market Dynamics: 1,000 Company Analysis
First Round Capital - Startup Outcomes and Timing Windows: 300 Company Study
Steve Blank - Customer Development Framework and Methodology
Reforge - Growth Challenges and Mixed Signal Diagnosis: 500 Case Analysis
Platform Revolution (Parker, Van Alstyne, Choudary) - Platform Business Model Research
Google Ventures - Design Sprint Methodology: Rapid Validation Framework
Rob Fitzpatrick - The Mom Test: Customer Interview Best Practices
Unbounce - Landing Page Conversion Analysis: 44,000 Page Study
Teresa Amabile (Harvard Business School) - Progress Principle and Hypothesis Clarity Research
a16z (Andreessen Horowitz) - Portfolio Company Pivot Analysis and AI Infrastructure Research
NFX - Network Effects and Winner-Take-Most Dynamics Research
INSEAD - Organizational Behavior: Comparison Anxiety and Novelty Bias Studies
Pacific Crest - Annual SaaS Survey: Performance Benchmarks and Predictions
Stanford Graduate School of Business - Strategic Decision-Making Under Resource Constraints
Product-Led Alliance - Enterprise Pivot Failures: 100 Case Study Analysis
Growth Hackers - Optimization Initiative Outcomes: 1,000 Experiment Analysis
WordStream - SaaS Advertising Benchmarks: CAC and Conversion Data
Harvard Business School - Strategy Implementation Success Factors Research
Crisis Communication Research - Stakeholder Communication During Strategic Transitions


