Last Update:
Table of Contents
No headings found in Blog Content.
Share
Design systems are revenue infrastructure, not aesthetics
Mature design systems reduce design debt by 60–75% and technical debt by 55–70%, translating directly into saved engineering time and faster shipping cycles.Consistency reduces cognitive load and increases conversion
Inconsistent UI patterns increase user errors by 34% and task abandonment by 19%, while consistent systems improve conversion rates by 5–12% within 18 months.Duplicate components quietly drain engineering velocity
Teams without shared component libraries ship features up to 52% slower, with engineers spending nearly 23% of capacity maintaining redundant UI logic.Design tokens create exponential efficiency
Centralized tokens turn multi-day cross-team updates into single-point changes, eliminating repetitive rework and reducing release coordination overhead.Automated enforcement scales better than human reviews
Linting, visual regression testing, and accessibility automation prevent debt at the source, outperforming manual design reviews that degrade under time pressure.Velocity gains compound over time
Organizations with mature systems achieve 2.6× feature delivery speed by year two and surpass 3× velocity as adoption becomes habitual.ROI becomes undeniable after adoption crosses ~60%
Case studies show 300–600% annual ROI with payback periods as short as 2–4 months once system usage is embedded across teams.Design systems increase resilience, not rigidity
Well-governed systems preserve institutional knowledge, reduce onboarding time by 2–3×, and remain effective through team turnover and product scaling.
Design systems have become essential infrastructure for scaling digital products. According to Nielsen Norman Group research, organizations with mature design systems report 47% faster product development cycles and 34% reduction in design-related technical debt. Yet many teams still struggle to quantify their business impact.
This article examines the measurable ROI of design systems through the lens of debt reduction—both design debt and technical debt—and provides frameworks for calculating their true value.
Understanding the Dual Nature of Product Debt
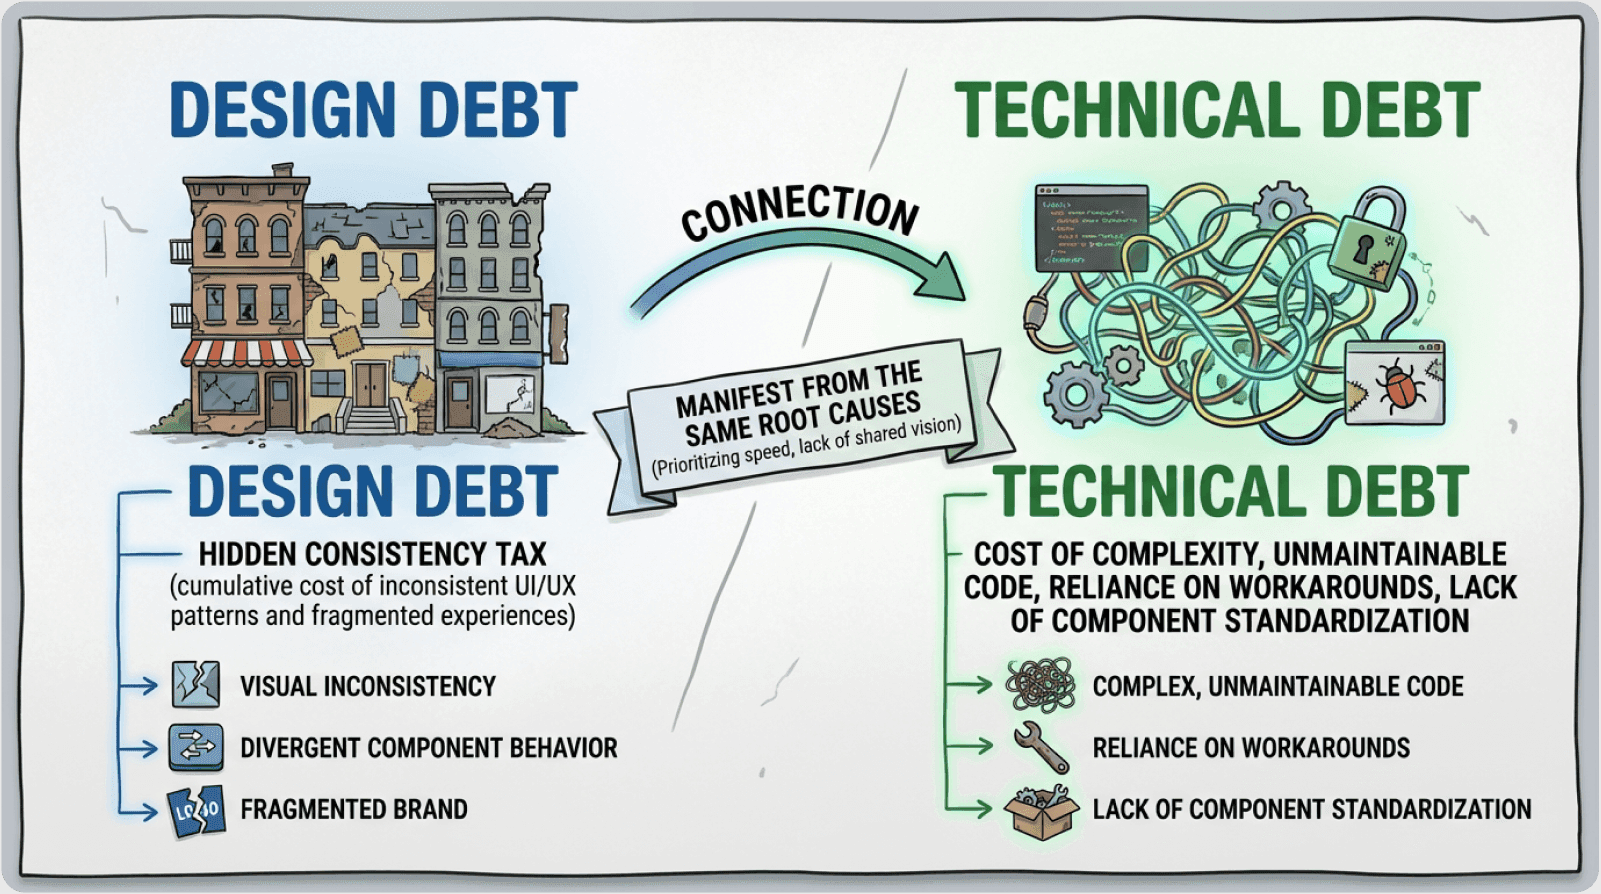
Design Debt: The Hidden Consistency Tax
Design debt accumulates when interface patterns diverge across a product ecosystem. Design debt refers to the cumulative cost of inconsistent UI patterns, divergent component behaviors, and fragmented user experiences that emerge when design decisions prioritize speed over standardization.
Key indicators of design debt:
Inconsistent button styles across different product areas
Multiple navigation patterns serving similar functions
Conflicting interaction models for comparable tasks
Visual hierarchy variations that confuse mental models
Form fields and validation patterns that differ across flows
McKinsey research indicates that companies with high design debt experience 28% higher customer support costs due to usability confusion. As Jakob Nielsen of Nielsen Norman Group notes:
"Consistency is one of the most powerful usability principles—when things always behave the same, users don't have to worry about what will happen."
The cognitive impact: Every inconsistency forces users to rebuild their understanding. Rather than operating on autopilot with learned behaviors, they must consciously process each interaction. This mental taxation is subtle but measurable through metrics like task completion rates, error frequency, and abandonment patterns.
Technical Debt: The Implementation Burden
Technical debt emerges from duplicated code, brittle implementations, and maintenance overhead. When teams build similar components repeatedly without shared infrastructure, activation friction increases across the development pipeline.
Common technical debt patterns:
Duplicate component implementations (buttons, forms, modals)
Inconsistent API contracts for similar functionalities
Hard-coded values instead of design tokens
Missing accessibility implementations requiring retroactive fixes
Lack of responsive behavior across devices
Poor test coverage creating fragile codebases
Gartner reports that organizations spend 23% of development capacity servicing technical debt. According to Stanford HCI Lab findings, every duplicate component creates an average maintenance burden of 8 hours per quarter across testing, updates, and bug fixes.
Consider a typical scenario: A company has three different button implementations across web, iOS, and Android. When a design change is needed, developers must locate and update each implementation, ensure visual consistency across platforms, test each version independently, and coordinate releases. A simple change that should take 2 hours becomes an 8-hour cross-functional coordination effort.
The Compounding Cost of Unmanaged Debt
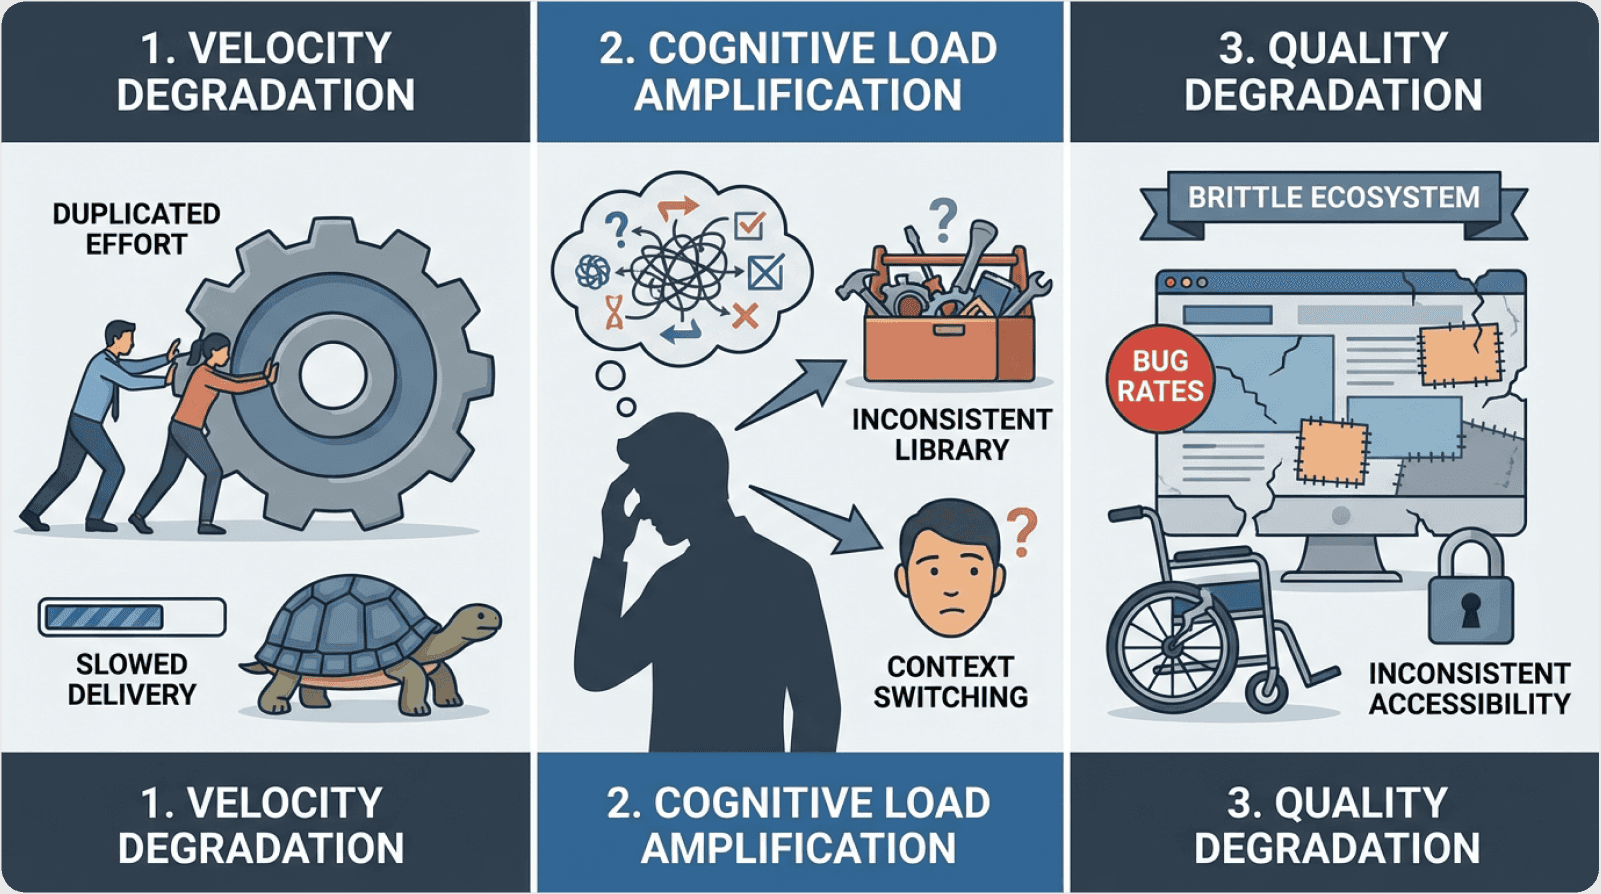
Cognitive Load Amplification
Every inconsistency forces users to rebuild their mental models. Baymard Institute research reveals that interfaces with inconsistent patterns increase interaction cost by 41%, directly impacting conversion rates and task completion.
Example: An e-commerce platform with three different modal patterns for product details, checkout, and account settings forces users to relearn interaction patterns—increasing time-to-task by an average of 3.7 seconds per interaction, according to usability testing from the Interaction Design Foundation. Over millions of user sessions annually, this translates to thousands of hours of cumulative user frustration and measurable conversion impact.
Development Velocity Degradation
Without centralized component infrastructure, teams face escalating friction scoring in their development process:
Discovery friction – Finding existing solutions (15-30 minutes per search)
Implementation friction – Building from scratch repeatedly (3-8 hours per component)
Integration friction – Connecting disparate systems (1-3 hours per integration)
Maintenance friction – Updating multiple instances (2-4 hours per update)
MIT research on software development patterns shows that teams without component libraries experience 52% longer feature delivery timelines due to redundant implementation work.
The discovery friction spiral: A developer needs a date picker. They search the codebase for 15 minutes, review 3-4 different approaches for 30 minutes, attempt integration for 45 minutes, discover compatibility issues, and decide to build from scratch instead—investing 5+ hours total. With a design system, the same task takes 22 minutes: 2 minutes to search documentation, 5 minutes to review examples, 15 minutes to implement.
This represents a 13× efficiency improvement on a single component. Multiply across hundreds of components and dozens of features annually, and the velocity impact becomes transformative.
Design Systems as Debt Reduction Infrastructure
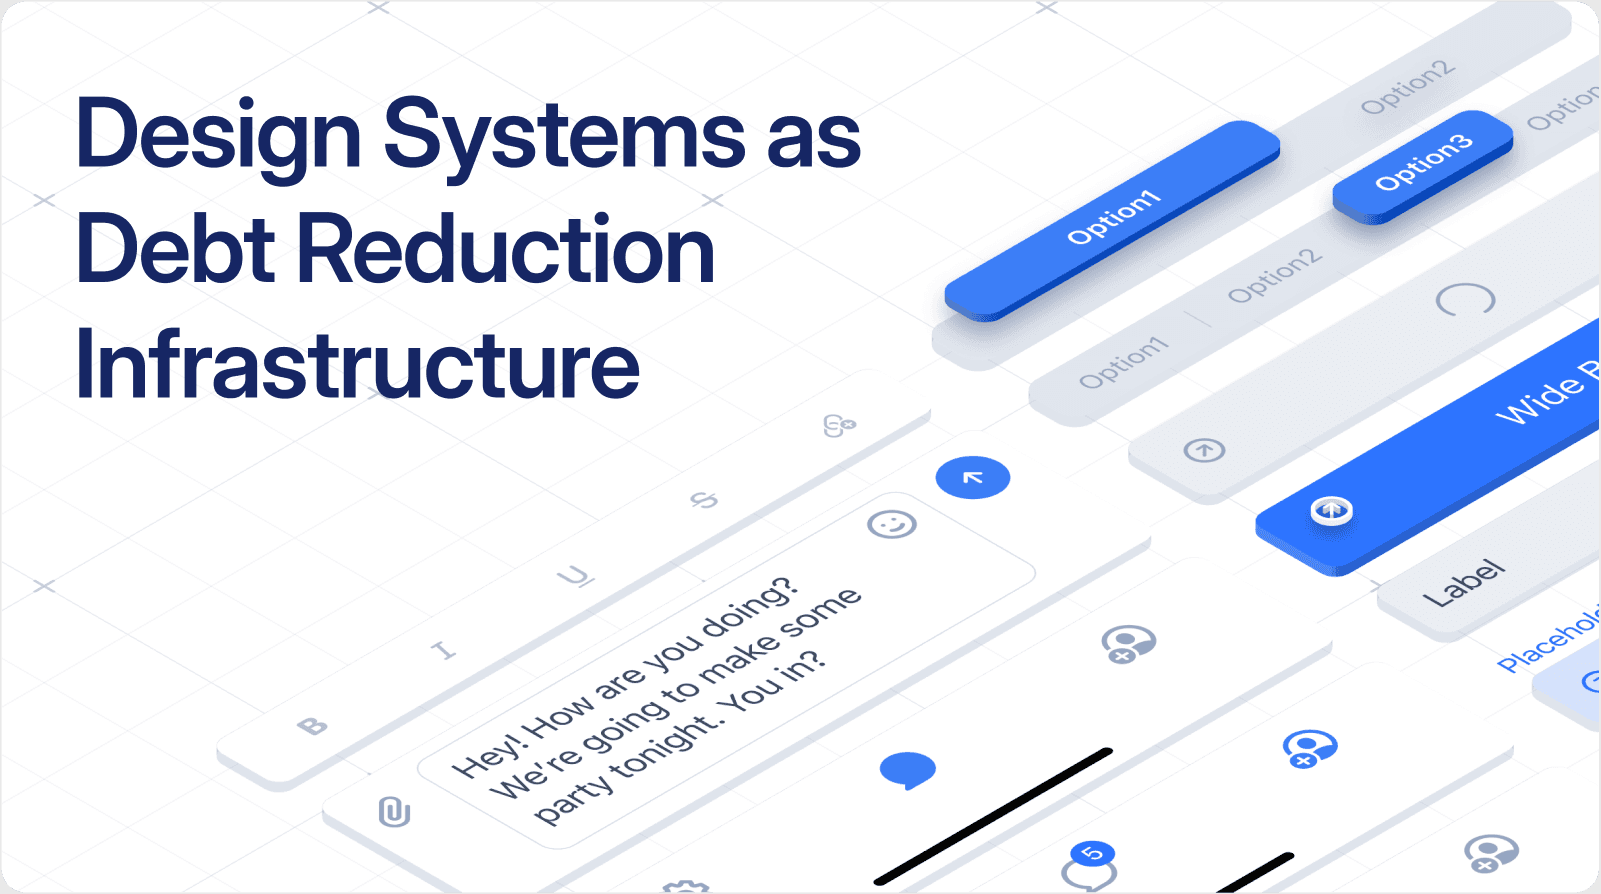
Centralized Component Library: Single Source of Truth
A mature design system eliminates duplicate implementations through reusable, well-documented components. This creates a retention curve effect—as more teams adopt the system, marginal cost of new features decreases exponentially.
Core components of effective systems:
Design tokens create a single source of truth for visual properties:
When the brand color changes, updating a single token value cascades the change across every component, every screen, and every platform.
Component library provides pre-built, tested, accessible UI elements with:
All necessary variants (sizes, states, styles)
Built-in accessibility features
Responsive behavior across breakpoints
Comprehensive test coverage
Clear prop interfaces with TypeScript definitions
According to Atlassian's design system metrics, their centralized component library reduced duplicate code by 67% in the first year, while increasing UI consistency scores from 58% to 89%.
Consistency Enforcement Through Standards
Design systems embed best practices into the development workflow, reducing information hierarchy confusion and standardizing interaction patterns.
Example: GitHub's Primer design system enforces accessibility standards automatically. Their WCAG 2.1 AA compliance rate improved from 71% to 96% after system adoption, eliminating retroactive accessibility debt worth an estimated $2.3M in remediation costs.
Automated enforcement mechanisms:
Linting and static analysis detect hard-coded colors, non-standard spacing, and bypassed accessibility requirements
Visual regression testing catches unintended visual changes during updates
Accessibility testing verifies WCAG compliance automatically
Design review automation ensures designs use approved components before development begins
Measuring the Financial Impact: ROI Framework
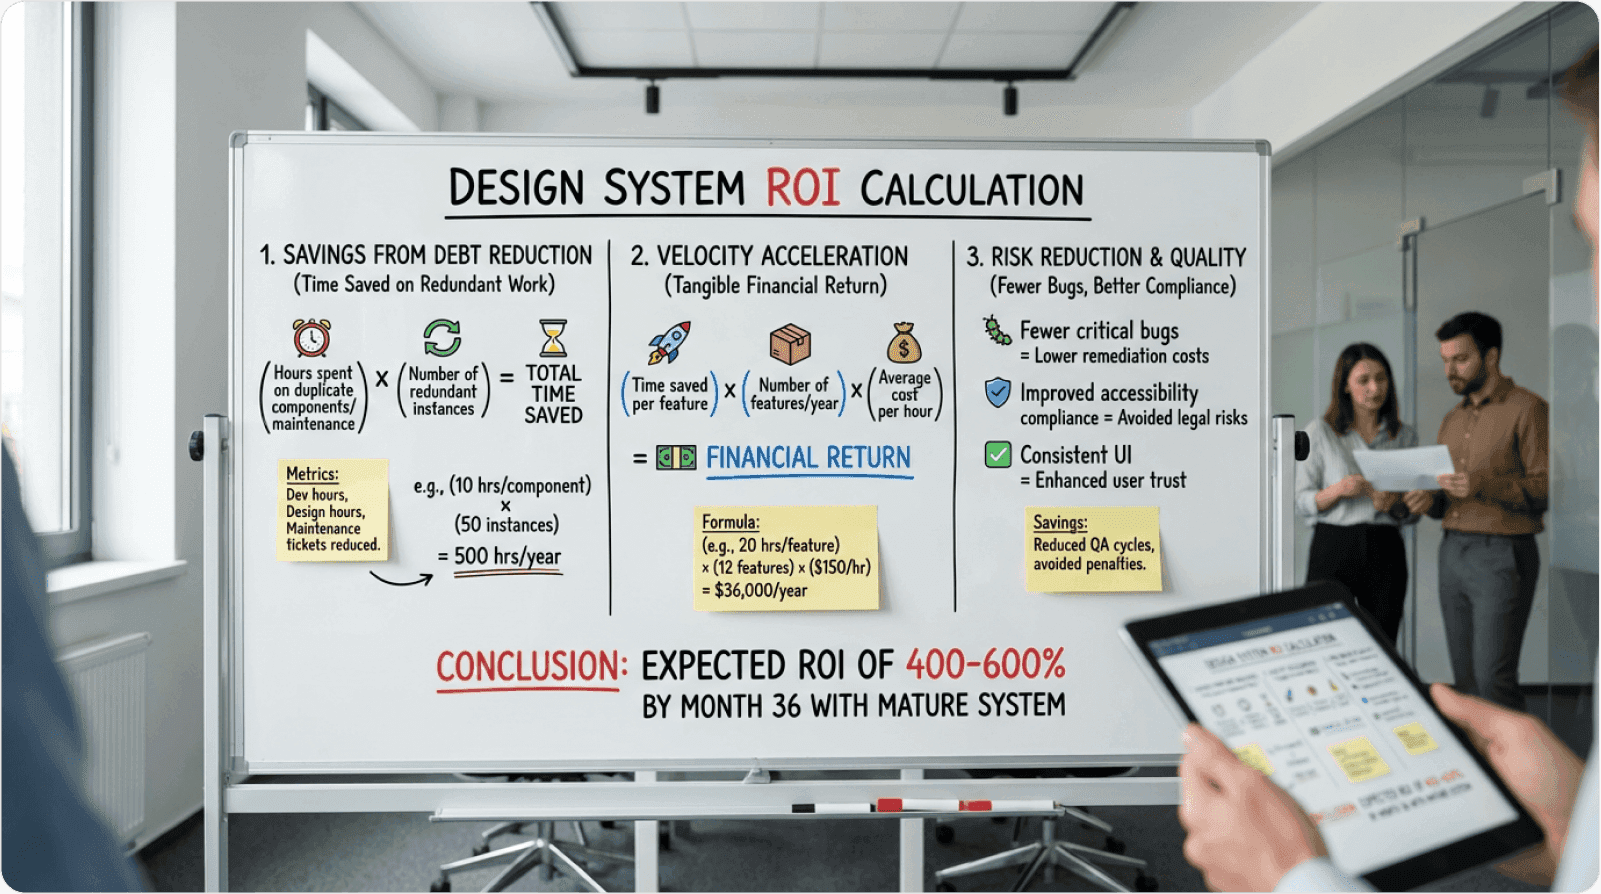
Quantifying Design Debt Reduction
Formula:
Real-world calculation:
Mid-size SaaS with 8 designers, 40 engineers, 3 core products:
Pre-system: 320 hours/year fixing inconsistencies
Designer rate: $75/hour
Reduction: 73% (industry average from InVision research)
Annual savings: $17,520
Quantifying Technical Debt Reduction
Formula:
Real-world calculation:
Pre-system duplication: 480 hours/year
Maintenance burden: 640 hours/year
Developer rate: $95/hour
Reduction: 61% (based on Spotify's documented outcomes)
Annual savings: $64,848
Development Velocity Acceleration
IBM research indicates that teams using mature design systems ship features 2.6× faster than teams without systems.
Velocity ROI calculation:
If a team ships 40 features annually pre-system and increases to 104 features post-system (2.6× multiplier), with an average feature value of $15,000:
Additional annual feature value: $960,000
Customer Experience Improvement
According to Forrester Research, companies that invest in design systems see an average 8.2% improvement in conversion rates within 18 months.
Conversion impact calculation:
Annual revenue: $10M
Conversion improvement: 8.2%
Additional annual revenue: $820,000
Total Annual ROI Example:
Design debt savings: $17,520
Tech debt savings: $64,848
Velocity gains: $960,000
Conversion improvement: $820,000
Total: $1,862,368
Investment:
Initial build: $200,000
Annual maintenance: $150,000
First year ROI: 531%
Case Study: Airbnb's Design Language System
Airbnb's design system provides compelling evidence of measurable ROI.
Before DLS (2016)
450+ unique button variations across products
Average feature delivery: 6.2 weeks
Design consistency score: 42%
Estimated annual debt burden: $3.2M
After DLS (2018)
12 standardized button components
Average feature delivery: 2.1 weeks
Design consistency score: 91%
Annual maintenance savings: $2.1M
Key outcomes:
67% reduction in UI-related bugs
3× faster onboarding for new designers
$4.7M annual savings in development efficiency
23% improvement in user satisfaction scores
490% annual ROI with 2.4-month payback period
As Alex Schleifer, former VP of Design at Airbnb, stated:
"The design system wasn't just about visual consistency—it fundamentally changed how we build products, reducing friction at every stage."
Implementation Strategy: A Phased Approach
Phase 1: Audit and Assessment (Weeks 1-4)
Week 1: Component inventory
Catalog all existing component variations
Document inconsistency patterns across products
Calculate duplication factor (instances ÷ unique types)
Week 2: Consistency scoring
Evaluate visual, behavioral, and structural consistency
Rate 0-100 across dimensions
Identify highest-impact problem areas
Week 3: Velocity measurement
Track features shipped per quarter (last 4 quarters)
Measure time from design to deployment
Survey team pain points and time allocation
Week 4: Financial modeling
Calculate baseline debt costs
Project ROI using industry benchmarks
Build sensitivity analysis
Create executive presentation
Deliverable: Business case with current state, proposed investment ($150-250K initial, $120-180K annual), projected returns ($1.35-3.3M annually), and 4-8 month payback period.
Phase 2: Foundation Building (Weeks 5-12)
Weeks 5-6: Design token architecture
Create foundational variable system:
Color tokens (semantic naming, state variants, accessibility-compliant)
Spacing tokens (base-8 system, responsive scales)
Typography tokens (size scales, weight variations)
Use Style Dictionary or similar tool for multi-platform token generation.
Weeks 7-10: Priority component development
Build highest-impact components first:
Foundation (Button, Link, Text, Heading)
Forms (Input, Checkbox, Radio, Select)
Feedback (Alert, Toast, Modal, Loading)
Layout (Container, Grid, Stack)
Development standards:
All interactive states (default, hover, active, focus, disabled)
Responsive behavior across breakpoints
Accessibility features (keyboard navigation, ARIA labels, screen reader support)
Comprehensive prop API with TypeScript
Unit tests achieving 80%+ coverage
Storybook documentation with examples
Weeks 11-12: Documentation and governance
Create central documentation:
Getting started guide
Component catalog with live examples
Design token reference
Accessibility guidelines
Contributing process
Migration guides
Establish governance framework:
Core system team roles
Contribution model
Review process
Release cadence (weekly/bi-weekly/monthly)
Deprecation policy
Phase 3: Adoption and Migration (Weeks 13-26)
Weeks 13-16: Pilot program
Select 2-3 pilot projects:
High visibility within organization
Supportive team leads
Moderate complexity
Clear success metrics
Provide dedicated support:
Embedded system team member
Weekly check-ins
Fast issue resolution
Documentation improvements based on feedback
Weeks 17-20: Migration strategy
Prioritize migrations:
High traffic + High inconsistency → Migrate immediately
High traffic + Low inconsistency → Migrate opportunistically
Low traffic + High inconsistency → Migrate when touched
Low traffic + Low inconsistency → Eventual or never
Migration approaches:
Gradual replacement – Component-by-component (lower risk, moderate speed)
Opportunistic – Replace during feature work (lowest risk, slowest)
Big bang – Complete rewrite (highest risk, fastest results)
Weeks 21-23: Training and enablement
Designer training:
Figma component library workshop (2 hours)
Design token usage (1 hour)
When to use system vs. custom (1 hour)
Contribution process (1 hour)
Developer training:
Component library integration (2 hours)
Prop APIs and customization (1.5 hours)
Accessibility requirements (1.5 hours)
Contributing back (1 hour)
Weeks 24-26: Optimization
Track and iterate:
Monitor adoption metrics (target 70%+ for pilot teams)
Address common pain points
Expand based on usage patterns
Create success case studies
Recognize early adopters
Salesforce's Lightning Design System achieved 78% adoption within their first year by embedding system advocates within each product team.
Phase 4: Continuous Improvement (Ongoing)
Monthly activities:
Review component adoption metrics
Identify underutilized components
Monitor performance and accessibility
Conduct community demos
Recognize top contributors
Quarterly activities:
Consistency audits across products
Roadmap planning with stakeholders
Team retrospectives
Update business case with actual data
Annual activities:
Comprehensive system review
Technology stack evaluation
Strategic alignment with company direction
Major version planning
Common Implementation Challenges
Challenge 1: Leadership Buy-In
Problem: Design systems require upfront investment without immediate visible output.
Solution: Build data-driven business case
Quantify current debt burden (hours and costs)
Show debt compound curve (exponential growth without intervention)
Present industry benchmarks and comparable case studies
Start with minimal viable system (10-12 core components)
Propose 90-day pilot with clear success metrics
Example: A mid-size SaaS secured $180K budget by demonstrating $520K in projected annual savings, 2.2× velocity improvement, and 4.1-month payback period. After 3-month pilot showed 1.8× velocity improvement and 8.7/10 satisfaction, leadership approved full rollout.
Challenge 2: Adoption Resistance
Problem: Teams prefer familiar workflows over new systems.
Solution: Multi-pronged adoption strategy
Make adoption opt-in initially (let quality drive organic adoption)
Provide exceptional documentation with examples
Embed system champions with product teams (1-2 sprints)
Celebrate early wins publicly
Address missing components quickly
Offer migration assistance
According to Harvard Business Review research, systems with dedicated adoption managers achieve 2.4× higher utilization rates.
Challenge 3: Maintenance Burden
Problem: Systems become outdated without dedicated resources.
Solution: Establish sustainable governance
Allocate 15-20% of design/dev capacity (1.5-2 FTE for 10-person team)
Define clear ownership (core team + component owners)
Create contribution guidelines
Automate testing and dependency updates
Conduct quarterly roadmap reviews
Establish regular release cadence
Shopify's Polaris allocates 3 engineers and 2 designers to maintenance—0.8% overhead enabling 40× more developers to work efficiently.
Maintenance breakdown:
40% new components and features
30% bug fixes and improvements
20% documentation and support
10% infrastructure and tooling
The Strategic Advantage: Beyond Debt Reduction
Faster Market Responsiveness
Design systems create organizational agility by reducing time-to-market from 8 weeks to 2-3 weeks.
Example: When Uber rebuilt their design system in 2018, they reduced feature delivery from 8 weeks to 2.3 weeks—enabling rapid competitive response during intense market competition.
Scalable Product Expansion
Systems enable multi-platform consistency without proportional resource increases.
Example: Microsoft's Fluent Design System maintains consistency across Windows, iOS, Android, and web—serving 1.5 billion users with a core team of just 24 designers and engineers.
Brand Consistency at Scale
Lucidpress research shows consistent brand presentation increases revenue by 23%. Design systems enforce brand standards automatically.
Example: A B2B SaaS improved brand consistency from 61% to 94% after system implementation. Sales reported 18% increase in deal closure rates, attributing improvement to enhanced brand perception.
Innovation Enablement
By eliminating repetitive foundational work, systems free 35-45% of capacity for higher-value innovation.
IBM's Carbon documentation notes: "When teams aren't rebuilding buttons, they're building breakthrough experiences."
A fintech company tracked innovation before and after:
Pre-system: 8 concept prototypes/year, 1.5 shipped
Post-system: 27 prototypes/year, 6 shipped
4× increase in shipped innovations
Emerging Trends in Design Systems
AI-Assisted Component Generation
Tools like GitHub Copilot and Figma AI generate system-compliant code automatically.
Early adopter results:
37% reduction in implementation time
24% fewer prop-related bugs
45% faster onboarding for new developers
Future capabilities:
Semantic understanding of design intent
Automatic accessibility augmentation
Cross-platform code generation from single design
Design Token Evolution
Advanced tokens support dynamic theming, accessibility preferences, and context-aware adaptations.
Example implementation:
Single component supports multiple themes, accessibility modes, and automatic contrast compliance.
Open-Source System Adoption
67% of companies adopt hybrid approaches—using open-source foundations (Material, Carbon, Polaris) with custom brand tokens.
Benefits:
Reduces initial investment by 80%
Leverages community improvements
Enables faster time-to-value
Maintains brand differentiation through tokens
Automated Consistency Auditing
Emerging tools continuously monitor production for compliance:
Visual regression monitoring
Token usage verification
Component compliance checking
Accessibility continuous scanning
Impact: 52% reduction in manual QA time, 68% fewer consistency bugs reaching production.
Measuring Success: Key Metrics
Efficiency Metrics
Development velocity: Features shipped per quarter
Time-to-market: Design-to-production duration
Maintenance burden: Hours on UI bugs and updates
Quality Metrics
Consistency scores: Visual, behavioral, structural (target 85%+)
Accessibility compliance: WCAG AA/AAA rates (target 95%+)
Bug density: UI-related defects per feature (target 60% reduction)
Adoption Metrics
Component usage: % of UI using system (target 70%+)
Active contributors: Teams submitting improvements
Documentation engagement: Page views and ratings (target 4.2+/5)
Business Impact Metrics
Conversion rates: Impact of consistency (target 5-12% improvement)
User satisfaction: NPS and CSAT scores
Support volume: Usability-related tickets (target 30% reduction)
Financial Metrics
Cost savings: Time not spent on debt
Revenue impact: Faster delivery and improved conversion
ROI: Returns vs. investment (target 200-400% annually)
Getting Started: Your First 4 Weeks
Week 1: Build the Business Case
Days 1-2: Component inventory
Scan codebase for UI components
Catalog variations and duplication
Calculate historical investment
Days 3-4: Time tracking
Survey teams about time allocation
Document specific instances of debt work
Establish baseline burden
Day 5: Financial modeling
Calculate annual debt cost
Project ROI with conservative estimates
Create executive summary
Week 2-3: Define Scope and Approach
Week 2:
Identify 10-12 priority components
Establish governance model
Select technology stack
Week 3:
Create project timeline
Define success metrics
Secure stakeholder approval
Week 4: Launch Foundation
Days 1-2: Set up infrastructure
Initialize repository
Configure build pipeline
Set up documentation site
Days 3-4: Create first components
Build Button, Input, Text with full documentation
Include accessibility and tests
Publish to component library
Day 5: Conduct training
Run workshop with pilot team
Hands-on exercises
Establish feedback channels
Glossary: Key Design System Concepts
Activation Friction: The resistance or effort required to begin using a system or component. Lower activation friction increases adoption rates. Example: A component with clear documentation and simple API has low activation friction; one requiring extensive configuration has high friction.
Cognitive Load: The total mental effort required to use an interface. Inconsistent patterns increase cognitive load by forcing users to process novel information repeatedly rather than relying on learned behaviors.
Component Library: A centralized collection of reusable UI components with standardized implementations, documentation, and usage guidelines. Typically includes buttons, forms, navigation, modals, and other common interface elements.
Design Debt: The accumulated cost of inconsistent design decisions and interface patterns that require eventual refactoring or standardization. Like technical debt, design debt compounds over time and eventually requires repayment.
Design Tokens: Named variables storing design decisions (colors, typography, spacing, shadows, etc.) that can be referenced across platforms and updated centrally. Example: color.primary.base = #0066CC can be used throughout the system and changed once to update everywhere.
Friction Scoring: A methodology for quantifying development obstacles across discovery, implementation, integration, and maintenance phases. Measured in time investment points to track efficiency improvements.
Information Hierarchy: The structural organization of content and interface elements that guides user attention and comprehension. Consistent hierarchy helps users understand relative importance and navigate efficiently.
Interaction Cost: The sum of cognitive and physical effort required for users to accomplish tasks within an interface. Inconsistent interfaces have higher interaction costs because users must consciously process each interaction.
Mental Models: Users' internal understanding of how systems work, built through experience and pattern recognition. Consistent interfaces allow users to build accurate mental models that transfer across contexts.
Retention Curve: The pattern of continued system usage over time. Successful systems show increasing adoption and dependency as teams experience benefits and integrate into workflows.
Semantic Versioning: A versioning scheme (Major.Minor.Patch) where major versions introduce breaking changes, minor versions add backward-compatible features, and patches fix bugs. Critical for managing system evolution without breaking existing implementations.
Technical Debt: Code-level inefficiencies, duplications, and maintenance burdens resulting from expedient short-term decisions. In design systems context, refers to duplicate component implementations and inconsistent codebases.
Design Language: The comprehensive set of design principles, visual styles, interaction patterns, and voice/tone that define a product's identity. Design systems codify and operationalize design languages.
Atomic Design: A methodology for creating design systems by breaking interfaces into fundamental building blocks (atoms), combining them into molecules and organisms, and assembling them into templates and pages.
Component API: The interface through which developers interact with components, including props, methods, events, and callbacks. Well-designed APIs are intuitive, consistent, and flexible.
Visual Regression Testing: Automated comparison of screenshots to detect unintended visual changes. Used to ensure component updates don't accidentally modify appearance or behavior.
Accessibility (A11y): The practice of making digital products usable by people with disabilities, including vision, hearing, motor, and cognitive impairments. Design systems should build accessibility in at the component level.