Last Update:
Mar 5, 2026

Table of Contents
No headings found in Blog Content.
Share
UX Benchmarking Consultants replace subjective design opinions with measurable usability data and performance baselines.
They establish clear UX KPIs tied to revenue metrics such as activation rate, conversion rate, retention, and churn.
UX Benchmarking Consultants combine quantitative metrics like SUS scores and task completion rates with qualitative research to explain user behavior.
Competitive benchmarking helps businesses understand where they stand against category leaders, not just against past performance.
A structured UX benchmarking process includes discovery, KPI definition, usability testing, data analysis, optimization planning, and re-benchmarking.
Unlike a UX audit, UX Benchmarking Consultants measure improvement over time using repeatable testing protocols.
For SaaS companies, benchmarking directly improves onboarding, time-to-value, and trial-to-paid conversion.
The most effective consultants triangulate data from analytics tools, session recordings, user interviews, support tickets, and competitor testing.
Re-benchmarking with the same users and tasks proves statistically valid improvement rather than assumed success.
Investing in UX Benchmarking Consultants builds a long-term competitive advantage because experience quality compounds over time.The ROI of UX benchmarking is measurable: even a 1% improvement in a core KPI can outweigh the entire engagement cost.
Every product team has opinions about what is wrong with their user experience. The problem is that opinions without data lead to expensive redesigns that solve the wrong problems. UX benchmarking replaces those guesses with a measurable, repeatable baseline that tells you exactly where your product stands and how much it improves over time.
UX benchmarking is the practice of measuring your product's usability performance against defined standards, your own historical performance, or direct competitors. It answers the question every product leader eventually faces: "We think our UX is better, but how do we know?"
According to McKinsey, companies that prioritize design excellence achieve 32% higher revenue growth and 56% higher total shareholder returns compared to industry peers. Forrester research puts the UX ROI at $100 returned for every $1 invested.
UX benchmarking consultants design, run, and interpret these measurement frameworks. They establish performance baselines, define what "good" looks like for your specific product category, track improvement over time, and connect UX changes directly to business outcomes like conversion rate, churn, and customer lifetime value.
What Do UX Benchmarking Consultants Do?
They establish measurable baselines before any redesign begins.
They define KPIs tied to business outcomes, not vanity metrics.
They run structured user research to collect reliable performance data.
They produce prioritized, design-specific recommendations, not just problem lists.
They re-benchmark after improvements to validate that changes actually worked.
Establish UX Performance Baselines
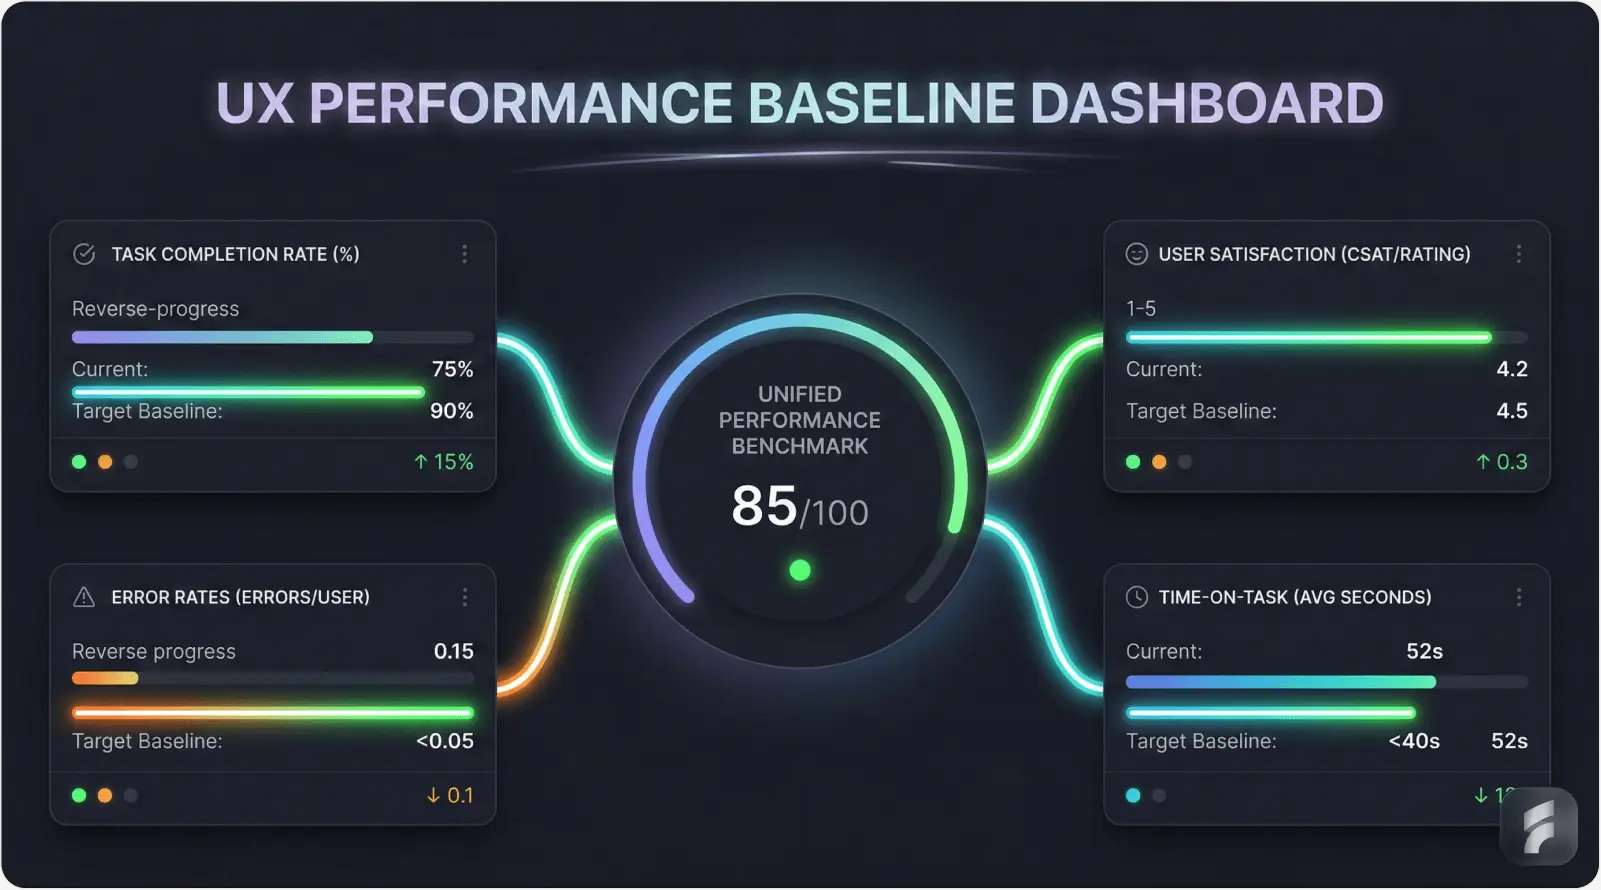
Before you can track improvement, you need a starting point. Consultants measure current-state performance across task completion rate, time-on-task, error frequency, and user satisfaction scores. This baseline becomes the benchmark everything else is measured against.
Define Measurable UX KPIs
Not all metrics are created equal. For a SaaS product, the KPIs that matter most are usually onboarding completion rate and time-to-first-value. For e-commerce, it might be cart abandonment and checkout completion. The skill is in selecting metrics that predict revenue, not just metrics that look impressive.
Conduct Usability Testing and Research
Consultants recruit representative users, design task scenarios that mirror real use cases, and run structured usability sessions. The best practitioners draw on multiple data sources simultaneously: analytics platforms, session recordings, user interviews, support ticket analysis, and competitive testing.
Competitive UX Analysis
Knowing you improved 15% over last quarter is useful. Knowing you are still 30% behind the category leader is essential. Consultants run structured comparisons against direct competitors and best-in-class products to reveal where you are losing users to alternatives.
Actionable Recommendations with UI Examples
The most important distinction between a good and average benchmarking consultant: recommendations that are specific, sequenced by impact, and tied to concrete design changes, not vague directives like "improve onboarding."
Continuous UX Performance Tracking
UX benchmarking is not a one-time engagement. Consultants establish measurement cadences, re-benchmark after major releases, and build dashboards that give product teams ongoing visibility into UX health.
Types of UX Benchmarking Services
Quantitative benchmarking answers "how much" and "how often" with statistical data.
Qualitative benchmarking explains "why" users behave the way they do.
Competitive benchmarking shows where you stand relative to direct alternatives.
Most rigorous engagements use all three in combination.
1. Quantitative UX Benchmarking
Quantitative benchmarking deals in numbers: usability metrics, conversion rate analysis by funnel step, heatmaps and session recordings, and A/B testing benchmarks. It produces data you can compare across time periods, product versions, and competitors with statistical reliability.
2. Qualitative UX Benchmarking
Numbers tell you what is happening; qualitative research tells you why. This includes user interviews, surveys and feedback analysis, heuristic evaluations against established usability principles, and accessibility assessments. The output is rich, contextual insight that makes quantitative data interpretable.
3. Competitive UX Benchmarking
Your users compare your product to every other tool they have used. Competitive benchmarking runs the same usability protocols on your product and your competitors' products simultaneously, producing a calibrated view of where you lead, where you lag, and what best-in-class actually looks like in your product category.
Key UX Metrics Consultants Measure
System Usability Scale (SUS): scores above 68 are average; above 80 is excellent; above 90 is best-in-class.
Task completion rate: industry leaders target 90% or higher for critical flows.
Time-on-task: a direct indicator of friction and cognitive load.
Error rate: higher errors predict higher support volume and eventual churn.
Customer Satisfaction Score (CSAT) and Net Promoter Score (NPS): combine experience quality with perceived value.
Bounce rate and user engagement depth: UX shapes whether users explore beyond the front door.
A skilled benchmarking consultant creates a composite scorecard showing how individual metric movements combine into overall UX health, then translates that health score into revenue implications. Reforge research shows that reducing time-to-value by 50% can improve activation rates by 25 to 40%, illustrating how tightly UX metrics connect to business outcomes.
Benefits of Hiring UX Benchmarking Consultants
Identifies usability gaps before they compound into churn.
Improves product-market fit by revealing the UX gap between feature availability and user access to value.
Increases conversion rates by pinpointing exactly which funnel steps leak users.
Reduces churn through data-led fixes before users reach the cancellation decision.
Improves customer satisfaction scores with design changes validated by real users.
Enables data-driven UX decisions that replace internal opinion with behavioral evidence.
Builds a compounding competitive advantage: experience quality takes years to replicate.
Support ticket volume routinely drops 40 to 60% following structured benchmarking and redesign engagements. Customer acquisition costs five to seven times more than retention, making proactive UX investment straightforward to justify financially.
UX Benchmarking Process
A rigorous engagement follows six structured phases from discovery through ongoing monitoring.
Each phase builds on the previous: goals determine KPIs, KPIs shape research, research produces data, data drives recommendations.
Re-benchmarking with the same users and same protocols is what proves improvement is real, not assumed.
Step 1: Discovery and Goal Setting
Consultants align on business objectives before any measurement tool is opened. What does better UX need to accomplish in terms of activation, retention, or conversion? This transforms a vague mandate into a precise measurement agenda tied to specific business outcomes.
Step 2: Define KPIs and Benchmark Standards
With goals established, consultants select metrics most directly connected to your business model and set baseline targets based on industry norms, historical data, and competitive intelligence.
Step 3: User Research and Testing
Representative users complete defined task scenarios under observation. Moderated and unmoderated sessions are combined with analytics review, session recording analysis, and support ticket mining to reveal multiple layers of friction.
Step 4: Data Analysis and Reporting
Raw data is transformed into a structured benchmark report: current performance versus targets, usability scores by flow and user segment, competitive positioning, and root cause analysis for underperforming areas.
Step 5: Optimization Roadmap
Findings are translated into a prioritized action plan ordered by impact and implementation effort, with specific design direction so development teams can act immediately without additional briefing.
Step 6: Ongoing Monitoring and Re-Benchmarking
After optimization changes are shipped, the same measurement protocols run again with the same user segments, creating a head-to-head comparison that shows exactly how much each metric improved. Improvement should be measured, not assumed.
UX Benchmarking vs. UX Audit: What is the Difference?
A UX audit identifies what problems exist; benchmarking measures how much they have improved.
Audits are typically expert-driven and point-in-time; benchmarking requires user data and repeats over time.
The most valuable engagements combine both: an audit-style discovery phase followed by quantitative benchmarking.
Dimension | UX Audit | UX Benchmarking
|
|---|---|---|
Primary question | What UX problems exist? | How does UX performance compare over time or against competitors? |
Output type | Issue list with severity ratings | Quantitative metrics, scorecards, trend data |
Time dimension | Point-in-time snapshot | Ongoing with historical comparison |
User involvement | Optional; expert judgment often sufficient | Required; user data is the core source of truth |
Typical duration | 1 to 2 weeks | 4 to 8 weeks initially; ongoing thereafter |
Industries That Need UX Benchmarking Consultants
B2B SaaS and AI SaaS companies where activation and retention are revenue-critical.
E-commerce businesses where checkout UX directly controls revenue per session.
FinTech platforms where poor User experience creates both churn and regulatory risk.
Healthcare apps where task accuracy has patient safety implications.
EdTech platforms where engagement and completion rates define product success.
Enterprise software where UX debt accumulates over years of feature additions.
SaaS is the highest-leverage category for UX benchmarking: measurable improvement in task completion rates translates directly into trial-to-paid conversion and month-one retention, both of which have compounding effects on annual recurring revenue.
Tools Used by UX Benchmarking Consultants

Analytics tools include Mixpanel, Amplitude, Google Analytics 4, and PostHog.
Heatmapping tools include Hotjar, Microsoft Clarity, and FullStory.
User testing platforms include Lookback, UserZoom, UserTesting.com, and Maze.
Survey tools include Typeform, Qualtrics, SurveyMonkey, and Sprig.
A/B testing tools include Optimizely, VWO, and LaunchDarkly.
The tool stack matters less than how it is used. The most reliable benchmarks triangulate across multiple sources: analytics to identify drop-off points, session recordings to observe behavior before drop-off, and user interviews to understand why. No single tool provides the full picture.
When to Hire a UX Benchmarking Consultant
Trial-to-paid conversion is declining and existing analytics do not explain why.
Month-one churn is high despite strong lead quality, suggesting users are not reaching activation.
A major redesign or rebrand is planned and a pre-redesign baseline is needed to validate ROI.
You are entering a new competitive market and need to understand your experience gap.
Support ticket volume is rising around specific flows.
Post-funding growth targets require step-change improvements in conversion or retention.
Enterprise expansion is stalling because new users within accounts struggle to onboard.
Early-stage startups building MVPs or preparing for their first paid acquisition push.
How to Choose the Right UX Benchmarking Consultant
Industry experience determines how quickly they calibrate what "good" looks like in your product category.
Case studies should show before-and-after metrics, not just redesign visuals.
Methodology should be explicit: sample sizes, data sources, and analytical framework all documented.
Data-driven means they defer to findings even when those findings challenge their initial hypothesis.
Reporting transparency includes access to raw data, not just interpreted summaries.
Tool stack expertise should include a rationale for which tools are used and why.
Experience in Your Industry
Ask for specific case studies within your product type. Industry experience accelerates benchmark calibration, the design of realistic task scenarios, and the interpretation of results against category-specific norms.
Proven Case Studies
Portfolio pieces that show beautiful redesigns are table stakes. You need case studies that show the before and after metrics: SUS scores, task completion rate changes, and conversion or retention movements.
Clear Methodology
Professional consultants can articulate exactly how they collect data, what constitutes a valid sample size for their protocols, how they control for confounding variables, and how raw metrics become prioritized recommendations.
Data-Driven Approach
Ask how they handle findings that contradict their initial assessment. The answer reveals whether they are running genuine benchmarking or reverse-engineering data to support pre-formed conclusions.
Reporting Transparency
You should receive raw data alongside interpreted summaries: session recordings, full survey responses, and unfiltered analytics. Good consultants welcome this scrutiny because it demonstrates the quality of their methodology.
Tool Stack Expertise
A sophisticated practitioner has a rationale for every tool choice: why moderated testing for certain questions, unmoderated for others, and which combinations produce the most reliable results for specific measurement problems.
Why Choose Saasfactor as Your UX Benchmarking Consultant?
Saasfactor specializes exclusively in SaaS UX, with deep experience across B2B, AI, FinTech, HR Tech, Healthcare, and Enterprise software.
Every engagement is grounded in a proprietary library of 1,700+ UX best practices across 108 interaction types.
Benchmarking uses the same users, same tasks, and same protocols before and after redesign to prove improvement.
Rated 4.9/5 on Clutch with documented case studies showing measurable business outcomes.
Fixed price. Fixed 60-day timeline. Measurable results, or you do not pay.
Saasfactor is a revenue-led Saas UX design agency that fixes onboarding, improves activation, and reduces churn within a fixed 60-day engagement. Every design decision is traceable to a real business outcome, which the agency calls Revenue-Led Design.
Six-Source Data Collection: Before a single pixel moves, Saasfactor collects evidence from a founder interview, SaaS product analytics (Mixpanel, Amplitude, GA), session recordings, supervised remote user interviews, support ticket and review analysis, and competitive analysis of two to five direct competitors. Each source reveals a different layer of where the product is losing users.
Built on 1,700+ Documented Best Practices: Design decisions are informed by a proprietary internal library of over 1,700 UX rules grounded in psychology principles, including the Saasfactor Usability Protocol covering 1,400+ interaction-level patterns. Benchmarks are evaluated against a rigorously documented standard, not vague intuition.
Benchmarked Against Your Previous Design: Saasfactor measures the impact of every redesign by testing new designs head-to-head against the original, using the same users and same task scenarios. Task completion time, drop-off rates, and ease-of-use metrics are delivered side by side in raw footage, affinity maps, and quantified benchmark reports. If improvement is not statistically significant, the team iterates and re-tests until the numbers prove it works.
Proven at Scale: Saasfactor holds a 4.9/5 rating on Clutch and has delivered work for clients including a TriNet redesign serving 300,000+ end users. The BizReply engagement, driven by mining negative support tickets as a primary design input, projected a 30%+ reduction in churn. Client Michael O'Donnell reported a measurable spike in engagement metrics in Google Analytics within weeks of launch.
"They went through all our negative support tickets and actually worked on the design UX based on that. That's a very different approach. With the new redesign, I feel churn and support tickets overall should go down by at least 30%." -- Zawwad U, Founder and CEO, BizReply
Saasfactor operates on a fixed price and fixed timeline. The team assigned to each project includes a dedicated UX Researcher, UX Designer, and UI Designer, all senior-level specialists. New designs are delivered every two days throughout the engagement. If measurable results are not achieved, you do not pay.
Final Discussion
Design opinions are cheap; benchmarked user performance data is valuable.
The ROI calculation is simple: determine what a one-point improvement in your key metric is worth, then compare it to the engagement cost.
The cost of not benchmarking is harder to see but equally real: redesigns that did not move the needle, churn that accumulated undetected, feature investments that solved the wrong problem. Raed more detalis about redesign cost.
The companies that build durable competitive advantages in experience quality are the ones that measure systematically, improve continuously, and hold their design decisions accountable to user performance data. That starts with benchmarking. UX advantage compounds over time in a way feature parity never does: competitors can copy a feature in months, but replicating years of accumulated behavioral research and design decisions takes far longer.
For most SaaS businesses, the math is straightforward. Identify the conversion or retention metric you are targeting. Determine what a one-percentage-point improvement in that metric is worth to your ARR. Compare it to the cost of a benchmarking engagement. In most cases, a single improvement cycle pays for itself many times over within the same quarter.