Last Update:
Dec 9, 2025

Share
Executives spend only 11.5 hours over their entire business lifetime on pricing strategy, costing companies 10-15% of potential revenue
SaaS companies using value metrics grow at 2x the rate of those that don't
Hybrid pricing models (subscription + usage) report the highest median growth rate at 21%, outperforming pure models
80% of SaaS companies discount by 25%+ to acquire customers, but these customers churn at 3-5x higher rates
Companies reviewing pricing quarterly grow 23% faster than those reviewing annually
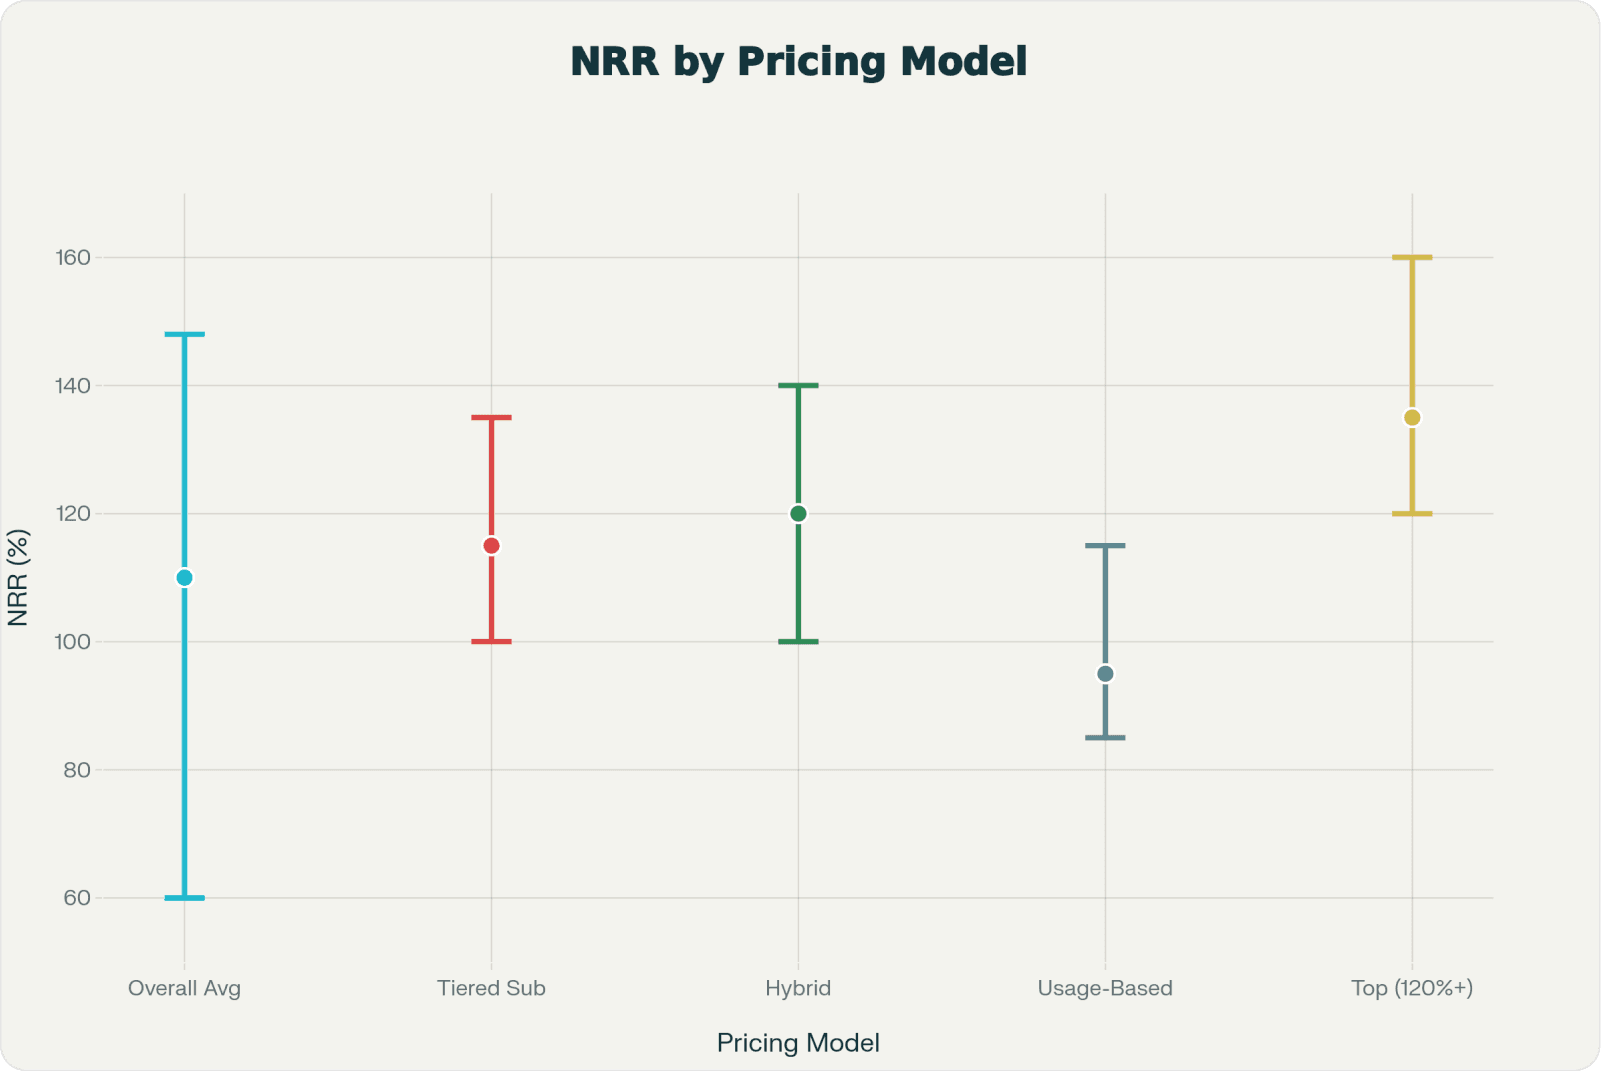
Net Revenue Retention (NRR) above 120% demonstrates pricing power that correlates with long-term market dominance
Regional pricing increases global revenue by 25-40% while only reducing average unit price by 15-20%
Determining the right pricing model is one of the most high-stakes decisions SaaS founders face. Pricing determines which customers you attract, how quickly you grow, and whether your business ultimately succeeds.
Yet executives spend just 11.5 hours over their entire business lifetime defining and testing pricing strategy, often treating it as an afterthought rather than a strategic lever. According to research from Maxio, this oversight costs companies millions in lost revenue and prevents them from reaching their full growth potential.
This comprehensive guide breaks down the major SaaS pricing models, reveals critical benchmarks and statistics, and provides a framework for choosing the right strategy for your product at every growth stage.
The Business Case for Getting Pricing Right
Pricing is not a back-office function—it's a strategic growth driver. SaaS companies using value metrics to set their pricing grow at twice the rate of companies that don't. The impact on business performance is dramatic.
Revenue Impact Through Strategic Pricing
Salesforce demonstrates the power of pricing strategy, with pricing increases accounting for approximately 25% of total revenue growth from 2022-2025. By 2025, Salesforce CRM top-tier pricing reached $500 per seat per month, up from $250 just five years prior.
As Patrick Campbell from ProfitWell notes, "Pricing has become as important a growth driver as customer acquisition." This shift reflects a fundamental change in how successful SaaS companies approach growth economics.
Pricing directly influences unit economics—the relationship between customer acquisition cost (CAC) and lifetime value (LTV). Companies that optimize pricing can support higher CAC ratios while maintaining healthy margins.
Investor Appeal and Net Revenue Retention
Net Revenue Retention (NRR) above 100% is a key metric attracting institutional investment. For public SaaS companies, the average NRR is around 114%, with pricing directly influencing this metric through upsells and retention.
According to Bessemer Venture Partners, "Companies with NRR above 120% demonstrate pricing power and product stickiness that correlates with long-term market dominance." This metric has become a primary valuation driver in SaaS M&A transactions.
NRR above 100% indicates your existing customer base is growing in value over time—a powerful signal that your pricing model successfully captures expanding customer value.
Cash Flow Efficiency and Billing Cadence
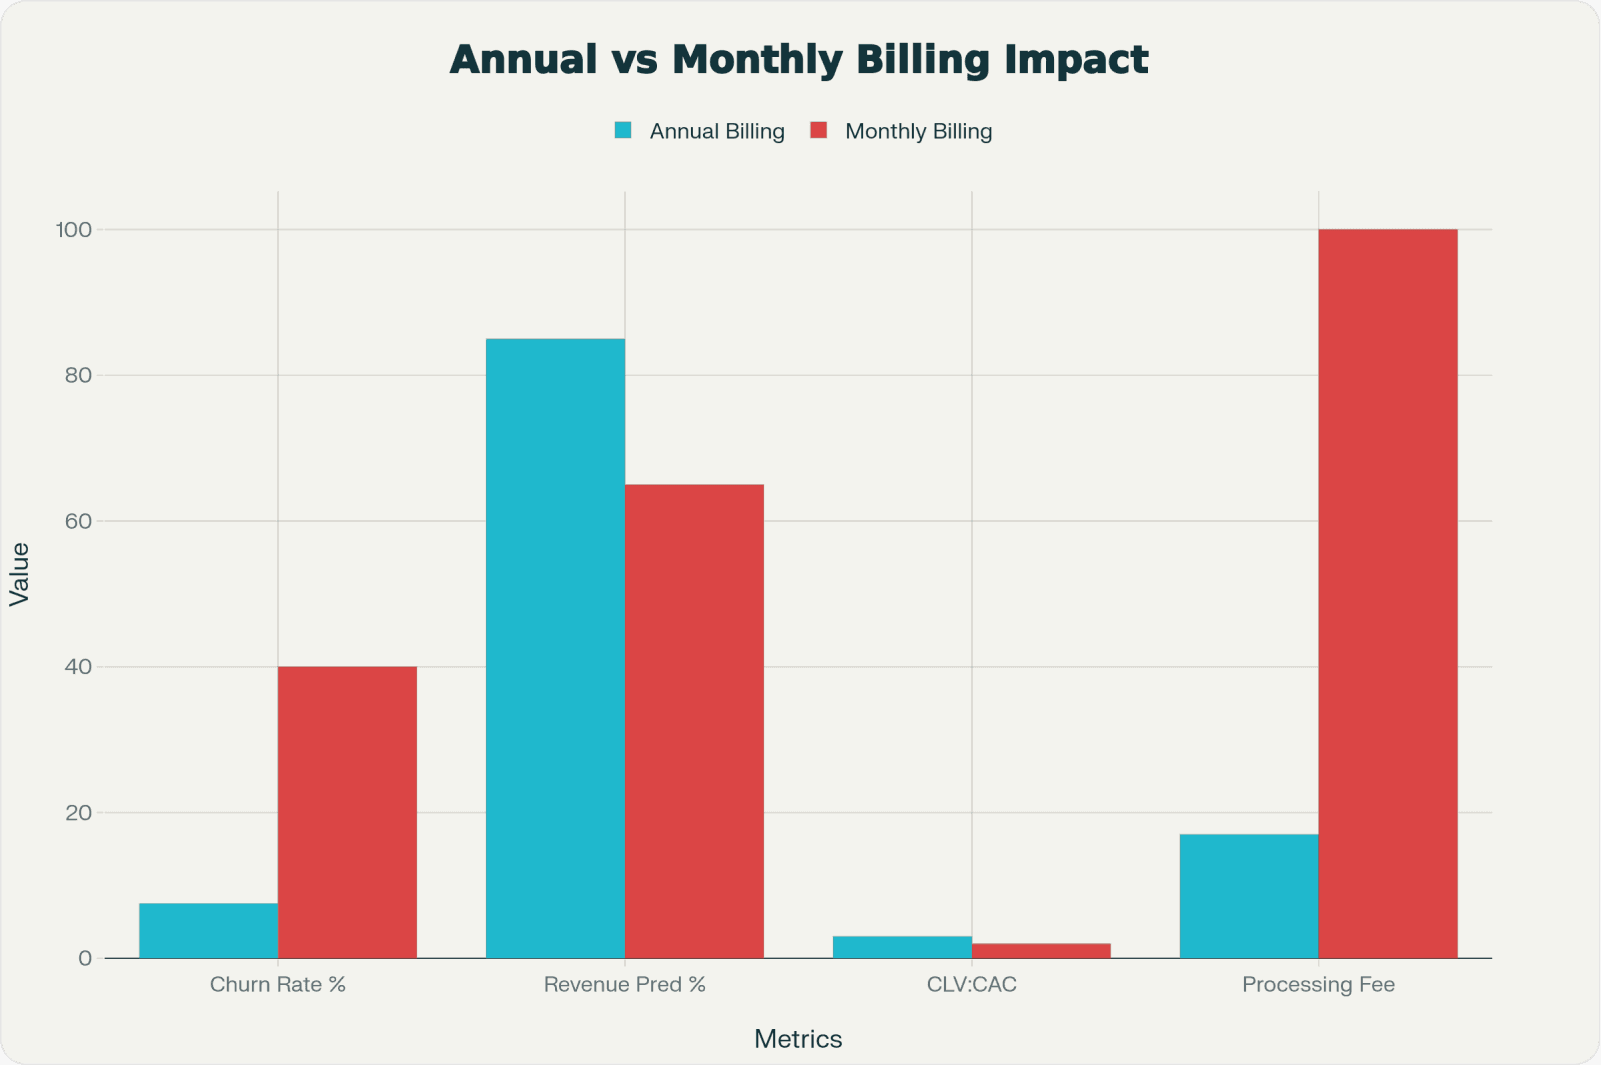
Your billing cadence significantly impacts cash flow predictability. Annual billing provides 80-90% revenue predictability compared to just 60-70% for monthly models, while reducing payment processing fees by 83%.
Research from SBI Growth shows that annual contracts improve revenue forecasting accuracy by 25% and reduce administrative overhead. The operational efficiency gains compound as you scale.
The stakes are clear: getting pricing right is not optional—it's essential for sustainable, scalable growth.
Understanding the Core SaaS Pricing Models
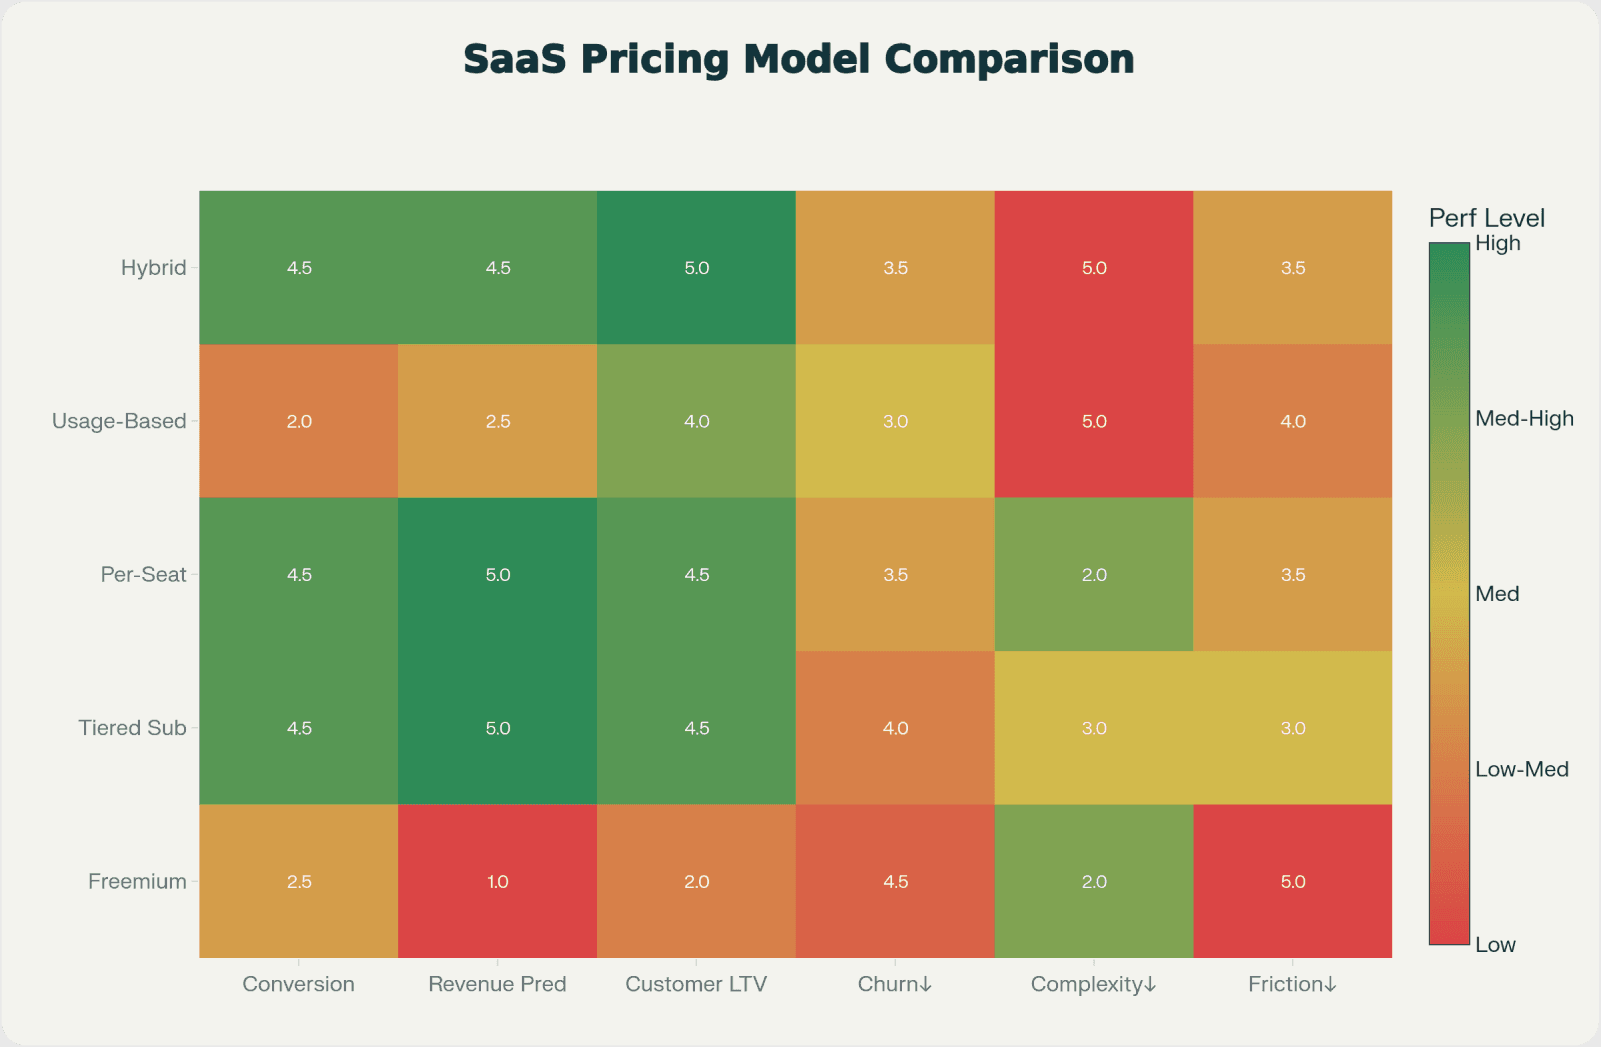
Freemium Pricing
How Freemium Works
The freemium model offers a free basic tier with paid premium features. Users access core functionality at no cost while paying to unlock advanced capabilities, premium support, or increased usage limits.
This model reduces activation friction—the barriers preventing users from experiencing product value. By eliminating price as an initial objection, freemium accelerates time-to-value.
Key Performance Metrics
Conversion Rates: Ideal freemium conversion rates fall between 2-5% for B2B SaaS, though the industry average hovers around 1%. Slack achieves freemium conversion rates above 30% due to network effects and strong product-market fit.
According to UserGuiding research, top-performing freemium products exhibit three characteristics: clear value differentiation between tiers, natural upgrade triggers tied to usage milestones, and seamless upgrade paths with minimal friction.
Churn Characteristics: Free users show significantly higher churn than paying customers, but the low acquisition cost and large user base compensate through occasional high-value conversions. The churn differential typically ranges from 40-60% higher for free versus paid users.
When to Use Freemium
Freemium works best for products with strong network effects (communication tools, collaboration platforms) or low marginal costs. It's particularly effective for products targeting SMB and consumer segments where price sensitivity is high.
The free tier must genuinely solve real problems but be limited enough to incentivize upgrades through feature gating and usage limits. Stanford research indicates that successful freemium products deliver 40-50% of full product value in the free tier.
As Julie Zhuo from Facebook notes,
"The freemium tier should make users successful enough to recognize the product's value, but constrained enough to want more."
Advantages of Freemium
Dramatically lowers acquisition friction (zero-price effect)
Builds large user bases quickly through viral adoption
Generates word-of-mouth through network effects
Provides authentic product-market validation at scale
Creates community and ecosystem effects
Disadvantages of Freemium
Low and unpredictable conversion rates create forecasting challenges
Higher churn among free users increases support costs
Requires strong product-market fit to justify free tier investment
Conversion timing is uncertain, complicating revenue forecasting
Risk of training users to expect free products indefinitely
Micro-Summary: Freemium reduces initial friction and builds user bases rapidly, but requires exceptional product-market fit and clear upgrade triggers to achieve sustainable conversion economics.
Subscription-Based (Tiered) Pricing
How Tiered Subscription Works
Customers select from multiple subscription tiers, each with increasing features, support levels, and usage limits. This is the most widely adopted model, with companies typically offering an average of 3.5 tiers.
Tiered pricing leverages price discrimination theory—segmenting customers by willingness to pay while maximizing value capture across segments. Each tier should target a distinct buyer persona with unique needs and budgets.
Key Performance Metrics
Churn Rates: 5-10% annually for annual plans versus 30-50% annually for monthly plans. This dramatic difference reflects both commitment psychology and switching costs.
Revenue Predictability: Annual subscriptions provide 80-90% predictability versus 60-70% for monthly billing. This predictability enables more aggressive growth investment and improves capital efficiency.
Customer Lifetime Value: A $50/month customer with 5% annual churn generates $1,000 CLV. That same customer on annual billing generates $2,400 CLV—a 140% increase. The compound effect of lower churn and upfront cash collection transforms unit economics.
Enterprise Adoption: 82% of enterprise customers prefer annual contracts for predictability and budget allocation purposes. Enterprise buyers typically operate on annual planning cycles that favor committed contracts.
Real-World Implementation Examples
Slack: Offers Free, Pro ($7.25/user/month), Business+, and Enterprise Grid tiers, each with increasing features like app integrations, advanced security, and compliance tools. Their tier architecture maps directly to organizational maturity stages.
HubSpot: Provides Starter ($45/month), Professional, and Enterprise tiers targeting different buyer personas and growth stages. Each tier includes marketing, sales, and service functionality scaled to company size.
Salesforce: Tiered offering from Essential to Unlimited, with pricing scaling from $165/user/month to $500/user/month. The wide pricing range accommodates SMBs through global enterprises within a single product family.
Advantages of Tiered Subscriptions
Highly predictable recurring revenue enables confident growth investment
Clear upgrade paths maximize customer lifetime value through expansion
Appeals to different buyer personas and budget levels simultaneously
Enables faster recovery of customer acquisition costs
Strong investor appeal due to revenue predictability and expansion potential
Disadvantages of Tiered Subscriptions
Requires careful tier design to avoid features bleeding into wrong tiers
May overprice or underprice certain segments without continuous optimization
Risk of customers choosing lowest tier and never upgrading (tier cannibalization)
Requires ongoing optimization and testing to maintain optimal conversion
Complexity increases with tier count, creating analysis paralysis
Micro-Summary: Tiered subscription pricing offers the highest revenue predictability and investor appeal while enabling clear segmentation, but requires continuous optimization to prevent tier cannibalization and pricing misalignment.
Per-Seat (Per-User) Pricing
How Per-Seat Pricing Works
Customers pay a fixed amount per user or team member, regardless of usage levels. The total bill scales linearly with headcount. This model creates transparent pricing that's easy to forecast for both vendor and customer.
Per-seat pricing works by aligning cost with organizational growth. As teams expand, software costs scale proportionally—creating predictable budgeting for customers.
When to Use Per-Seat Pricing
Per-seat pricing works best for collaboration tools, CRM systems, and project management software where value clearly increases with each additional user. It's particularly effective for team-based products where multiple users benefit from simultaneous access.
According to Gartner research, per-seat models perform best when individual user productivity gains are measurable and when collaboration benefits compound with team size.
Advantages of Per-Seat Pricing
Transparent and easy for customers to understand and budget
Revenue scales naturally with customer growth without negotiation
Reduces buyer surprise during contract renewal
Works well when value clearly ties to user count
Simplifies internal cost allocation for customers
Disadvantages of Per-Seat Pricing
Creates ceiling effects where customers artificially limit seat adoption
Discourages organizational adoption (finance teams resist adding seats)
Doesn't account for usage variation among users (power users vs. occasional users)
May undercharge high-engagement customers relative to value delivered
Vulnerable to "seat sharing" behaviors that reduce revenue
Micro-Summary: Per-seat pricing offers maximum transparency and scales with customer growth, but can create adoption resistance and fails to capture usage-based value differentiation.
Usage-Based Pricing
How Usage-Based Pricing Works
Customers pay for actual consumption of the service—measured by API calls, data processed, storage consumed, transactions, or other consumption metrics. This creates perfect alignment between costs incurred and value delivered.
Usage-based models reduce the cognitive load of purchase decisions by eliminating upfront commitment anxiety. Customers can start small and scale naturally.
Key Performance Metrics
Adoption Rate: 38% of SaaS companies now employ usage-based pricing, reflecting significant market shift toward consumption-based models. This adoption rate has doubled since 2020.
Growth Performance: Companies using usage-based models report significant revenue growth. Snowflake, utilizing tiered consumption-based pricing, projected an increase of up to $21 million in product revenue for Q4 2023.
Hybrid Model Performance: Companies using hybrid models (subscription + usage) report the highest median growth rate at 21%, outperforming pure subscription (19%) and pure usage-based (18%) models. The hybrid approach captures benefits of both predictability and scaling.
Revenue Forecasting Challenge: 73% of SaaS companies with usage-based models actively forecast variable revenue for financial predictability. McKinsey research indicates that advanced forecasting capabilities are essential for usage-based model success.
Real-World Implementation Examples
Snowflake: Charges per compute second and storage consumed, allowing startups and Fortune 500 companies to adopt at their own pace. Their separation of compute and storage enables customers to optimize costs independently.
Stripe: Charges 2.9% + $0.30 per transaction, directly tying revenue to customer transaction volume. As customer businesses grow, Stripe revenue scales automatically without negotiation.
AWS: Charges for EC2 compute hours, storage, data transfer, and other resources consumed. The granular metering creates precise cost allocation and optimization opportunities.
Advantages of Usage-Based Pricing
Lowers barrier to entry (small users pay proportionally less)
Perfectly aligns costs with customer value delivery
Scales revenue with customer growth without friction or negotiation
Incentivizes product improvement (more usage = more revenue)
Appeals to cost-conscious enterprise customers seeking efficiency
Reduces sales cycle length by eliminating commitment anxiety
Disadvantages of Usage-Based Pricing
Creates billing unpredictability for customers (increases churn risk)
Requires robust metering infrastructure and billing systems
Revenue forecasting becomes complex and requires sophisticated modeling
Risk of surprise bills damaging customer relationships and trust
Harder to communicate value proposition in marketing materials
Micro-Summary: Usage-based pricing perfectly aligns costs with value and lowers adoption barriers, but requires sophisticated infrastructure and creates forecasting complexity for both vendor and customer.
Hybrid Pricing Models
How Hybrid Models Work
Hybrid models combine multiple pricing approaches—typically a base subscription fee plus usage overage charges, or per-seat pricing with usage components. This structure balances predictability with fairness.
The base subscription covers core infrastructure and support costs while usage charges scale with value consumption. This two-part tariff structure is economically efficient.
Performance Data and Validation
Highest Growth Rates: Hybrid models (subscription + usage) report the highest median growth rate at 21%, outperforming pure models. Research from OpenView Partners confirms this growth premium persists across company stages.
NRR Performance: 57% of teams using hybrid pricing models achieve NRR above 100%, indicating successful value capture from existing customers. The dual revenue streams create multiple expansion vectors.
As Tomasz Tunguz from Theory Ventures states,
"Hybrid models represent the future of SaaS pricing—combining the predictability investors demand with the fairness customers expect."
Advantages of Hybrid Models
Provides revenue predictability (base subscription) plus growth potential (usage)
Prevents "whale" customers from consuming disproportionate resources without paying more
Appeals to both cost-conscious and high-volume customers simultaneously
Balances simplicity with fairness across customer segments
Creates natural expansion revenue as customer usage grows
Reduces churn by making costs feel more equitable
Disadvantages of Hybrid Models
More complex to communicate and market effectively
Requires sophisticated billing infrastructure to track multiple dimensions
May confuse customers if not explained clearly
Harder to benchmark against pure model competitors
Requires careful calibration of base versus usage pricing split
Micro-Summary: Hybrid pricing models deliver the highest growth rates by combining subscription predictability with usage-based fairness, though they require more sophisticated infrastructure and communication strategies.
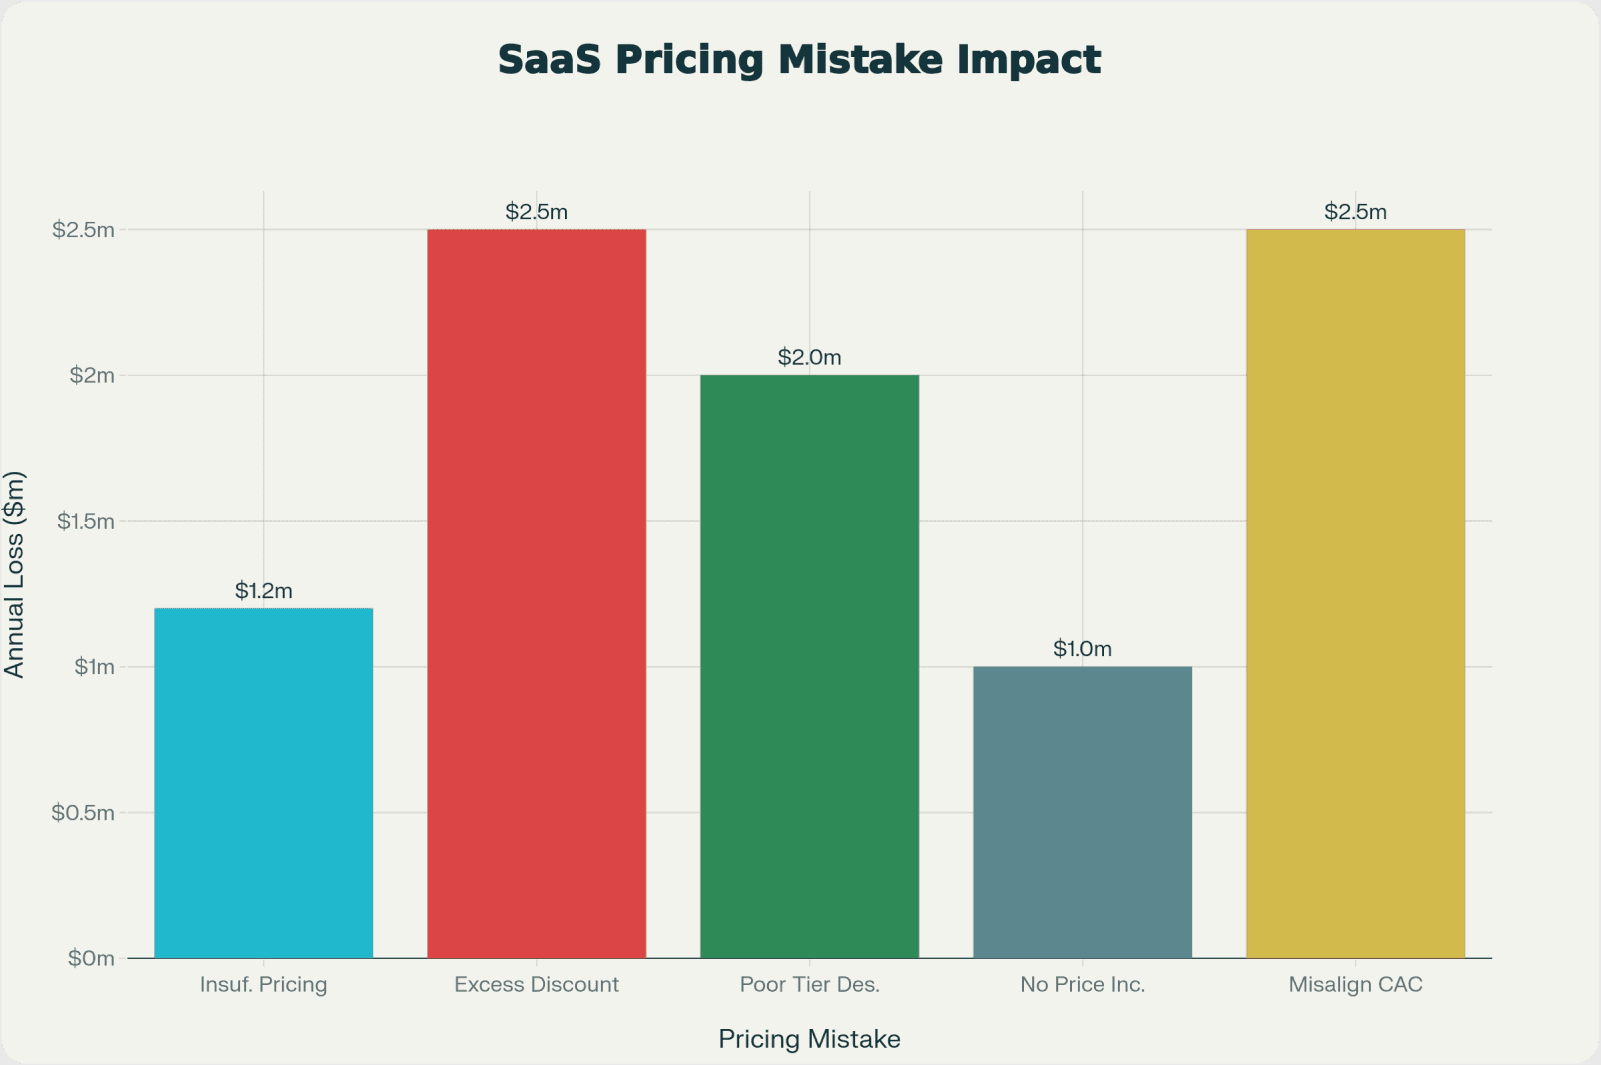
Common SaaS Pricing Pitfalls and How to Fix Them
Pitfall 1: Spending Insufficient Time on Pricing
The Problem
Executives spend just 11.5 hours over the entire lifetime of their business defining and testing pricing strategy. Yet they spend 15 hours annually choosing custodial supplies. This neglect means pricing optimization is almost never a priority, and you're leaving significant revenue on the table.
Companies that don't actively manage pricing are essentially giving money back to customers. You're likely losing 10-15% of potential revenue by failing to optimize pricing over time.
As April Dunford, positioning expert, notes:
"Pricing is not a one-time decision—it's an ongoing strategic process that compounds returns over time."
The Real Impact
The opportunity cost of pricing neglect compounds annually. A company with $10M ARR losing 12% to pricing inefficiency forgoes $1.2M annually—$12M over ten years excluding growth.
Research from Maxio shows that companies reviewing pricing quarterly grow 23% faster than those reviewing annually. The difference reflects continuous alignment with market conditions and customer willingness to pay.
How to Fix It
Allocate dedicated resources: Assign someone (ideally a cross-functional team) to pricing strategy and optimization. Pricing requires ownership, not delegation to whoever has free time.
Establish quarterly pricing reviews: Schedule regular pricing audit sessions every Q1, Q2, Q3, and Q4. At minimum, review pricing every six months for early-stage companies and annually for mature companies.
Track key metrics religiously: Monitor MRR, ARR, conversion rates by tier, churn by tier, and LTV by segment monthly. These metrics will immediately signal when pricing needs adjustment.
A/B test continuously: Run small pricing experiments on 10-20% of traffic. Test different prices, tier names, feature bundles, and messaging to identify higher-converting options. Small improvements compound dramatically.
Build pricing into board meetings: Present pricing metrics alongside revenue metrics to keep it visible and prioritized. Board-level visibility ensures pricing receives appropriate strategic attention.
Micro-Summary: Insufficient pricing attention costs companies 10-15% of potential revenue; fix this by allocating dedicated resources, establishing quarterly reviews, tracking key metrics religiously, and continuously A/B testing to optimize.
Pitfall 2: Setting Pricing Without a Clear Value Metric
The Problem
Pricing based on costs, competitor pricing, or arbitrary numbers rather than customer value delivered results in misaligned pricing. SaaS companies using value metrics grow at twice the rate of those that don't. Without a value metric, you're essentially guessing.
A value metric is the unit that ties price to value delivery—the dimension along which customers experience increasing returns. Choosing the wrong metric creates friction and leaves money on the table.
Real Example
A video collaboration tool initially charged based on storage consumed. However, customers' actual value came from concurrent users and meeting duration. The disconnect meant high-value customers felt overcharged while storage-heavy but lower-value users paid too little.
After identifying concurrent users as the true value metric, revenue increased 40% with the same customer base. The realignment reduced churn by 18% and increased expansion rates by 25%.
How to Fix It
Identify what customers truly value: Conduct customer interviews asking "What benefit would you lose if we removed X feature?" The answers reveal your real value metrics. Look for emotional intensity in responses.
Correlate value metrics to cost structure: Your value metric should ideally correlate with your infrastructure costs. If bandwidth is your largest cost, charge based on bandwidth. This ensures margin expansion as you scale.
Test multiple metrics: Track whether different potential value metrics correlate with customer satisfaction, retention, and willingness to pay. The best metric should track all three simultaneously.
Validate with customers: Show customers your proposed value metric and pricing. Ask directly: "Would you feel this is fair pricing?" A strong value metric should feel intuitively fair to 70%+ of customers.
Make the metric transparent: Customers should clearly understand what they're being charged for and see the direct correlation between what they use and what they pay. Opacity creates distrust and friction.
According to Price Intelligently research, companies that align pricing with customer-perceived value metrics reduce sales cycle length by 30% and increase win rates by 25%.
Micro-Summary: Value metric misalignment causes companies to underperform by 2x; fix this by identifying what customers truly value through interviews, correlating metrics to costs, testing multiple options, validating with customers, and ensuring complete transparency.
Pitfall 3: Poor Tier Design and Feature Cannibalization
The Problem
When pricing tiers are poorly designed, you encounter tier cannibalization—customers choosing lower tiers despite being willing to pay more. This happens when tiers are too similar in features, pricing gaps are too small, features appear in the wrong tiers, or the "best value" tier doesn't stand out.
Poor tier design creates usability debt—customers struggle to understand differentiation, leading to analysis paralysis and downgrade selection.
Real Case Study
Narvar (a post-purchase experience platform) initially struggled with tiered pricing that forced $3,000-$5,000 customers to jump to enterprise tiers at $15,000+ (a 75-80% price increase). This created friction and customer complaints.
The company redesigned with flexible incremental pricing and additional tiers at $5,000-$8,000 price points. Result: lower discounting, higher average selling price, and improved retention. The tier count increased from 3 to 5, but customer satisfaction improved dramatically.
How to Fix It
Design tiers based on real demand clusters: Use pricing analytics to identify where customers naturally cluster by willingness to pay. Build tiers at those natural demand breakpoints, not at arbitrary price intervals.
Alpine Strategic Group research shows that natural demand clusters typically emerge at 3x intervals (e.g., $30, $90, $270) rather than linear intervals ($30, $60, $90).
Ensure significant feature gaps between tiers: Each tier should have obviously different value. A good rule: the "best value" middle tier should have 70% of features, the basic tier 40%, and the premium tier 100%. The gaps must be perceptually meaningful.
Price the middle tier as "best value": Research shows 41.4% of customers choose the middle tier when three options are presented. Position this tier prominently with "Best Value" or "Most Popular" badges to anchor decisions.
Create logical progression: The pricing gap should increase at higher tiers. For example: Basic $29, Pro $79 ($50 gap), Premium $249 ($170 gap). This creates perceived value acceleration.
Test feature placement: A/B test moving features between tiers. If a feature in Tier 2 is rarely used, move it to Tier 3 and observe impact on conversions and upsells. Let data guide feature allocation.
Review tier health monthly: Track conversion rates and customers per tier. If >60% of customers choose the lowest tier, your basic tier is too feature-rich. Aim for 15-25% basic, 45-55% middle, 20-30% premium distribution.
Micro-Summary: Tier cannibalization occurs when design is arbitrary rather than data-driven; fix this by analyzing natural demand clusters, ensuring significant feature gaps, positioning middle tier as best value, creating progressive pricing gaps, testing feature placement, and monitoring tier health monthly.
Pitfall 4: Excessive Discounting
The Problem
Nearly 80% of SaaS companies willingly discount by 25% or more to acquire customers. While this drives short-term revenue, it creates serious long-term problems: customers acquired via deep discounts are 3-5x more likely to churn, discount customers are price-sensitive and won't renew at full price, discounts signal that your list price is wrong, and acquisition costs skyrocket.
Discounting creates a discount expectation cycle—customers learn to wait for deals or negotiate harder, creating a race to the bottom.
Real Data
Customer Acquisition Costs in B2B SaaS average $205 per customer. Losing even 5% more customers to churn-from-discounting-induced behavior costs companies $10,250+ per 100 customers lost in unnecessary re-acquisition costs.
Research from Stripe shows that customers acquired at 30%+ discount churn at 4.2x the rate of full-price customers. The discount attracts bargain-seekers rather than value-seekers.
How to Fix It
Audit your discounting patterns: Track what percentage of deals receive discounts and by how much. If more than 15-20% of deals involve discounts exceeding 10%, your pricing is too high relative to perceived value.
Fix the root cause, not the symptom: If customers consistently want 20% off, that's not a negotiation problem—your baseline price is wrong. Lower the price permanently and maintain margin integrity.
Implement discount guardrails: Set a policy: no more than 10% discount for early-stage customers, no more than 5% for renewals. Make exceptions rare and require executive approval with written justification.
Build competitive positioning instead: When customers ask for discounts, explain unique value instead. "We can't discount, but our integrated analytics module (unique to us) will save you 40% on analysis time" is far more effective.
Segment your discounting strategy:
Early-stage startups: 15-20% first-year discount (one-time only, no repeat)
Trials converting to paid: 5-10% annual commitment discount
Renewals: No discounts; instead offer additional features or capacity
Enterprise: Custom pricing, not discounts off list price
According to SaaS CEO research, companies that maintain pricing discipline grow 18% faster and achieve 12% higher gross margins than heavy discounters.
Micro-Summary: Excessive discounting (25%+ for 80% of SaaS companies) attracts wrong customers and creates 3-5x higher churn; fix this by auditing patterns, addressing root causes, implementing guardrails, building competitive positioning, and segmenting strategy by customer type.
Pitfall 5: "Set and Forget" Pricing
The Problem
Companies implement pricing and then never adjust it again. This leaves enormous money on the table. Companies with no pricing changes in 12 months are guaranteed to be losing money as market conditions, competitive landscape, and customer willingness to pay evolve.
Static pricing creates pricing drift—the gap between what customers would pay and what you're charging widens over time, especially as you add features and value.
How to Fix It
Review pricing quarterly: Early-stage companies should review quarterly and adjust every 6 months. Mature companies should review quarterly but adjust every 6-12 months based on market feedback and competitive dynamics.
Establish a pricing optimization flywheel:
Q1: Analyze pricing data and customer feedback systematically
Q2: Design A/B tests for pricing changes with clear hypotheses
Q3: Implement tests with 20% of traffic to validate assumptions
Q4: Finalize changes based on test results and roll out broadly
Implement price increases strategically: If increasing prices, do it alongside major feature launches, significant product improvements, clear communication of added value, and grandfathering options for existing customers to maintain goodwill.
Track pricing health metrics: Monitor monthly recurring revenue (MRR) and annual recurring revenue (ARR), conversion rates by tier and cohort, churn rates by pricing tier, customer lifetime value by segment, and net revenue retention and expansion revenue.
Tweak pricing pages regularly: Update plan names to reflect market language, highlight new features in specific tiers, change design elements to make prices more appealing, and update copy explaining value proposition. Small changes compound.
Research from Paddle indicates that companies reviewing pricing quarterly achieve 21% higher revenue growth than those reviewing annually. The continuous optimization creates compound advantages.
Micro-Summary: Static "set and forget" pricing leaves money on the table; fix this by reviewing quarterly, establishing optimization flywheels, implementing strategic increases, tracking health metrics religiously, and regularly tweaking pricing pages to reflect evolving value.
Pitfall 6: Ignoring Geographic Pricing and Localization
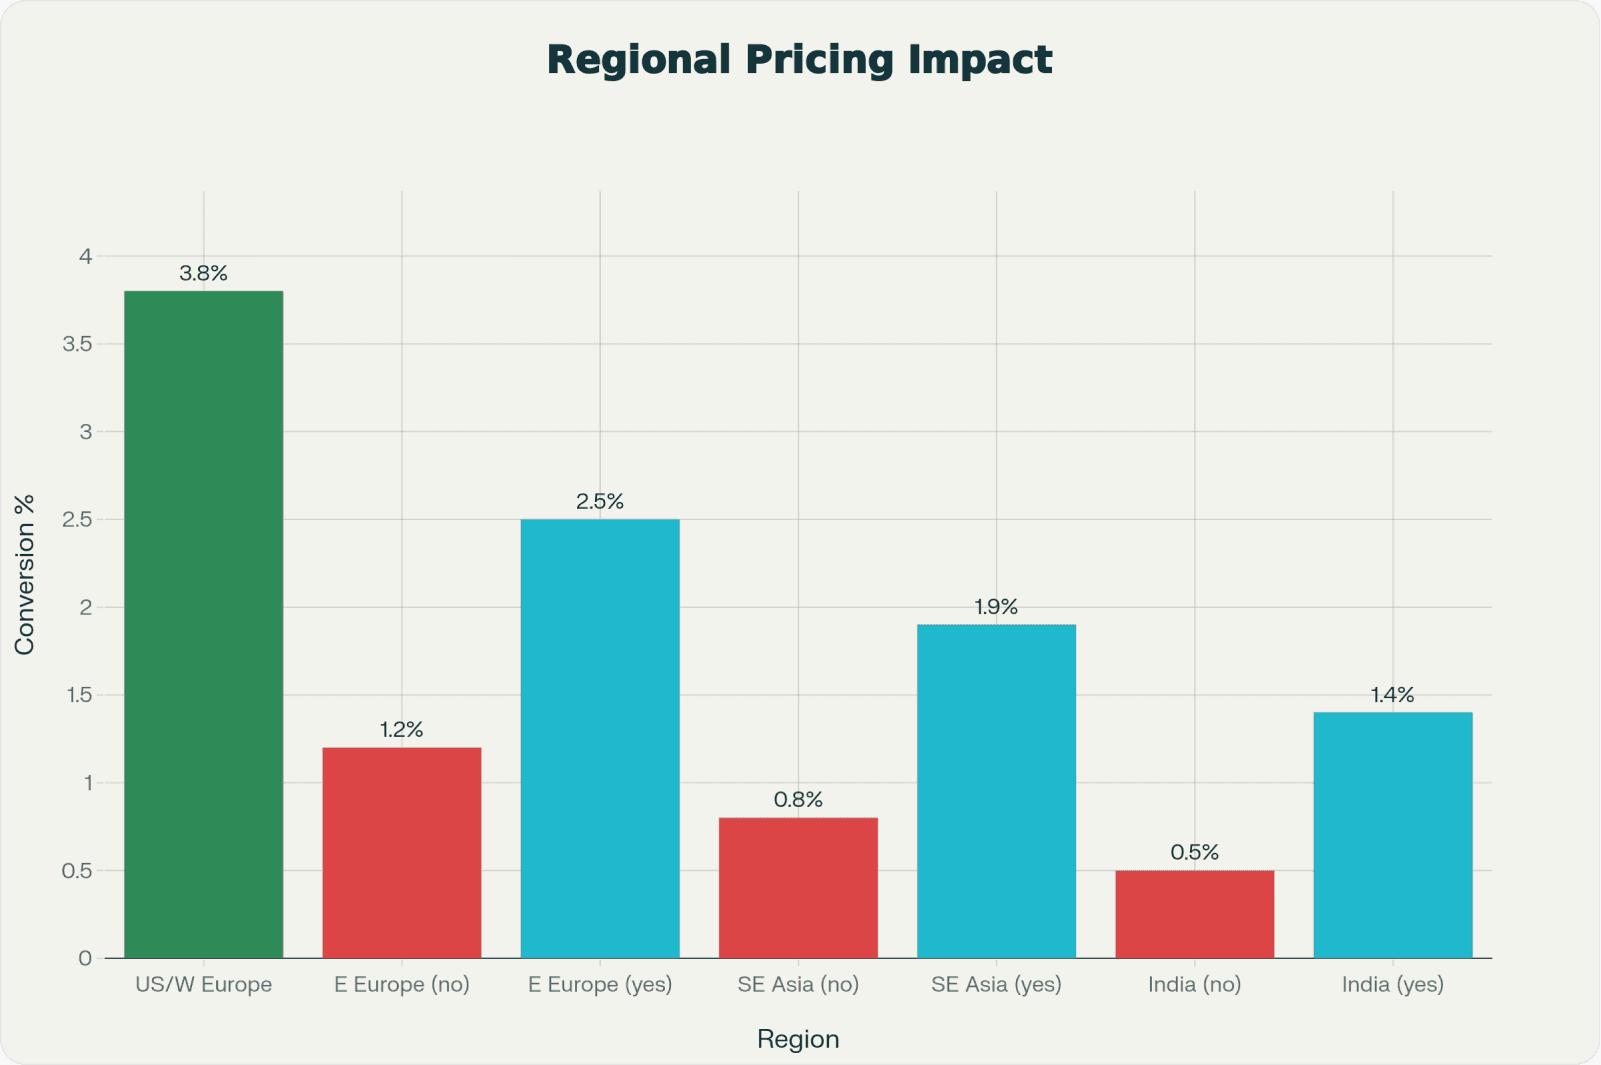
The Problem
Charging the same price globally ignores purchasing power parity. A $99/month plan is affordable for a US-based company but unaffordable for an equal company in Southeast Asia or Eastern Europe. This limits addressable market and leaves potential revenue on the table.
Geographic pricing reflects economic reality—willingness to pay correlates with local purchasing power, not just company budget or size.
Real Case Study
Litmus (email marketing platform) discovered that prospects in non-US regions "just didn't feel comfortable paying for a product in a different currency; they didn't necessarily trust us." The currency barrier created psychological friction beyond affordability.
By implementing localized currency pricing and regional price adjustments, they expanded addressable market and improved conversion rates in emerging markets by 35%. The localization also improved brand perception and trust.
How to Fix It
Implement regional pricing tiers: Create pricing that reflects local purchasing power:
US/Western Europe: Full price ($99/month)
Eastern Europe: 40-50% discount ($49-59/month)
Southeast Asia: 50-60% discount ($39-49/month)
India: 60-70% discount ($29-39/month)
Bill in local currency: Customers are 2-3x more likely to purchase when billed in their local currency. This removes psychological friction and pricing transparency concerns.
Adjust payment methods by region: Credit cards work in developed markets; offer mobile payments, local bank transfers, and cash transfers in emerging markets. Payment method availability directly impacts conversion.
Consider local competitors: Research what competitors charge in each region to inform your local pricing strategy. Local pricing context matters more than global positioning.
Research from PayPro Global shows that regional pricing increases global revenue by 25-40% while only reducing average unit price by 15-20%—a highly profitable tradeoff.
Micro-Summary: Ignoring geographic pricing limits addressable markets unnecessarily; fix this by implementing regional pricing tiers reflecting purchasing power parity, billing in local currencies, adjusting payment methods by region, and researching local competitive context.
Pitfall 7: Not Accounting for Failed Payment Recovery
The Problem
Up to 70% of failed payments are actually recoverable. However, most SaaS companies don't implement robust payment retry logic or customer notification systems. This results in involuntary churn that looks like voluntary churn but is actually a system failure.
Failed payment recovery (dunning management) directly impacts revenue retention. Every recovered payment saves both the customer relationship and avoids re-acquisition costs.
Real Impact
Effective dunning management (payment recovery workflows) recovers 40-60% of otherwise-lost revenue. With average CAC at $205, recovering just 40% of failed payments can save $82 per lost customer—multiplied across hundreds of customers monthly, this equals substantial revenue.
According to LTVPlus research, companies with sophisticated dunning systems maintain 2-3% lower involuntary churn rates than those without—a difference that compounds significantly over time.
How to Fix It
Implement automated retry logic: Set up intelligent payment retries:
First retry: 1-3 days after initial failure (catches temporary issues)
Second retry: 5-7 days after first retry (allows customer notification response)
Third retry: 10-14 days after second retry (final automated attempt)
Final notice: 21 days with strong call-to-action to update payment method
Create customer notification sequences:
Proactive notification before card expiry (30 days out)
Immediate notification of failed payment with update link
Follow-up emails at days 3, 7, 10 if not resolved
Make updating payment details one-click easy through secure links
Offer grace periods for annual customers: Annual customers who experience payment failures should receive 5-7 day grace periods to update payment methods without service interruption. Their commitment history warrants consideration.
Enable automatic card updater services: Many payment processors offer automatic card updates when customers' cards are renewed. Enable this feature by default to prevent expiration-related failures.
Monitor involuntary churn: Track failed payments as a separate metric from voluntary churn. Involuntary churn should be <2% of MRR; if higher, your dunning management needs improvement. Segment by failure reason to identify systemic issues.
Research from Paddle shows that implementing intelligent dunning reduces involuntary churn by 45-60% on average, with best-in-class companies reducing it by up to 80%.
Micro-Summary: Failed payment recovery is overlooked despite 70% recoverability and can save 40-60% of at-risk revenue; fix this by implementing automated retry logic, creating notification sequences, offering grace periods, enabling card updaters, and monitoring involuntary churn separately.
Pitfall 8: Poor Communication During Pricing Changes
The Problem
The case study of Cursor AI illustrates this perfectly. Cursor changed its AI pricing model but failed spectacularly in communicating the change. Multiple blog posts contradicted each other, the pricing page remained confusing weeks later, and the CEO had to issue a public apology and offer refunds after massive backlash.
Poor pricing change communication destroys trust—customers feel blindsided, sales teams lack talking points, and support teams face hostile inquiries without preparation.
Real Impact
A well-communicated pricing change improves customer retention by 10-15%. A poorly communicated one triggers 5-10% churn among affected customers. That's a 20% swing in retention from communication alone—the difference between growth and contraction.
According to GetMonetizely analysis, the Cursor AI fiasco resulted in estimated 8-12% customer churn and significant brand damage that took months to repair. The crisis was entirely preventable through proper communication planning.
How to Fix It
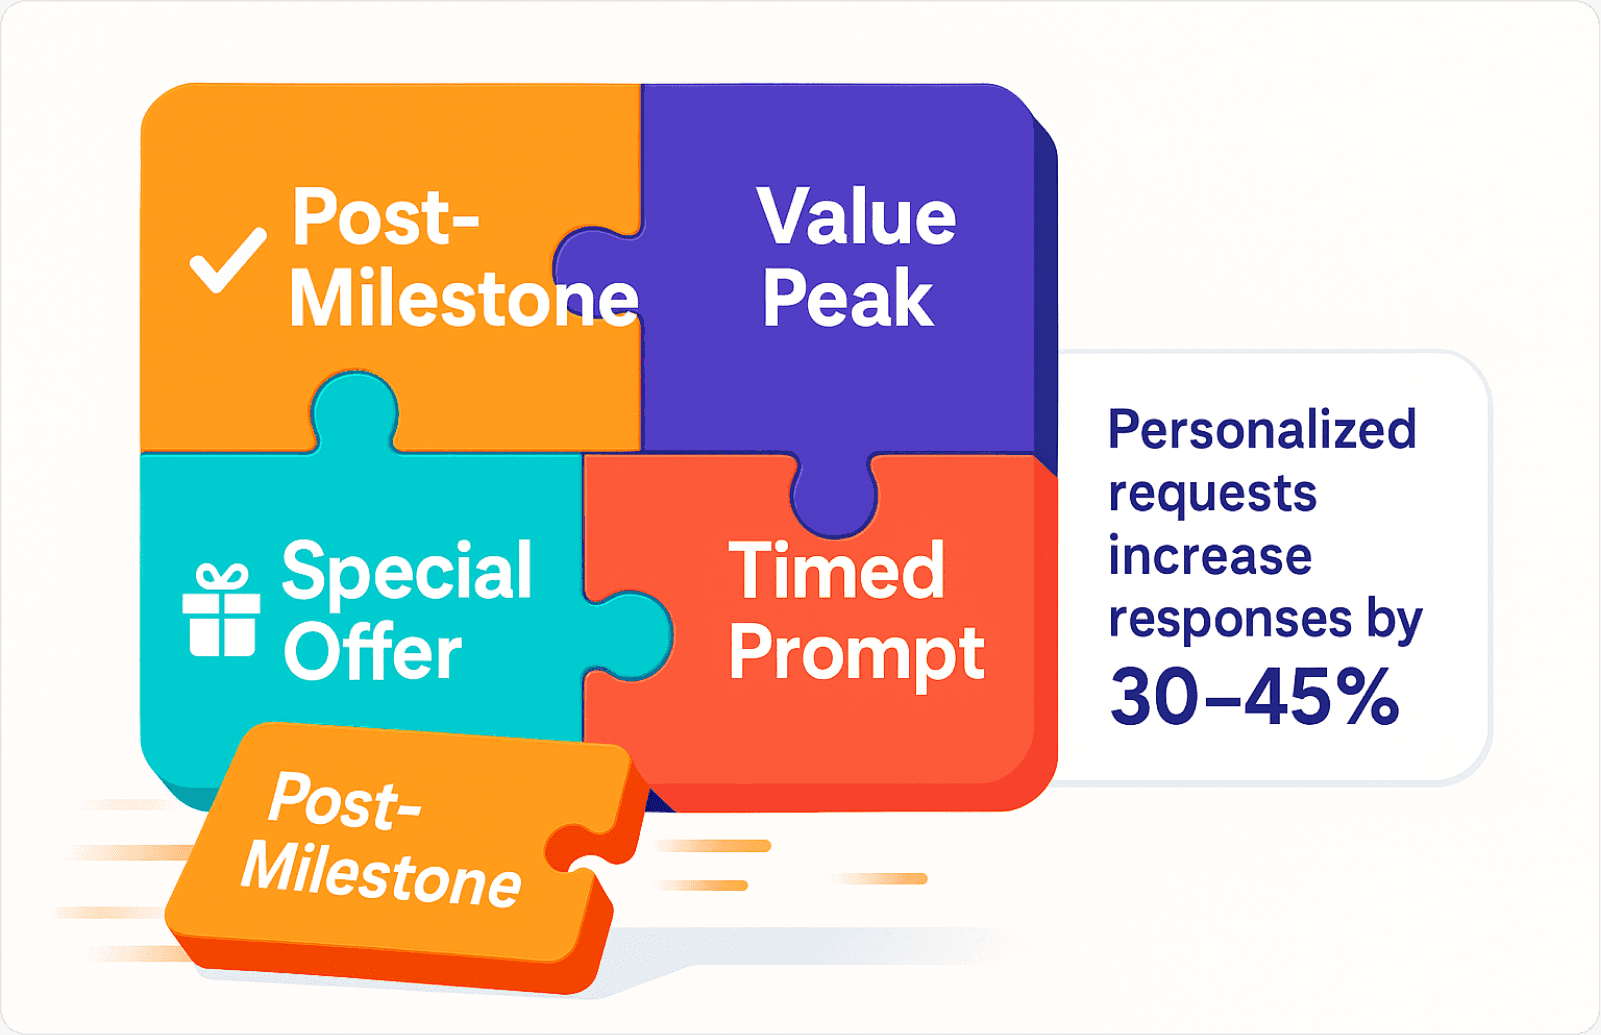
Develop a comprehensive communication plan (2-3 weeks before rollout):
Alignment meeting with leadership, sales, and support teams
Clear talking points explaining why the change is happening
Customer impact analysis (who pays more, who pays less, who's unaffected)
Grace period and transition options clearly defined
FAQ addressing common concerns and objections
Segment customer communication: Don't communicate the same message to all customers. Tailor messaging to grandfathered customers (no change for them, emphasize stability), positively affected customers (price stays same or decreases, celebrate value), and negatively affected customers (price increases, justify with added value).
Provide transition options:
60-90 day notice before changes take effect
Option to grandfather existing customers at old pricing for 12 months
Advance warning of future pricing changes beyond current change
"Lock in" pricing by committing to annual plans before the change date
Use consistent messaging: Ensure blog posts, pricing pages, help docs, and sales materials all say the same thing. Test for consistency before rollout. Assign one person to verify message alignment across all channels.
Be transparent about why: Customers accept price increases better when you explain the reasoning. "We added [Feature X], improved [Metric Y], and X% of customers reported that's worth it" is far more acceptable than raising prices randomly.
Implement in stages: Roll out pricing changes to 10% of new customers first, monitor results, then expand to 50%, then 100%. This prevents catastrophic failures and allows iteration based on real feedback.
Research from Paddle shows that companies with documented communication plans experience 60% less churn during pricing changes than those without plans.
Micro-Summary: Poor pricing change communication causes 5-10% churn and brand damage; fix this by developing comprehensive plans, segmenting customer communication, providing transition options, ensuring message consistency, being transparent about reasoning, and implementing in stages.
Pitfall 9: Misaligned CAC Payback Periods by Customer Segment
The Problem
Companies set a single target Customer Acquisition Cost (CAC) payback period but don't account for dramatically different LTVs across segments. A $200 CAC payback might be perfect for enterprise customers ($50K LTV) but unsustainable for SMB customers ($2K LTV).
This misalignment causes capital misallocation—overspending on low-LTV segments while underspending on high-LTV segments. The result is simultaneously burning money and missing growth opportunities.
Real Impact
Setting uniform CAC targets causes you to over-acquire low-value customer segments (destroying profitability) while under-acquiring high-value segments (leaving growth on the table). The net effect can reduce overall growth by 20-30% while worsening unit economics.
According to SBI Growth research, companies that segment CAC targets by customer tier achieve 35% better capital efficiency and 28% faster growth than those using unified targets.
How to Fix It
Calculate LTV by customer segment: Don't use a company-wide average LTV. Segment carefully:
Enterprise: $50,000-$200,000 LTV
Mid-Market: $10,000-$30,000 LTV
SMB: $2,000-$5,000 LTV
Freemium-to-Paid: $500-$1,500 LTV
Set different CAC targets by segment:
Enterprise: Can support $2,000-$3,000 CAC (3-4 month payback)
Mid-Market: Can support $500-$1,000 CAC (6-12 month payback)
SMB: Can support $150-$300 CAC (12-24 month payback)
Freemium conversion: Can support $50-$100 CAC (24+ month payback)
Create separate campaigns by ICP: Run different marketing campaigns for each customer segment with appropriate spend levels. Segment landing pages, ad creative, and messaging by target segment.
Use value-based bidding: In Google Ads and other platforms, use value-based bidding to optimize for higher-value customer conversions. Train algorithms on actual LTV rather than lead volume.
Track conversion quality: Not all demos or free trials are equal. Track demo-to-customer conversion rates and average LTV by traffic source. Prioritize high-LTV traffic sources even if they cost more per lead.
Research from ContSq shows that segmented CAC optimization increases marketing ROI by 40-60% while improving overall customer quality and reducing churn.
Micro-Summary: Uniform CAC targets misallocate capital across segments with different LTVs; fix this by calculating LTV by segment, setting differentiated CAC targets, creating separate campaigns, using value-based bidding, and tracking conversion quality to optimize for valuable customers rather than lead volume.
Strategic Framework: Choosing the Right Pricing Model
Step 1: Understand Your Cost Structure
Your pricing model should align with how costs scale in your business. Ask yourself: Do my costs increase with users (per-seat), usage (usage-based), or relatively fixed (tiered subscription)?
Fixed-cost businesses (content libraries, pre-built tools) favor subscription models. Variable-cost businesses (compute, storage, API calls) favor usage-based models. Hybrid cost structures benefit from hybrid pricing.
According to McKinsey research, alignment between cost structure and pricing model improves gross margins by 15-25% compared to misaligned approaches.
Step 2: Analyze Customer Segmentation
Map your customers across three dimensions:
(1) Willingness to Pay:
Enterprise: $5,000-$100,000+ annually
Mid-Market: $1,000-$10,000 annually
SMB: $100-$1,000 annually
Consumer: $10-$100 annually
(2) Usage Patterns:
Similar usage → Tiered or per-seat pricing
Highly variable usage → Usage-based or hybrid pricing
Unpredictable usage → Freemium with usage tiers
(3) Predictability Requirements:
Enterprise often demands predictability → Subscription or per-seat
SMB values flexibility → Usage-based or monthly subscription
Startups value low barrier to entry → Freemium or usage-based
Research from OpenView Partners shows that segmentation-aligned pricing improves win rates by 30-45% compared to one-size-fits-all approaches.
Step 3: Define Your Value Metric
Your value metric should directly correlate with customer value delivered. Research shows that SaaS companies using value metrics grow at twice the rate of those that don't.
Examples:
Slack: Messages sent (correlates with per-user communication value)
Stripe: Transactions processed (direct value delivery metric)
Snowflake: Data processed + storage consumed (direct cost correlation)
Mailchimp: Email contacts managed (clear value scaling metric)
The ideal value metric satisfies three criteria: customers understand it intuitively, it correlates with value delivered, and it aligns with your cost structure.
As Jason Lemkin from SaaStr notes: "The best value metrics are obvious in retrospect but require deep customer understanding to identify."
Step 4: Research Competitive Pricing
While copying competitors is a mistake, understanding the competitive landscape is essential. Don't let competition anchor your pricing. Instead, use it to validate whether your pricing hypothesis is in the right ballpark.
Analyze competitors across:
Price points by tier
Feature differentiation strategies
Value metric choices
Billing cadence preferences
Discount patterns
Use competitive research to identify white space—underserved segments or pricing approaches competitors haven't adopted yet.
Step 5: Apply the 10x Rule
Calculate the value your product delivers and price at approximately 10% of that value. This ensures customers perceive strong ROI while you capture meaningful revenue.
If your product saves customers $100,000 annually, pricing at $10,000 creates a 10x return—compelling value that justifies purchase and minimizes churn.
According to research from Harvard Business Review, the 10x rule creates sufficient value margin to overcome switching costs, competitive alternatives, and change resistance.
Step 6: Test and Iterate
Before finalizing pricing, validate through:
Landing page testing with 3-5 different price points to identify demand curves. Run tests for 2-4 weeks minimum to capture full consideration cycles.
A/B testing different tiers/billing options/feature bundles with real traffic. Monitor conversion, trial-to-paid, and early retention signals.
Customer interviews asking "Would you pay $X for this solution?" and "At what price would this feel expensive but still worth it?" Identify price sensitivity ranges.
Cohort analysis tracking conversion, churn, and LTV by pricing tier. Look for tier-specific patterns that indicate optimal pricing levels.
Research from Price Intelligently shows that companies conducting pricing validation tests before launch achieve 25-40% higher initial pricing efficiency than those launching without testing.
Micro-Summary: Choosing the right pricing model requires understanding cost structure, analyzing customer segmentation across multiple dimensions, defining clear value metrics, researching competitive positioning, applying the 10x value rule, and rigorously testing before launch to validate assumptions.
Implementation Best Practices
Best Practice 1: Transparent Communication
Make pricing instantly clear to prospects by:
Publishing pricing publicly: Transparency reduces sales friction and enables self-selection. Hidden pricing increases bounce rates by 40-60%.
Explaining what's included in each tier clearly: Use simple language avoiding jargon. Customers should understand tier differences in 30 seconds.
Showing value comparison between tiers: Highlight relative value rather than just feature lists. Focus on outcomes and benefits.
Making feature differences obvious: Use clear visual differentiation (checkmarks, feature highlights) to enable quick comparison scanning.
According to UserGuiding research, transparent pricing reduces sales cycle length by 25-35% and improves conversion rates by 15-20% compared to hidden pricing.
Best Practice 2: Strategic Tier Anchoring
Use psychological pricing effectively by:
Positioning the middle tier as "best value": Most customers choose the second tier when three options are presented. Use "Best Value" or "Most Popular" badges to anchor this selection.
Pricing enterprise tier significantly higher: The high anchor makes mid-tier pricing seem reasonable by comparison. The contrast effect drives middle tier selection.
Using charm pricing ($49 vs. $50): Charm pricing improves conversion by 8-12% through psychological price perception effects. The left-digit effect creates perceived value.
Research from behavioral economics shows that proper anchoring increases average selling price by 15-25% without reducing conversion rates.
Best Practice 3: Clear Upgrade Paths
Provide frictionless upgrade mechanisms:
Within-product upgrade prompts: Surface upgrade options when customers approach usage limits. Make the path from notification to upgraded plan <30 seconds.
Clear value communication: When prompting upgrades, explain what they gain, not what they're limited by. Frame positively around expansion rather than negatively around constraints.
Trial higher tiers: Offer temporary access to higher tiers so customers experience expanded value before committing. Trials of premium tiers convert at 40-60% rates.
Proactive usage alerts: Notify customers when they're at 70%, 85%, and 100% of tier limits. Give them time to decide rather than surprising them with blocks.
According to ChurnZero research, frictionless upgrade paths increase expansion revenue by 30-50% compared to requiring sales contact for upgrades.
Best Practice 4: Data-Driven Refinement
Continuously optimize pricing based on:
Conversion by tier: Track which tiers convert highest from trial/freemium. Optimize tier feature allocation based on conversion patterns.
Churn by tier: Monitor whether specific tiers show elevated churn. High churn may indicate pricing misalignment or insufficient value.
LTV by tier: Calculate lifetime value by tier to identify most valuable segments. Allocate resources toward highest-LTV tier acquisition.
Customer segment pricing preferences: Survey customers quarterly about pricing satisfaction. Track Net Promoter Score correlation with pricing tiers.
Regular quarterly reviews should inform pricing adjustments. Set clear thresholds for when metrics trigger pricing changes (e.g., if Tier 1 conversion drops below 3% for 2 consecutive quarters, investigate tier design).
Research from Maxio shows that data-driven pricing optimization compounds at approximately 5-8% annual revenue improvement—reaching 25-35% total improvement over five years.
Best Practice 5: Hybrid Approach at Scale
Most successful mature SaaS companies combine:
Base subscriptions for revenue predictability and operational coverage. The base should cover fixed costs and minimum viable support.
Usage components for alignment with value and scale. Usage charges should activate at meaningful consumption levels (not penny charges).
Tiering for different customer segments with varied needs and budgets. Typically 3-5 tiers covering SMB through Enterprise.
Annual discounts for longer-term commitments that improve cash flow and retention. Typical discounts: 15-20% for annual vs. monthly.
The hybrid approach delivers highest growth rates (21% median) while maintaining strong revenue predictability and capital efficiency.
As Tomasz Tunguz notes: "The future of SaaS pricing is hybrid—combining the best elements of multiple models to optimize for both vendor and customer."
Micro-Summary: Implementation success requires transparent communication to reduce friction, strategic tier anchoring using psychological principles, clear upgrade paths minimizing activation barriers, data-driven continuous refinement, and hybrid approaches at scale combining multiple model benefits.
Industry-Specific Pricing Considerations
Different SaaS categories naturally align with specific pricing models based on cost structure, usage patterns, and buyer expectations:
SaaS Infrastructure & APIs
Optimal model: Usage-based or hybrid with usage component
Examples: AWS, Stripe, Snowflake, Twilio
Rationale: Infrastructure costs scale directly with usage. Customers expect pay-for-what-you-use economics. Variable workloads make predictive pricing difficult.
Key metrics: Cost per API call, compute hour, or transaction should align closely with infrastructure costs plus target margin.
Collaboration & Communication Tools
Optimal model: Per-seat or tiered subscription
Examples: Slack, Atlassian, Microsoft Teams
Rationale: Value scales with team size. Network effects increase with user count. Predictable per-seat pricing aligns with HR planning cycles.
Key metrics: Seats deployed, active users, and collaboration activity metrics determine engagement and expansion potential.
Analytics & Reporting Platforms
Optimal model: Usage-based or hybrid with usage component
Examples: Mixpanel, Amplitude, New Relic
Rationale: Data volume and analysis compute vary dramatically by customer. Usage-based pricing accommodates everything from startups to enterprises without friction.
Key metrics: Events tracked, data points analyzed, or queries executed align with infrastructure costs.
CRM & Sales Tools
Optimal model: Tiered subscription or per-seat
Examples: Salesforce, HubSpot, Pipedrive
Rationale: Sales team size determines value and usage. Predictable pricing aligns with sales budgeting. Feature tiers match different sales organization maturity levels.
Key metrics: Contacts managed, deals tracked, and automation sophistication determine tier placement.
HR & Payroll
Optimal model: Per-employee or tiered subscription
Examples: Gusto, BambooHR, Rippling, Trinet
Rationale: HR value scales linearly with employee count. Compliance requirements favor predictable pricing. Budget planning prefers per-employee models.
Key metrics: Employee count, modules activated, and compliance features determine pricing.
Micro-Summary: Industry-specific pricing alignment improves conversion and retention by matching model to cost structure, usage patterns, and buyer expectations—infrastructure favors usage-based, collaboration favors per-seat, and HR favors per-employee approaches.
The Future of SaaS Pricing
AI-Powered Monetization
44% of SaaS companies now charge for AI-powered features, creating new revenue streams. This trend will accelerate as AI capabilities become table-stakes rather than differentiators.
AI features command premium pricing—typically 25-50% above equivalent non-AI functionality—when positioned as productivity multipliers. The key is demonstrating measurable efficiency gains.
As Ben Thompson from Stratechery observes:
"AI monetization represents the first major pricing innovation opportunity since usage-based models emerged."
Increased Hybrid Adoption
Companies using hybrid models report 21% median growth (highest among all models), driving broader adoption. The predictability-flexibility balance appeals to both vendors and customers.
Expect hybrid model adoption to reach 60-70% of B2B SaaS by 2027 as companies recognize the compound benefits of dual revenue streams.
Aggressive Price Increases
SaaS pricing is rising 11.4% annually (4x general market inflation). However, this creates opportunity for disruptive entrants with more reasonable pricing.
The pricing inflation creates vulnerability—customers increasingly evaluate alternatives when facing renewal increases above 10% annually. New entrants can capture market share through aggressive undercutting.
Potential AI Agent Disruption
If AI agents truly automate tasks currently requiring SaaS tools, the entire category pricing could collapse, forcing fundamental pricing model rethinking.
Imagine AI agents that eliminate need for CRM data entry, project management updates, or analytics report generation. Traditional per-seat and feature-based pricing becomes obsolete.
Shift Away from Pure Per-Seat
As AI agents replace discrete human tasks, traditional per-seat pricing faces pressure. Companies will increasingly adopt hybrid or usage-based models to decouple pricing from headcount.
The shift reflects changing value delivery—from "per human using the software" to "per outcome delivered" or "per task automated." Pricing must evolve to capture this new value creation.
Micro-Summary: The future of SaaS pricing includes increased AI feature monetization (44% current adoption), accelerating hybrid model adoption (21% median growth), continued aggressive price increases (11.4% annually), potential AI agent disruption of traditional models, and shift away from pure per-seat toward outcome-based pricing.
Conclusion
Selecting the right pricing model represents one of the highest-leverage decisions in building a SaaS business. Your pricing model should:
Align with your cost structure: Ensure margins improve as you scale rather than compress. Cost-revenue alignment is fundamental to sustainable economics.
Reflect customer value: Customers should see 10x return on investment. This creates sufficient value margin to overcome inertia and competitive alternatives.
Enable clear segmentation: Different segments have different willingness to pay and usage patterns. One-size-fits-all pricing leaves money on the table.
Support your growth stage: Early-stage companies benefit from flexibility and low friction. Mature companies benefit from predictability and efficiency.
Drive the behaviors you want: Pricing influences customer behavior. Design pricing to encourage adoption patterns that create value for both parties.
Whether you choose freemium for rapid market penetration, tiered subscriptions for broad appeal, usage-based pricing for cost alignment, or hybrid models for optimization, the key is treating pricing as a strategic lever worthy of ongoing focus and optimization.
As April Dunford emphasizes:
"Pricing is not a one-time decision—it's an ongoing strategic process that compounds returns over time."
The time invested in getting pricing right directly multiplies into revenue, profitability, and sustainable competitive advantage. Companies that allocate appropriate resources to pricing optimization—through quarterly reviews, continuous testing, and data-driven refinement—consistently outperform those that treat pricing as a set-and-forget decision.
Your pricing model is a statement of your business philosophy, target customer, and growth strategy. Make it deliberate, make it data-driven, and make it dynamic.
Glossary
Activation Friction: The barriers preventing users from experiencing product value, including signup complexity, onboarding steps, and time-to-first-value. Reducing activation friction increases conversion rates.
CAC (Customer Acquisition Cost): The total cost of acquiring a new customer, including marketing spend, sales costs, and onboarding expenses. Calculated as total acquisition costs divided by new customers acquired in a period.
Churn Rate: The percentage of customers who cancel or don't renew their subscriptions in a given period. Annual churn of 5-10% is healthy for B2B SaaS; monthly churn of 3-5% is typical for consumer products.
Cognitive Load: The mental processing effort required to understand pricing, make purchase decisions, or use a product. High cognitive load reduces conversion rates and increases decision fatigue.
Consumption Metrics: Usage-based measurement units like API calls, compute hours, storage consumed, or transactions processed. These metrics determine billing in usage-based pricing models.
Dunning Management: The automated process of recovering failed payments through intelligent retry logic, customer notifications, and grace periods. Effective dunning recovers 40-60% of failed payments.
LTV (Customer Lifetime Value): The total revenue a customer generates over their entire relationship with your company. Calculated as average revenue per customer divided by churn rate, or average monthly revenue × average customer lifespan in months.
Net Revenue Retention (NRR): The percentage of revenue retained from existing customers including expansions, upgrades, downgrades, and churn. NRR above 100% indicates growth via existing customer base. Average for public SaaS companies is 114%.
Price Discrimination: The strategy of charging different prices to different customer segments based on willingness to pay, usage levels, or features needed. Tiered pricing is a form of price discrimination.
Tier Cannibalization: When customers choose lower pricing tiers despite being willing to pay more due to poor tier design, insufficient feature differentiation, or unclear value proposition.
Usage-Based Pricing: A pricing model where customers pay based on actual consumption (API calls, compute hours, storage) rather than flat fees. Also called consumption-based or metered pricing.
Value Metric: The unit that ties price to value delivery—the dimension along which customers experience increasing returns. Examples include seats, transactions processed, contacts managed, or data analyzed.
Willingness to Pay: The maximum amount a customer segment will pay for a product based on perceived value, alternatives available, and budget constraints. Varies significantly by segment and use case.
Unit Economics: The revenue and costs associated with a single customer or unit of business, including CAC, LTV, gross margin, and payback period. Positive unit economics are essential for sustainable growth.
Freemium Conversion Rate: The percentage of free users who convert to paying customers. Industry average is 1%, ideal rates are 2-5%, and top performers like Slack achieve 30%+ through network effects and product-market fit.
Authoritative References
Throughout this guide, insights and data are drawn from the following authoritative institutions and research organizations:
Maxio (SaaS metrics and pricing research)
ProfitWell (pricing optimization and monetization)
Bessemer Venture Partners (SaaS benchmarking)
SBI Growth (revenue growth research)
UserGuiding (conversion optimization)
Stanford University (behavioral research)
Gartner (enterprise technology research)
McKinsey & Company (business strategy)
OpenView Partners (SaaS growth research)
Price Intelligently (pricing validation research)
Harvard Business Review (business strategy)
Paddle (subscription billing research)
ChurnZero (customer success metrics)
SaaStr (SaaS industry analysis)
Zylo (SaaS management research)
WallStreetPrep (financial modeling)
FirstPageSage (marketing analytics)
Unbounce (landing page conversion research)
Stripe (payment processing and growth research)
Alpine Strategic Group (pricing strategy)
GetMonetizely (pricing case studies)
Theory Ventures (SaaS investment research)
Stratechery (technology business analysis)
LTVPlus (customer lifetime value research)
PayPro Global (global payments and localization)
ContSq (marketing optimization research)