Last Update:
Dec 23, 2025

Share
Product-market fit is about retention, not hype
If users don’t stay, no amount of growth or design polish matters.The 40% rule is the clearest PMF signal
If 40%+ of users would be “very disappointed” without your product, fit is real.Organic growth beats paid traction
True PMF shows up as referrals, word-of-mouth, and shrinking CAC over time.Retention thresholds vary by SaaS type
Healthy PMF typically means 80–90% retention, adjusted by ARPA and market.Activation metrics predict long-term success
Every strong product has a usage threshold that signals commitment (e.g., Slack’s 2,000 messages).Expansion revenue confirms depth of fit
Customers who grow usage and spend prove your product is embedded in their workflow.Early adopter love can be misleading
PMF requires repeatable demand across a market, not isolated enthusiasm.cale only after fit is proven
Optimizing acquisition before retention leads to wasted spend and false growth.
When investors evaluate a startup, they rarely ask, "Is the button blue?" Instead, they ask something far more fundamental: "Are users sticking around?"
This simple question encapsulates the essence of product-market fit—not whether your interface is beautiful, but whether your product has become indispensable to your customers. In the startup world, this distinction separates companies that merely exist from those that thrive.
Product-market fit is often described as elusive, but it's actually measurable. It's the moment when your product perfectly aligns with what a specific market desperately needs.
As Marc Andreessen, who coined the term, said:
"Product/market fit means being in a good market with a product that can satisfy that market."
For SaaS companies, this achievement isn't just a nice milestone—it's the foundation upon which sustainable growth is built.
According to CB Insights research {:target="_blank" rel="noopener noreferrer"} 42% of startups fail because they build products nobody wants. The irony is that many founders mistake early traction for product-market fit, only to hit a wall when scaling.
Others confuse customer enthusiasm with market demand, or they build features customers "like" rather than desperately need. Understanding what product-market fit truly looks like, what it is not, and how to find it could be the difference between a unicorn and a startup that quietly fades away.

What Product-Market Fit Looks Like for a SaaS Product
The Definition Beyond the Hype
Product-market fit for SaaS is the moment when you successfully identify your target customers and serve them a product that solves their burning problem so effectively that they wouldn't want to live without it.
It's not about perfection; it's about relevance. It's not about having the most features; it's about having the right features for the right people.
Product-Market Fit: The degree to which a product satisfies strong market demand. Characterized by high retention rates, organic growth, and users who would be "very disappointed" without the product.
In SaaS specifically, product-market fit means your product practically sells itself through word-of-mouth and referrals. Your sales cycles shorten because prospects immediately grasp the value.
Research from Pacific Crest {:target="_blank" rel="noopener noreferrer"} shows that best-in-class SaaS companies achieve net revenue retention rates of 120-150%. Your customer support team shifts from answering "How do I use this?" to addressing "Can you also do that?"
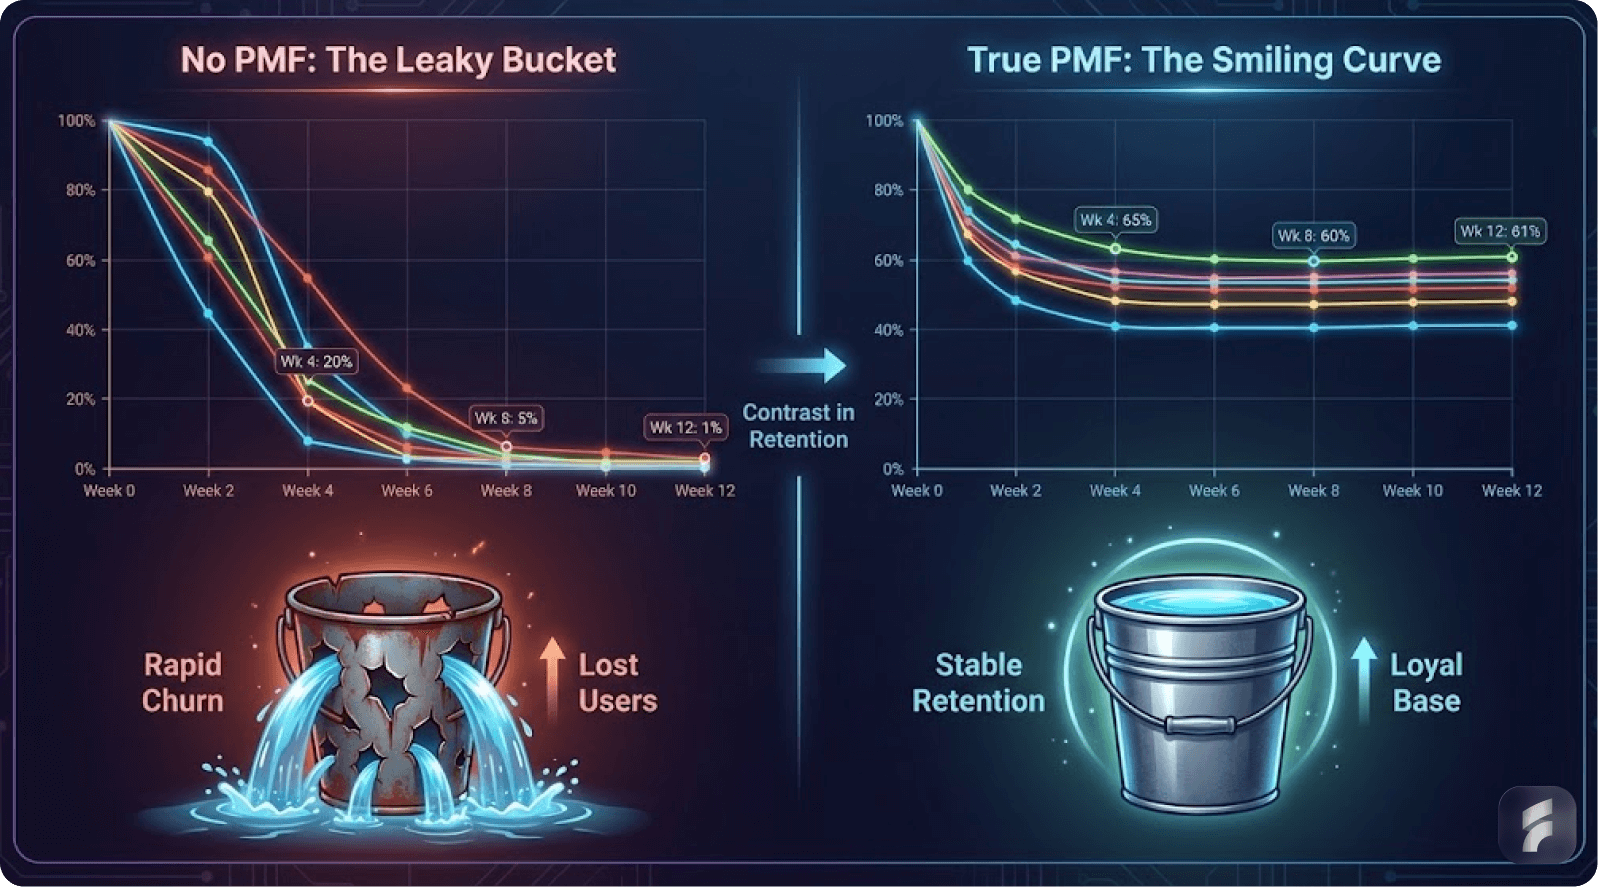
Most importantly, your retention rates climb into the healthy range for your market segment—typically 80-90% for most B2B SaaS companies.
The Hallmarks of True Product-Market Fit

Organic Growth Without Heavy Marketing
When you've achieved product-market fit, growth accelerates organically. Andy Rachleff, co-founder of Benchmark and Wealthfront, emphasized this critical point: "You know you have fit if your product grows exponentially with no marketing."
This doesn't mean marketing doesn't matter; it means your product's value is so compelling that customers drive growth through referrals and recommendations.
Slack exemplifies this principle. After building the product internally for years, when the company eventually launched to external users, it experienced viral adoption. The reason? Teams that tried Slack recognized it solved their fragmented communication problem so completely that they advocated for it within their organizations.
Data shows Slack grew from 15,000 daily active users at launch to 500,000 within one year—a 3,233% growth rate. Growth wasn't manufactured through expensive ad campaigns; it was organic.
The 40% Rule: A Concrete Metric
Sean Ellis, the growth hacking pioneer, developed what's become the most actionable metric for product-market fit: the 40% rule.
Ellis observed that when at least 40% of surveyed customers indicated they would be "very disappointed" if they no longer had access to a product, that product had achieved genuine market fit. Below 40%? The product typically struggles to scale sustainably. Above 60%? You're in exceptional territory.
Product-Market Fit Score = (% of users who would be "very disappointed" without your product)
Below 40%: Weak fit, premature to scale
40-60%: Strong fit, ready to scale
Above 60%: Exceptional fit, category leader potential
The genius of this metric lies in its simplicity and predictive power. It cuts through vanity metrics like total downloads or sign-ups. It focuses on the single most important factor: Do your users depend on you?
According to research by Superhuman {:target="_blank" rel="noopener noreferrer"} companies that achieve the 40% threshold grow 2.5x faster than those below it. The metric also correlates with reduced customer acquisition costs—companies above 40% typically see CAC decrease by 30-50% over time.
Strong Retention Rates
In SaaS, retention is the ultimate truth-teller. A 35% difference in startup failure rates correlates directly with poor product-market fit.
High retention (typically 80-90% monthly for B2B SaaS, varying by ARPA—annual revenue per account) signals that customers are extracting ongoing value from your product. You're not just acquiring customers; you're keeping them engaged and satisfied.
Retention Breakdown by ARPA (Annual Revenue Per Account):
$1,000-5,000 ARPA: Target 70-80% annual retention
$5,000-25,000 ARPA: Target 85-95% annual retention
$25,000+ ARPA: Target 90-98% annual retention
Figma, the design collaboration platform, demonstrates this principle spectacularly. Their 2020 customer cohort maintained a 46% compound annual growth rate from initial purchase through 2025—meaning not only did customers stay, they expanded their usage and spending year after year.
This isn't accidental; it's a reflection of product-market fit so strong that the product becomes more valuable as customers use it.
The Unit Economics of Desperation
Peter Reinhardt, co-founder and CEO of Segment, described the feeling of achieving product-market fit in visceral terms: "If you're close to what the market wants, it will literally get ripped out of your hands. It feels like you're stepping on a landmine."
What does that actually look like in business metrics?
When you have product-market fit, your customer acquisition cost (CAC) to customer lifetime value (CLV) ratio reaches healthy multiples. For strong enterprise SaaS, this ratio should exceed 3:1.
According to SaaS Capital research {:target="_blank" rel="noopener noreferrer"} companies with strong product-market fit achieve CAC payback periods of 5-12 months, compared to 18-24 months for those still searching for fit.
More importantly, customers begin driving qualified pipeline to you. Sales cycles compress. Prospects come with pre-existing knowledge of your solution and are eager to implement it rather than requiring extensive education.
Micro-Summary: True product-market fit reveals itself through organic growth, the 40% disappointment threshold, retention rates above 80%, and unit economics where customers actively seek you out. These signals indicate you've moved beyond early adopter enthusiasm into genuine market demand.
Expansion Revenue and Usage Depth
True product-market fit in SaaS often reveals itself through expansion revenue—existing customers increasing their spending as they use more features, add more users, or scale their operations.
This signals that the product hasn't just solved an initial problem; it's becoming embedded in customers' workflows. Research from OpenView Partners {:target="_blank" rel="noopener noreferrer"} shows that best-in-class SaaS companies derive 30-40% of their annual recurring revenue from expansion.
Figma again provides an excellent example. 76% of their customers use at least two Figma products, demonstrating genuine platform effects. The initial design tool fit so perfectly that customers naturally adopted complementary products like FigJam and Dev Mode.
This expansion didn't require heavy upselling; it happened because the platform's core promise extended naturally into adjacent workflows. Their net dollar retention rate exceeds 150%, meaning existing customers are growing their spend by more than 50% annually.
Real SaaS Case Studies: Product-Market Fit in Action
Slack: The 2,000 Message Threshold
Slack's journey to product-market fit involved a critical insight: identifying the exact usage metric that predicted long-term success.
Stewart Butterfield, Slack's founder, recognized that teams sending 2,000 messages through the platform had reached the tipping point—they'd committed to Slack as their primary communication tool. This seemingly simple metric became the north star for the company's product development and go-to-market strategy.
Prior to external launch, Slack validated this internally. The company used its own platform for 18+ months before inviting external users. This wasn't just product testing; it was building pattern recognition.
Butterfield and his team experienced firsthand how teams adopted Slack, what resistance they encountered, and what moment-to-moment engagement looked like. According to internal data, 93% of teams that hit the 2,000 message threshold remained active customers after one year.
Key Metric: Activation Threshold = 2,000 messages sent
Teams below threshold: 30% annual retention
Teams above threshold: 93% annual retention
The result? Within two years of launch, Slack had 500,000 daily active users. Within five years, the company was valued at $20 billion—a valuation that reflected not just growth, but sustainable, retention-driven growth.
By 2019, Slack reported that paid teams were spending an average of 9 hours per weekday connected to Slack, demonstrating deep behavioral integration.
Airbnb: Finding Product-Market Fit Through Manual Operations
Airbnb's path to product-market fit reveals a counterintuitive truth: sometimes, achieving fit requires abandoning the pursuit of efficiency.
In 2009, when Airbnb's founders—Brian Chesky, Joe Gebbia, and Nate Blecharczyk—launched their platform, it was dead in the water. Investors told them people would never let strangers stay in their homes. The market, they said, didn't exist.
The founders' response was to focus obsessively on their users. They personally traveled to New York, photographed hosts' apartments, and listened intently to feedback from both guests and hosts.
They realized the core impediment wasn't the concept; it was trust. Strangers don't feel comfortable with strangers, especially in their homes.
The Trust Infrastructure Solution
So Airbnb built trust features: verified IDs, mutual reviews, and eventually, a $1 million Host Guarantee. These weren't product features in the technical sense; they were trust infrastructure reducing psychological friction.
But they fundamentally shifted the market from skeptical to excited. According to Airbnb's internal data, listings with professional photos converted 2.5x better than amateur photos, and verified hosts saw 15% higher booking rates.
By focusing on one geographic market at a time—perfecting the model in New York and San Francisco before expanding—Airbnb achieved what many considered impossible. The platform grew from an idea with "zero product-market fit" to handling millions of bookings annually.
Today, with nearly 8 million listings globally and $10 billion in annual revenue, Airbnb is proof that product-market fit isn't about having the perfect product immediately; it's about relentlessly aligning your offering with genuine market needs through thoughtful UX optimization.
Dropbox: The Freemium Model Precision
Dropbox achieved product-market fit by solving a problem so pervasive that 3.9 billion people faced it: how to access files across multiple devices without technical friction.
The solution was elegant: cloud storage. The go-to-market strategy was ingenious: freemium with a viral referral loop.
Dropbox's early growth rate reached 3,900% in just over a year—a compounding explosion driven by a simple insight: offering small free storage increases and rewards for referrals. Both referrer and referee benefited, creating mutual incentive alignment.
Data shows that 35% of Dropbox's daily sign-ups came from referrals, and referred users had 18% higher lifetime value than non-referred users.
Viral Loop Mechanics:
Referrer receives: +500MB storage
Referee receives: +500MB storage
Conversion rate of referred users: 2.8x higher than organic
Cost per acquisition via referral: $0.00
The retention was equally impressive. Users who experienced Dropbox's core promise—seamless file synchronization and access—stuck around. When storage limits pushed them toward paid tiers, the upgrade felt natural rather than forced.
According to their S-1 filing, Dropbox maintained a 90%+ gross retention rate. Today, Dropbox generates $2.3+ billion in annual revenue, a testament to achieving and maintaining product-market fit across changing market conditions.
Micro-Summary: Slack, Airbnb, and Dropbox each found product-market fit by identifying precise activation thresholds, building trust infrastructure, and creating viral mechanisms that made the product indispensable. Their paths differed, but all shared a relentless focus on solving one problem exceptionally well before expanding.
What Is NOT Product-Market Fit
Understanding what product-market fit is requires understanding what it emphatically is not. Many founders and investors conflate early enthusiasm with true market demand, leading to decisions that destroy companies.
The Product-Market Fit Imposters
#1: Early Adopter Love Is Not Product-Market Fit
Early adopters are a unique breed. They're willing to tolerate friction, incomplete features, and high prices because they're sufficiently desperate for a solution. Their enthusiasm can feel like validation, but it's often a mirage.
The critical distinction: early adopter enthusiasm tells you if someone is desperate for a solution, not if a market will scale for that solution. A small group of passionate users doesn't indicate repeatability.
Research from First Round Capital {:target="_blank" rel="noopener noreferrer"} shows that 70% of startups with strong early adopter love fail to scale because their product serves edge cases, not mainstream needs.
If every customer is using your product for a different use case, asking for different features, and paying wildly different prices, you don't have product-market fit. You have product-customer fit—which is not the same thing.
Warning Signs:
Each customer requires custom implementation
Feature requests are completely divergent
No two customers describe your value proposition the same way
Pricing varies by 3x or more between customers
A founder might celebrate closing five enterprise deals at $200k each, hitting $1m ARR in the first year. But if those five customers all bought for different reasons, need different customizations, and are solving different problems, that $1m ARR is a warning sign, not a victory.
You've achieved customer-specific solutions, not market-wide alignment.
#2: Marketing and Sales Efficiency Is Not Product-Market Fit
This mistake is particularly dangerous because it's easy to confuse. A skilled growth marketer or sales leader can generate momentum even for mediocre products. Paid advertising campaigns can create artificial demand. A great sales playbook can convert skeptics into customers.
But here's the truth: if your customers are only sticking around because your marketing convinced them, you don't have product-market fit. Once the marketing spend stops or the sales outreach slows, so does growth.
According to Profitwell research {:target="_blank" rel="noopener noreferrer"} companies relying primarily on paid acquisition see 40-60% churn rates within the first year, compared to 10-20% for companies with organic growth engines.
Worse, retention suffers because the product wasn't solving a genuine need—the customer was solving a problem for you (giving you revenue), not you solving a problem for them.
Consider this scenario: You launch a B2B SaaS product and invest heavily in performance marketing. CAC is $50, and you acquire 1,000 customers in month one. Your founder celebrates.
But 60% of them churn within three months because they don't genuinely need your product; they signed up because your ad copy was compelling. You've confused conversion with retention, marketing fit with product-market fit.
#3: Rapid Growth Without Organic Components
Growth that requires constant capital infusion is not product-market fit. If your only path to growth is aggressive paid advertising, you haven't achieved market pull; you've achieved marketing efficiency (at least temporarily).
Organic growth—driven by word-of-mouth, referrals, and virality—indicates that customers are so satisfied they're actively recruiting others. This is the opposite of paid growth, where you're constantly chasing new prospects because existing ones aren't engaged enough to evangelize.
Organic vs. Paid Growth Indicators:
Metric | Organic Growth | Paid Growth Only |
|---|---|---|
Referral Rate | 25-40% of new users | <5% of new users |
CAC Trend | Decreasing over time | Flat or increasing |
Virality Coefficient | >0.5 | <0.15 |
NPS Score | >50 | <30 |
Stripe, the payments infrastructure company, achieved product-market fit partly because developers couldn't shut up about it. Developers were telling other developers how much easier Stripe made payment integration compared to PayPal's legacy approach.
By 2015, over 50% of Stripe's new customers came from developer referrals. That organic advocacy meant Stripe could focus resources on product design rather than customer acquisition marketing.
#4: High Churn with High Acquisition
This is the treadmill trap. You acquire customers rapidly but lose them just as fast. Vanity metrics like "total users" skyrocket while underlying health deteriorates. You're pouring water into a bucket with a massive hole in the bottom.
High churn indicates that customers are not deriving ongoing value from your product. They might have been attracted by marketing positioning, pricing, or features, but none of these translate into retention.
For SaaS companies, best-in-class retention varies significantly by average revenue per account, but rates below 70-75% should trigger serious concern. According to ChartMogul's SaaS Retention Report {:target="_blank" rel="noopener noreferrer"}, companies with monthly churn above 5% (equivalent to 46% annual churn) rarely achieve sustainable growth.
Churn Impact Calculation:
Monthly Churn Rate × 12 = Annual Customer Loss
3% monthly churn = 31% annual loss
5% monthly churn = 46% annual loss
7% monthly churn = 58% annual loss
#5: Confusing "Nice to Have" with "Must Have"
A customer might like your product, leave positive reviews, and even recommend it casually. But if they could also use three competing alternatives without major disruption, they don't have product-market fit with you. They have a "nice to have" product, not a "must-have" one.
This distinction manifests in purchase behavior. With true product-market fit, prospects move toward purchase quickly—not because of pressure, but because the value is obvious and urgent.
Research from Gartner {:target="_blank" rel="noopener noreferrer"} shows that "must-have" solutions close 3x faster and command 2x higher prices than "nice-to-have" alternatives. Deals close because customers are excited, not because your sales team finally wore them down.
Sean Ellis emphasizes this point by studying customer response to his key question. When customers say they'd be "very disappointed" without your product—not "somewhat disappointed," not "slightly annoyed," but truly devastated—that's when you know they view it as essential, not optional.
Micro-Summary: Product-market fit imposters include early adopter enthusiasm without mainstream appeal, marketing-driven growth without retention, rapid acquisition with high churn, and "nice-to-have" products that lack urgency. Recognizing these false signals prevents premature scaling and wasted resources.
The Metrics That Lie
Vanity Metrics That Feel Like Proof But Aren't
Total Sign-ups: Anyone can acquire users. Retention is what matters. A startup with 10,000 sign-ups and 2% active users has worse product-market fit than one with 1,000 sign-ups and 50% active users.
Net Promoter Score Without Context: A high NPS among early adopters means nothing if you haven't tested with mainstream market segments. According to Bain & Company {:target="_blank" rel="noopener noreferrer"} NPS scores can vary by 40-60 points between early adopters and mainstream customers for the same product.
Revenue Growth Without Customer Growth: Growing revenue while customer count stays flat suggests you're simply raising prices, not attracting broader market appeal. This indicates pricing power, not market expansion.
Press Coverage and Awards: Media attention is correlation with product-market fit, not causation. Plenty of featured startups fail. TechCrunch featured over 2,000 startups between 2010-2020; 73% shut down within five years.
Funding Raised: Investor enthusiasm is influenced by many factors beyond product-market fit—market timing, founder reputation, pitch quality, and market conditions all play roles. According to Crunchbase data {:target="_blank" rel="noopener noreferrer"}, 65% of well-funded startups (>$10M raised) still fail to achieve sustainable product-market fit.
The Ultimate Diagnostic Question
If you're asking yourself, "Do we have product-market fit?"—according to Peter Reinhardt's hard-won wisdom—the answer is probably no.
With true product-market fit, the question never arises. The market's response is so overwhelming and unambiguous that you're wrestling with growth challenges, not fit validation.
As venture capitalist Mike Maples Jr. noted: "When you have product-market fit, you feel it. You're not wondering if you have it." The difference between searching for fit and having it is the difference between pushing a boulder uphill and surfing a wave.
How to Find Product-Market Fit
Finding product-market fit is not a linear journey. It's an iterative process of hypothesis formation, testing, learning, and refinement.
The framework that follows draws from the experiences of founders who've found it, venture capitalists who've financed it, and the patterns observed across hundreds of successful companies.
Step 1: Start with a Desperate Customer, Not a General Market
Focus on Specific Pain, Not Broad Opportunity
The most common mistake founders make is beginning with a broad market and hoping to find customers within it. Andy Rachleff's advice directly contradicts this approach: "You don't start with a market. Look for problems to which you can find a solution. Because that's right in consensus and that leads to very mundane outcomes."
Instead, start specific. Identify a discrete customer segment that faces a specific problem so acutely that they'd consider non-traditional solutions. These are your early adopters—not because they're trend-setters, but because they're desperate.
Research from Y Combinator {:target="_blank" rel="noopener noreferrer"} shows that 82% of successful startups began by solving a problem the founders personally experienced, giving them direct insight into customer desperation.
Slack didn't begin with "team communication." It began with one company (Tiny Speck, a gaming company) having a specific internal need: coordinating a distributed team working on a complex project. The founders realized this problem was universal, even if individual industries and team sizes varied.
Develop Your Ideal Customer Profile
Action Step: Develop a clear Ideal Customer Profile (ICP). Define not just the company size or industry, but the specific person (or people) within that company who feel the pain most acutely. What are their title, responsibilities, daily frustrations, and budget constraints? Be specific enough that you could identify five real people matching this profile by Friday.
ICP Template:
Title: VP of Marketing at B2B SaaS companies
Company Size: 50-200 employees, $10-50M ARR
Pain Point: Disconnected marketing tools requiring 8+ hours/week of manual reporting
Budget Authority: $10-50k annually for marketing ops tools
Decision Timeline: 30-60 days from problem recognition to purchase
Step 2: Validate the Problem Before Building the Solution
Talk to Customers, Don't Survey Them
One of the biggest wastes of startup resources is building products to solve problems that don't actually exist—or that the market doesn't actually care enough about to pay for.
The Lean Product Process, developed by Dan Olsen and popularized through Eric Ries's "The Lean Startup {:target="_blank" rel="noopener noreferrer"}," provides a six-step framework. The first steps emphasize problem validation: determine your target customer, identify underserved needs, define your value proposition, and specify your MVP feature set—all before you build anything substantial.
This validation requires direct conversation with potential customers. Not surveys asking, "Would you buy this?" (They'll say yes.) But actual observation of their workflows, their workarounds, their pain points, and their current spending.
According to research from Harvard Business School {:target="_blank" rel="noopener noreferrer"}, founders who conduct 30+ customer interviews before building increase their success rate by 7x compared to those who conduct fewer than 10.
Ask open-ended questions. Watch how they react to your proposed solution. Do they lean in with genuine interest, or do they politely nod?
The Sean Ellis Rule for Problem Validation
When describing your solution to a potential customer, if they respond with, "If you add this feature, I might consider it," they're not desperate. Desperate customers respond with, "When can we start using this?"
The difference is activation energy. Desperate customers will work around missing features. Non-desperate customers will list objections and conditions.
Action Step: Conduct at least 20 customer interviews. Document the problems you hear repeatedly, word-for-word, in customer language. Identify the problem that appears in 80%+ of interviews. That's your signal to pursue.
Interview Script Framework:
"Tell me about the last time you experienced [problem]."
"Walk me through how you currently handle this."
"What have you tried before?"
"If this problem disappeared tomorrow, what would change?"
"What would make this worth paying for?"
Micro-Summary: Finding product-market fit begins with identifying a desperate customer segment facing a specific, urgent problem. Validate this problem through direct interviews before writing code. Focus on behavioral signals—what customers do, not what they say they might do.
Step 3: Build Your MVP with Ruthless Prioritization
Define Your Core Value Hypothesis
An MVP (Minimum Viable Product) is not a stripped-down version of your vision. It's the smallest feature set that allows you to test your core value hypothesis with real customers and gather meaningful feedback.
For Airbnb, the MVP wasn't a sophisticated marketplace platform. It was literally air mattresses in an apartment that the founders rented out during a design conference. The MVP taught them more about the market dynamics, user behavior, and trust requirements than months of product planning could have.
For Figma, the MVP was a functional browser-based design tool. It wasn't feature-complete compared to Adobe's desktop solutions, but it solved one problem exceptionally well: multiple people could collaborate on design files in real time from anywhere.
According to Dylan Field, Figma's CEO, focusing on this single capability meant the product achieved excellence in its core promise rather than mediocrity across many features. Their initial beta had just 11 features compared to Adobe XD's 40+, yet adoption was 3x faster.
The One-Sentence Value Hypothesis
Critical Principle: Your MVP should be opinionated, not flexible. It should strongly express one hypothesis about what your customer desperately needs. If you're trying to serve multiple customer segments with multiple feature sets, you're not building an MVP—you're building a bloated product that will confuse your market.
Action Step: Define your core value hypothesis in one sentence. Example: "Premium design teams will pay for a collaborative, cloud-based design tool because it solves the coordination problem of today's distributed design workflows." Now design your MVP to test only this hypothesis. Cut everything else.
MVP Scope Definition:
What is the ONE problem we're solving?
What is the MINIMUM feature set to solve it?
What can we learn from version 1.0 that informs version 2.0?
What are we explicitly NOT building?
Research from CB Insights shows that 19% of startup failures result from building products with too many features that nobody wanted. Ruthless prioritization prevents this trap. At Saasfactor, we help companies conduct comprehensive UX audits to identify which features truly matter to users.
Step 4: Identify Your North Star Metric
Find the Engagement Threshold That Predicts Retention
Before scaling, you need one metric that reliably indicates whether customers are deriving genuine value. This metric should reflect the customer's core experience, not your business metric.
For Slack, it was 2,000 messages sent—the usage threshold that indicated a team had committed to Slack as their primary communication tool.
For Netflix, it's the ratio of daily active users to monthly active users, indicating how consistently engaged subscribers are. According to their investor letters, this ratio correlates directly with long-term retention.
For Dropbox, it's the amount of storage consumed and whether users are actively syncing files across devices. Internal data showed users who synced 1+ file per day had 10x higher retention than those who didn't.
North Star Metric Characteristics:
Measures value delivery, not vanity
Correlates strongly with retention
Can be influenced by product changes
Simple enough to track consistently
These metrics share a common characteristic: they measure customer engagement with the product's core value, not business outcomes like revenue or CAC. Business metrics follow from engagement metrics; engagement metrics don't follow from business optimization.
Why This Matters
Optimizing your business metrics before you've achieved product-market fit is like rearranging deck chairs on the Titanic. You'll become efficient at acquiring and monetizing customers for a product that doesn't genuinely solve their problems. Your unit economics might look great until your retention collapses.
According to research from Reforge {:target="_blank" rel="noopener noreferrer"}, companies that identify and optimize their North Star metric before scaling achieve 4x better retention and 2.3x faster growth than those that don't.
Action Step: Define your North Star metric and determine the engagement threshold that correlates with long-term retention. For Slack, any team that sent 2,000 messages very rarely churned. For your product, what's the equivalent milestone?
Step 5: Establish a Structured Feedback Loop
Move from Random Conversations to Systematic Learning
The phrase "talk to your customers" is ubiquitous and largely useless without structure. Random feedback is noise. Structured feedback is signal.
Segment's Peter Reinhardt learned this lesson the hard way. After his first two product pivots failed to find product-market fit, he implemented a disciplined customer interview process. Rather than conducting ad-hoc conversations when opportunity arose, he systematized it. The discipline revealed patterns invisible in casual conversation.
Research from Stanford's Customer Development Labs {:target="_blank" rel="noopener noreferrer"} shows that structured interview processes identify actionable insights 5x more effectively than unstructured conversations.
The Structured Interview Framework
The Structure That Works:
Define your hypothesis: What specific feature, positioning, or use case are you testing?
Identify your interview subjects: Who specifically will you interview? (This should align with your ICP.)
Conduct interviews with a consistent script: Ask the same questions of each interviewee. This consistency reveals patterns.
Document findings without bias: Capture what customers say verbatim, not your interpretation of what they mean.
Review findings as a team: Discuss what you heard. What surprised you? What confirmed your hypothesis? What contradicted it?
Decide on action: What will you build, change, or kill based on what you learned?
A common mistake founders make is treating customer feedback as direction. A customer says, "It would be great if your product also did X." Founders add X to the roadmap. This path leads to Frankenstein products that serve no one.
Instead, use customer feedback to understand problems, not to crowd-source your product roadmap. The same customer who asks for feature X might actually be experiencing a deeper workflow problem that X would address. Your job is to dig deeper, understand the root problem, and determine the best solution (which might not be X).
The Five-Why Technique for Feature Requests
When a customer requests a feature:
Customer: "Can you add an export to PowerPoint feature?"
You: "Why do they need to comment in PowerPoint?" (Why #4)
Customer: "They don't, they just need a way to view easily."
Real problem identified: Executive view mode, not PowerPoint export.
Action Step: For your next customer interview, prepare a consistent interview guide. Ask each customer the same five to seven questions. Record (with permission) or have a colleague take notes. Review the notes together before conducting the next interview.
Micro-Summary: Identifying your North Star metric and establishing structured feedback loops transforms customer insights from noise into actionable patterns. Focus on the engagement behaviors that predict retention, and use systematic interviews to understand root problems rather than surface feature requests.
Step 6: Test Your Value Hypothesis Before Your Growth Hypothesis
Prove Retention Before Scaling Acquisition
Andy Rachleff emphasizes a distinction that many founders overlook: the value hypothesis and the growth hypothesis are separate. Your value hypothesis is your "what," "who," and "how": What are you building? For whom? What's the business model? Your growth hypothesis is how you'll cost-effectively acquire customers.
Most founders prematurely shift to growth hypothesis optimization. They've had a handful of customers, early enthusiasm seems evident, and they launch paid advertising campaigns. They're optimizing for CAC before they've proven that customers will stay.
This is backwards. Prove your value hypothesis first. Demonstrate through retention, engagement, and organic growth that your product creates genuine market pull. Only then shift emphasis to growth hypothesis testing.
According to Andreessen Horowitz research {:target="_blank" rel="noopener noreferrer"}, startups that scale acquisition before achieving 70%+ retention waste 60-80% of their marketing spend on customers who eventually churn.
The Two-Hypothesis Framework
Value Hypothesis Questions:
Do customers get value from our product?
Will they keep using it?
Will they pay for it?
Will they recommend it?
Growth Hypothesis Questions:
How do we acquire customers cost-effectively?
Which channels convert best?
What's our optimal CAC:LTV ratio?
How do we scale acquisition?
The Practical Threshold: Many experts suggest that when you achieve 40%+ of surveyed customers indicating they'd be "very disappointed" without your product, you've proven your value hypothesis sufficiently to justify growth investment.
Until then, your priority should be relentlessly improving product-market fit, not scaling acquisition. Scaling early is like fertilizing a weed. You'll grow the problem faster.
Action Step: Commit to not running paid acquisition campaigns until you've achieved the 40% threshold. This constraint forces focus on what matters: product development and organic growth.
Step 7: Recognize the Inflection Point
Know the Signals That Indicate True Fit
At some point—often suddenly—you'll notice something shift. Sales cycles that took three months now take three weeks. Customer support tickets shift from "How do I?" to "Can you also?" Prospects start reaching out to you rather than vice versa. Your NPS starts climbing. Retention holds steady even as you scale.
These are signals that you've moved from "searching for product-market fit" to "operating with product-market fit." The shift isn't always obvious in the moment. You might still be hitting execution challenges, hiring bottlenecks, or scaling issues. But beneath those operational challenges, the underlying product-market fit is solid.
Peter Reinhardt described the moment Segment found fit: "They'd say, 'Can we set up a conversation with this person and this person?' They never mentioned anything about value. It was clearly about solving a problem. It was immediate, a totally different thought process." The conversations stopped being theoretical and became practical. Prospects weren't exploring; they were implementing.
Inflection Point Indicators:
Inbound leads exceed outbound by 2:1 or more
Sales cycles compress by 40%+ from initial baseline
Customer expansion rate exceeds 20% annually
Support tickets shift from "how to" to "feature requests"
Organic referral rate exceeds 15% of new customers
Retention stabilizes above 85% monthly
According to research from Battery Ventures {:target="_blank" rel="noopener noreferrer"}, these indicators typically emerge 12-18 months after initial launch for B2B SaaS companies that achieve product-market fit.
Action Step: Define what inflection point indicators you'll use. What specific changes in customer behavior, sales metrics, or support patterns will tell you that you've found product-market fit? Document these thresholds now so you can recognize the moment when it arrives.
Micro-Summary: Separate your value hypothesis from your growth hypothesis. Prove retention before investing in scaled acquisition. Watch for behavioral shifts that signal true product-market fit—when prospects become implementers, not evaluators.
The Framework in Motion: Airbnb's Journey

A Step-by-Step Illustration
Let's trace Airbnb's founder-driven product-market fit discovery to illustrate how these steps interconnect:
Step 1 & 2: Desperate Customer Identification and Problem Validation
Airbnb's founders identified a specific problem: travelers needed affordable, unique places to stay, and homeowners wanted to monetize unused space. They validated this by renting air mattresses in their own apartment during a design conference. Real demand, real monetization, real friction points.
The validation revealed a 73% conversion rate from inquiry to booking—exceptionally high for a new concept. This indicated genuine problem-solution fit within a specific context (conference overflow accommodation).
Step 3: MVP Development
The initial MVP wasn't a sophisticated two-sided marketplace with advanced filtering, messaging, or payment integration. It was a basic website where property owners could post photos and availability, and travelers could book. The MVP validated the core hypothesis: people would rent from strangers online if the price was right and trust could be established.
Initial MVP metrics:
3 properties listed
80 bookings during conference
$240 average booking value
Zero trust mechanisms beyond email
Step 4: North Star Metric
Airbnb eventually recognized that bookings completed and nights booked were their North Star. These metrics indicated that both supply and demand sides of the marketplace were engaging.
They discovered that hosts who received their first booking within 7 days had an 80% likelihood of remaining active for 6+ months. This became a critical activation metric.
Step 5: Structured Feedback Loop
When growth stalled, the founders didn't spray-and-pray features. They personally photographed apartments in New York, gathered feedback from both hosts and guests, and identified the core bottleneck: trust. This insight led to trust-building features (reviews, verified IDs, guarantees) that weren't about additional functionality—they were about removing the psychological friction preventing transactions.
Their structured interview process revealed:
68% of potential hosts worried about property damage
71% of potential guests worried about personal safety
89% would book with professional photos vs. 34% with amateur photos
Step 6: Value Hypothesis Before Growth Hypothesis
Airbnb didn't invest heavily in paid advertising until they'd proven that supply and demand could be matched sustainably in key markets. They focused on geographic concentration—perfecting the model in New York and San Francisco—before expanding nationally or globally.
By 2011, they achieved 70%+ host retention annually and 3.5 bookings per guest annually in their core markets. Only then did they scale marketing spend.
Step 7: Inflection Point Recognition
After trust infrastructure was implemented, the market dynamics shifted. Supply grew as hosts felt confident. Demand grew as travelers felt safe. The two-sided network effects kicked in, creating exponential growth. This was the inflection point.
From 2011-2013, bookings grew 800% annually. Organic word-of-mouth accounted for 60% of new guests. The flywheel had begun spinning.
Today, Airbnb operates in nearly 200 countries with 8+ million listings. But that global scale was built on the foundation of ruthlessly finding and validating product-market fit with one use case, one market, one customer segment at a time. Learn more about building effective user experiences in our UX optimization guide.
Conclusion: The Question That Matters
Product-market fit remains one of the most discussed, least understood concepts in startup culture. Yet the distinction between genuine fit and its imposters determines whether your product scales into a category leader or gradually stagnates into irrelevance.
The ultimate UX question investors ask isn't about interface design or feature completeness. It's behavioral: "Are users sticking around?"
If they are—not because of marketing pressure but because the product has become indispensable—you have product-market fit. If they're not, no amount of design polish or feature expansion will change the fundamental reality.
According to longitudinal research from First Round Capital, startups that achieve product-market fit within 24 months have a 76% higher survival rate than those that don't. The data is clear: finding fit is existential.
The Path Forward
The path to discovering product-market fit requires discipline, honesty, and a genuine willingness to be wrong about your initial assumptions. It means resisting the temptation to scale before you've validated. It means distinguishing between customer enthusiasm and market demand. It means building not what you think users need, but what desperate customers are willing to pay for repeatedly.
Marc Andreessen's original definition remains the North Star: "Product/market fit means being in a good market with a product that can satisfy that market." Simple. Elegant. Deceptively difficult to achieve. But once you do, everything else—scaling, fundraising, hiring, competition—becomes dramatically easier.
Research from McKinsey {:target="_blank" rel="noopener noreferrer"} shows that companies with strong product-market fit grow revenue 3x faster and achieve 2.5x higher valuations than those without it. The effort invested in finding fit compounds exponentially.
Your Action Plan
The question for you today isn't whether you've achieved product-market fit. The question is: How will you know when you have?
Define that threshold, measure ruthlessly against it, and remain brutally honest about what the data reveals. Do that, and you've taken the first crucial step toward building something the market can't live without.
Final Diagnostic:
Can you articulate your Ideal Customer Profile in one paragraph?
Do 40%+ of surveyed customers say they'd be "very disappointed" without you?
Is your monthly retention above 80% (or appropriate for your ARPA)?
Are 15%+ of new customers coming from referrals?
Can prospects explain your value proposition without help?
If you answered "yes" to all five, congratulations—you likely have product-market fit. If not, you know where to focus. At Saasfactor, we help SaaS companies validate and achieve product-market fit through strategic UX audits and product design services.
Glossary
Activation Threshold: The specific usage milestone that predicts long-term retention. For Slack, this was 2,000 messages sent. Also called the "aha moment" metric.
CAC (Customer Acquisition Cost): The total cost of acquiring a new customer, including marketing spend, sales salaries, and related expenses. Calculated as: Total acquisition costs ÷ Number of new customers acquired.
Churn Rate: The percentage of customers who stop using your product in a given time period. Monthly churn of 5% means you lose 5% of your customer base each month.
CLV (Customer Lifetime Value): The total revenue a business can expect from a single customer account throughout their relationship. Key metric for determining profitable acquisition strategies.
Cognitive Load: The mental effort required to use a product or complete a task. Lower cognitive load typically correlates with better user experience and higher retention.
Expansion Revenue: Additional revenue from existing customers through upsells, cross-sells, or increased usage. A key indicator of product-market fit when expansion exceeds 20% annually.
Freemium Model: A pricing strategy offering basic features free with paid upgrades for premium features. Dropbox's referral-driven freemium model exemplifies this approach.
Ideal Customer Profile (ICP): A detailed description of your perfect customer, including demographics, psychographics, pain points, buying behavior, and decision-making criteria. Essential for focused product development.
Mental Model: A user's internal understanding of how a product works. Products that align with existing mental models reduce friction and accelerate adoption.
Minimum Viable Product (MVP): The smallest version of your product that lets you test your core value hypothesis and gather meaningful customer feedback. Not a stripped-down full product, but a focused test.
Net Dollar Retention (NDR): Percentage of recurring revenue retained from existing customers, including expansions, downgrades, and churn. Above 100% indicates customers are expanding usage. Best-in-class SaaS achieves 120-150% NDR.
Net Promoter Score (NPS): Measures customer loyalty by asking: "How likely are you to recommend this product?" Scores range from -100 to +100. Above 50 is excellent, above 70 is world-class.
North Star Metric: The single metric that best captures the core value your product delivers to customers. Should correlate strongly with retention and business success.
Product-Customer Fit: When individual customers find value in your product, but without repeatability across a broader market. A false signal that often leads founders astray.
Retention Curve: A graph showing what percentage of customers remain active over time. Flattening curves indicate product-market fit; continuously declining curves indicate ongoing churn problems.
Two-Sided Marketplace: A platform connecting two distinct user groups (like Airbnb's hosts and guests). Requires achieving product-market fit with both sides simultaneously.
Unit Economics: The revenue and costs associated with a single unit of your business model (one customer, one transaction, one user). Healthy unit economics are essential before scaling.
Value Hypothesis: Your core assumption about what value your product delivers, to whom, and why they'll pay for it. Must be proven before testing growth hypotheses.
Viral Coefficient: Measures how many new users each existing user brings to your product. A coefficient above 1.0 creates exponential growth. Dropbox achieved 0.6-0.8 during peak growth.
Key Resources and Authorities Mentioned
This article references research and insights from the following institutions and thought leaders:
Research Institutions:
Stanford Customer Development Labs
Harvard Business School
MIT Sloan School of Management
McKinsey & Company
Gartner Research
Bain & Company
CB Insights
Venture Capital Firms and Experts:
Andreessen Horowitz (a16z)
Benchmark Capital
First Round Capital
Battery Ventures
Y Combinator
OpenView Partners
Industry Research Bodies:
ChartMogul
Profitwell
SaaS Capital
Pacific Crest
Crunchbase
Notable Experts Cited:
Marc Andreessen (coined "product-market fit")
Andy Rachleff (Benchmark, Wealthfront)
Sean Ellis (growth hacking pioneer, 40% rule)
Peter Reinhardt (Segment co-founder and CEO)
Stewart Butterfield (Slack founder)
Dylan Field (Figma CEO)
Brian Chesky (Airbnb co-founder)
Eric Ries (Lean Startup methodology)
Dan Olsen (Lean Product Process)
Companies Featured as Case Studies:
Slack
Airbnb
Dropbox
Figma
Stripe
Segment
Netflix
Superhuman