


Last Update:
Table of Contents
No headings found in Blog Content.
Share

Misalignment = Missed Revenue
Siloed product, marketing, and sales teams cause 67% more lost deals, $400K annual waste per $1.2M ARR, and 44-day longer sales cycles.Framework 1: Unified Revenue Metrics
Align teams using three core KPIs—pipeline velocity, MQL-to-SQL conversion, and expansion revenue. Companies using this see sales cycles drop from 72 to 38 days and conversions rise from 18% to 41%.Framework 2: Product-Sales Enablement Flywheel
Reverse the "build-then-sell" model. Use deal desks and pre-sell validation to prioritize features. UserGems improved close rates by 52% and feature adoption from 12% to 67% through this system.Framework 3: Launch Alignment Operating System
Execute coordinated 90-day launch timelines spanning planning, enablement, and post-launch reviews. Companies like FlawlessInbound cut sales cycles by 28% and boosted pipeline by 42%.Framework 4: Customer Journey Scorecard
Replace siloed KPIs with a unified 100-point scorecard across awareness, consideration, decision, and expansion. This drives 3x faster pipeline velocity and 41% conversion by making every team accountable for every stage.90-Day Revenue Alignment Roadmap
Implement alignment in three phases: Metric foundation (Weeks 1–2), System development (Weeks 3–6), Execution & optimization (Weeks 7–12), with measurable benchmarks for success.Common Pitfalls to Avoid
Lack of executive buy-in, misaligned incentives, and fragmented tech stacks undermine alignment. Tie compensation to shared metrics and integrate tools across departments.
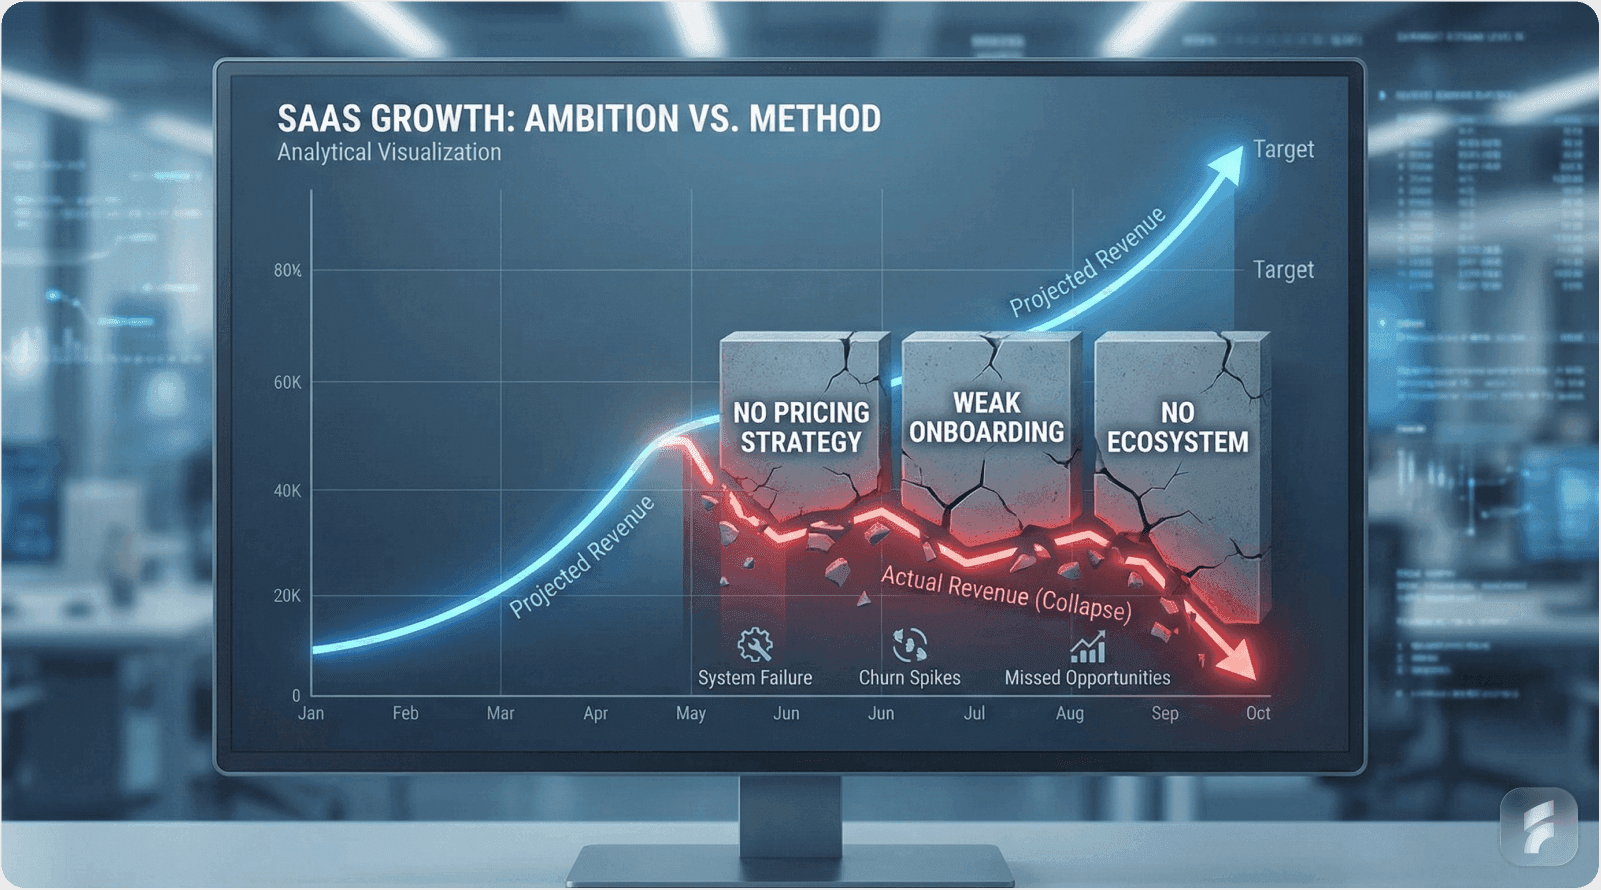
SaaS companies with misaligned teams lose 67% more deals despite having identical products and pricing. The gap isn't capability—it's coordination. When product, marketing, and sales operate as independent units, pipeline leaks, sales cycles stretch, and revenue becomes unpredictable.
This comprehensive guide delivers four proven frameworks, current market data from 2025-2026, expert insights from CROs and product leaders, three detailed case studies, and over 45 actionable steps. By implementing these systems, your teams will operate as a unified revenue engine rather than competing departments.
Understanding the Revenue Alignment Crisis
The Core Dysfunction
Product teams build features nobody purchases. Marketing generates leads sales teams reject as unqualified. Sales promises capabilities product cannot deliver. This pattern repeats across thousands of B2B SaaS companies, creating predictable failure modes.
The financial damage compounds quickly. Companies achieving $1.2 million in annual recurring revenue waste approximately $400,000 annually on misaligned pipeline activities. This represents one-third of potential revenue lost to internal friction rather than market competition.
Common Misalignment Patterns:
Product teams ship AI analytics capabilities and question why adoption remains minimal. Marketing celebrates generating 500 sales-qualified leads monthly. Sales responds that none match ideal customer profiles and questions marketing's targeting criteria again.
These conversations repeat weekly across Slack channels and status meetings without resolution.
Quantifying the Alignment Gap
Performance Impact Statistics:
Research analyzing thousands of B2B SaaS companies reveals stark performance differences. Siloed teams demonstrate 67% lower close rates compared to aligned organizations. Sales cycles extend by an average of 44 days when handoffs between teams create friction points.
Organizations implementing systematic alignment protocols reduce sales cycles by 28% within 90 days. MQL-to-SQL conversion rates improve from industry average 15% to best-in-class 42% when teams optimize for shared outcomes rather than departmental metrics.
Pipeline velocity increases 20% when marketing, product design, and sales operate from unified customer intelligence. This acceleration compounds over time as teams develop shared mental models and communication patterns.
The Revenue Operations Gap
"SaaS revenue dies in the handoff gaps. Product-sales alignment isn't collaboration theater—it's a single revenue operating system where marketing feeds product intelligence to sales execution."
— Tam Monroe, B2B SaaS Alignment Strategist, 2024
Traditional organizational structures create natural silos. Product reports to engineering leadership focused on technical debt and feature velocity. Marketing reports to CMOs measured on lead volume and brand metrics. Sales reports to CROs evaluated on closed revenue and quota attainment.
These reporting structures create competing incentives that undermine revenue generation. Effective UX optimization can help bridge these gaps by ensuring product features align with actual customer needs.
Financial Consequences:
Misalignment manifests as 42% lower win rates in competitive deals. Companies lose opportunities not because competitors offer superior products but because internal teams cannot present coherent value propositions or execute coordinated sales motions.
Sales cycle elongation costs real money. Each additional week in pipeline represents delayed revenue recognition, increased customer acquisition costs, and reduced sales capacity. At scale, these inefficiencies determine whether companies hit growth targets or miss quarters.
Expert Analysis on Coordination Failure
The fundamental problem lies in metric design rather than talent or effort. When product optimizes for feature shipping velocity, marketing for lead generation volume, and sales for individual deal closure, the organization lacks shared success criteria.
This creates perverse incentives where each function can report success while overall revenue performance deteriorates. Marketing hits lead targets with low-quality prospects. Product ships features users don't adopt. Sales closes deals requiring custom work product cannot support.
Micro-Summary: Revenue alignment failure costs B2B SaaS companies 67% of potential deals and extends sales cycles by 44 days on average. The dysfunction stems from competing departmental metrics rather than talent deficits. Organizations waste $400,000+ annually at $1.2M ARR through misaligned activities. Systematic alignment protocols reduce cycles 28% and improve conversion 42% within 90 days by implementing shared metrics and coordinated processes.
Framework 1: Implementing Unified Revenue Metrics
The Single Source of Truth Approach
Revenue operations require abandoning departmental vanity metrics in favor of shared key performance indicators every team optimizes collectively. This represents fundamental organizational redesign rather than incremental improvement.
Unified Revenue Dashboard Structure:
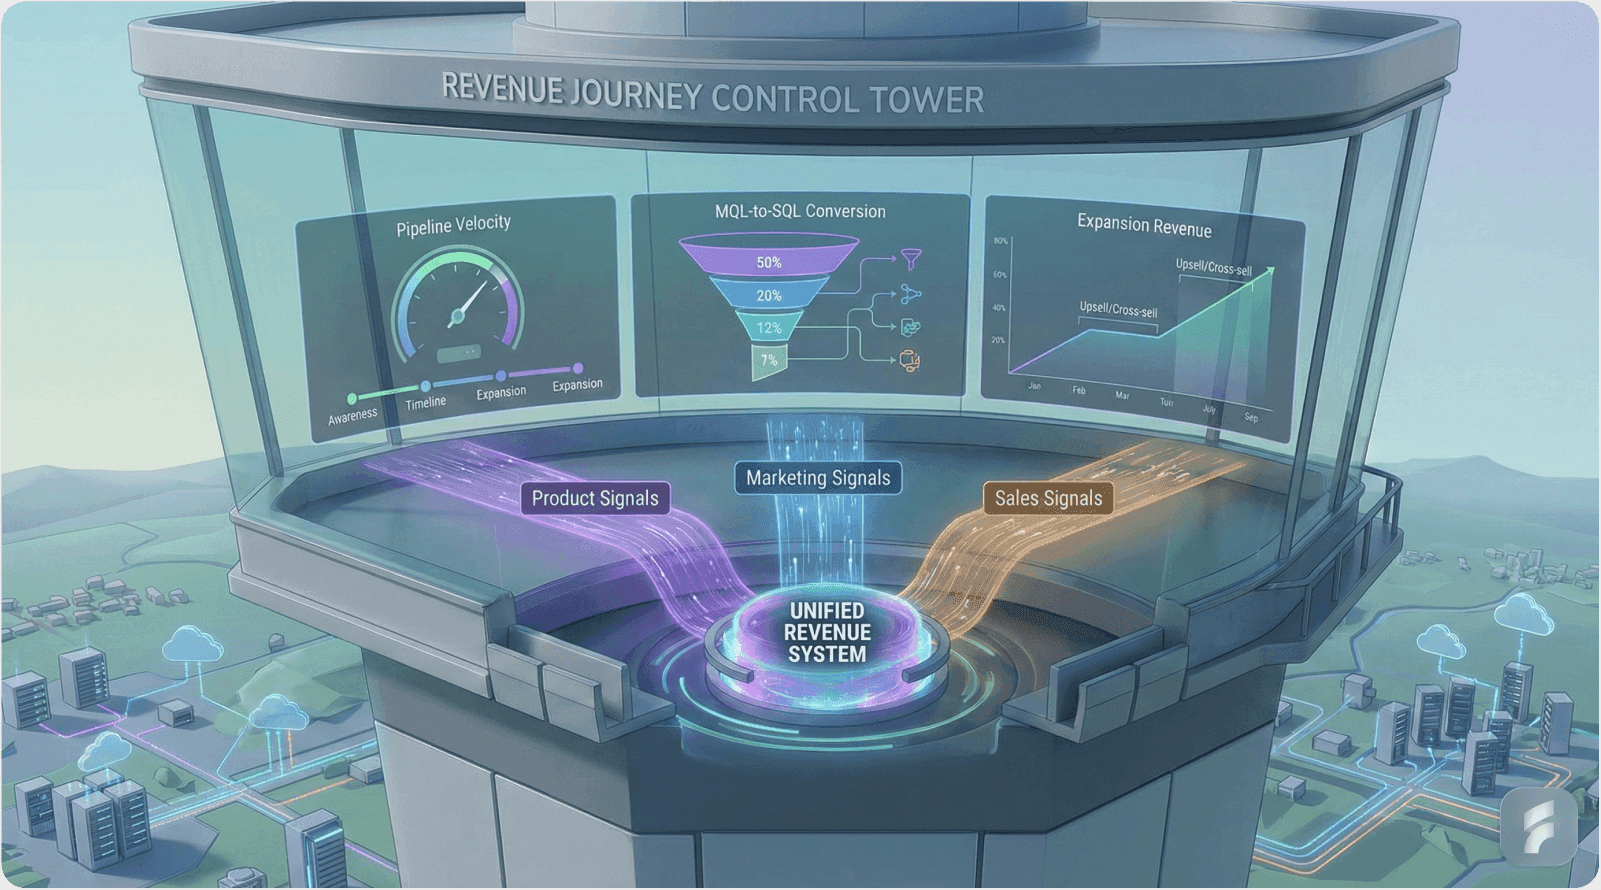
Three core metrics create alignment across functions. Pipeline velocity measures days from initial contact to closed revenue, with each team contributing specific improvements. Product reduces friction through feature adoption. Marketing improves lead quality scoring. Sales optimizes conversion rate execution.
MQL-to-SQL conversion rate reveals handoff quality between marketing and sales while providing product teams insight into which capabilities drive qualification. Strong products generate inbound interest from qualified buyers; weak positioning requires marketing to compensate through volume.
Expansion revenue percentage tracks how well product capabilities drive growth within existing accounts. Marketing nurtures accounts for upsell opportunities. Product ships features that expand use cases. Sales executes expansion conversations with usage data.
Metric Selection and Implementation
Definition Block: Pipeline Velocity
Pipeline velocity = (Number of Opportunities × Average Deal Value × Win Rate) / Sales Cycle Length
This formula reveals that revenue acceleration comes from four levers: increasing opportunity volume, raising average contract values, improving win rates, or reducing time to close. Cross-functional teams can optimize different variables simultaneously.
Target Benchmarks by Segment:
Enterprise SaaS targets pipeline velocity under 45 days for complex products with multi-stakeholder buying processes. Mid-market companies target 30-35 day cycles. SMB self-service products should achieve under 21 days from initial contact to closed revenue.
MQL-to-SQL conversion benchmarks vary by go-to-market motion. Product-led growth companies target 40-50% conversion as product experience pre-qualifies buyers. Sales-led enterprise models accept 25-35% conversion given longer qualification processes and higher contract values.
Feature adoption to ARR correlation measures how effectively product capabilities drive revenue. Top-performing companies generate 20%+ of new annual recurring revenue from recently launched features, indicating product and sales alignment on capability development.
90-Day Revenue Alignment Sprint
Phase 1: Metric Foundation (Weeks 1-2)
Conduct cross-functional workshop defining three shared KPIs with specific targets. Product, marketing, and sales leadership must achieve consensus on definitions, measurement methodology, and accountability structures.
Document current baseline performance across all metrics. Many organizations discover they lack consistent measurement systems across departments, requiring infrastructure investment before optimization begins.
Create explicit ownership model using RACI framework. Define who owns each metric (Responsible), who approves changes (Accountable), who provides input (Consulted), and who receives updates (Informed). Ambiguity in ownership guarantees failure.
Phase 2: Dashboard Construction (Weeks 3-6)
Deploy unified data infrastructure connecting product analytics, marketing automation, and CRM systems. Most companies operate fragmented systems requiring manual reconciliation, destroying trust in reported metrics.
Common technology stack integrates HubSpot or Salesforce for CRM, Segment or Customer.io for event tracking, and Looker Studio or Tableau for visualization. The specific tools matter less than ensuring single source of truth for all teams.
Implement real-time Slack notifications for critical pipeline events. When high-value opportunities enter pipeline, product teams receive context on buyer use case. When deals stall, marketing sees objection patterns informing positioning adjustments.
Phase 3: Operational Rhythm (Weeks 7-12)
Establish weekly pipeline review meetings every Friday at 3pm with product, marketing, and sales representation. Fifteen-minute timeboxed sessions review metric trends, identify anomalies, and assign investigation owners.
Deploy monthly win-loss analysis sessions where sales, product, and marketing jointly review closed opportunities. What capabilities drove wins? What objections caused losses? How does competitive positioning need adjustment?
Conduct quarterly KPI recalibration as market conditions, product capabilities, and competitive dynamics evolve. Metrics that drove alignment in January may create misalignment by April without regular review.
Case Study: Altiorco's Smarketing Sprint Transformation
Initial State Assessment:
Altiorco operated with classic misalignment symptoms. Marketing generated high lead volumes measured by MQL count without qualification rigor. Sales rejected 82% of marketing-sourced leads as unqualified, creating organizational tension. Product shipped features based on internal roadmaps rather than customer intelligence.
Performance metrics reflected dysfunction. MQL-to-SQL conversion sat at 18% versus industry benchmark 25-30%. Sales cycles averaged 72 days, significantly above competitive 45-day standard. Pipeline predictability remained poor with quarterly revenue forecasts missing by 20%+ regularly.
Transformation Initiative:
The company implemented 90-day smarketing sprint focused on shared metrics and coordinated processes. Key tactical changes included single Slack channel (#revenue-ops) with 100% visibility across teams, eliminating information asymmetry that previously created blame dynamics.
Weekly 15-minute standup meetings addressed "what broke this week" rather than status updates. This problem-focused approach surfaced issues fast while avoiding defensive posturing common in traditional meetings.
RACI matrix clarified pipeline leakage ownership at each funnel stage. When deals stalled in technical validation, product owned resolution. When pricing objections emerged, sales owned competitive positioning improvements with marketing support.
Mandatory cross-team attendance at win-loss post-mortems created shared learning loops. Product heard directly why features didn't meet buyer expectations. Sales understood product limitations requiring positioning adjustments. Marketing learned which campaigns attracted best-fit buyers.
Measured Outcomes:
Within 90 days, MQL-to-SQL conversion improved from 18% to 41%, eliminating pipeline waste from poor lead quality. Sales cycles compressed from 72 to 38 days through better handoffs and shared context on buyer needs.
Most significantly, revenue operations evolved from cost center to autonomous growth engine. Teams proactively identified and resolved pipeline friction points without executive intervention, creating sustainable performance improvement.
The financial impact totaled $2.1 million in pipeline acceleration from faster closes and higher conversion rates, representing 75% improvement in revenue efficiency from alignment initiatives alone.
Revenue Metrics Implementation Checklist
Week 1-2: Metric Foundation
Conduct cross-functional workshop defining three shared KPIs
Document specific target benchmarks for each metric
Agree on measurement methodology and data sources
Establish RACI ownership model for each metric
Create escalation protocol for metric disputes
Baseline current performance across all three KPIs
Identify data infrastructure gaps requiring investment
Week 3-6: Dashboard Deployment
Integrate product analytics, marketing automation, and CRM systems
Build Looker Studio or Tableau unified dashboard
Configure real-time Slack notifications for pipeline events
Train all teams on dashboard navigation and interpretation
Establish data quality monitoring and validation processes
Create mobile access for field sales updates
Document data definitions and calculation methodologies
Week 7-12: Operational Rhythm
Launch weekly Friday 3pm pipeline review meetings
Conduct first monthly win-loss deep dive session
Establish quarterly KPI recalibration process
Create metric performance accountability structures
Deploy feedback loops for metric refinement
Build historical trending for pattern recognition
Document lessons learned and optimization opportunities
Micro-Summary: Unified revenue metrics eliminate departmental silos by creating shared success criteria. Pipeline velocity, MQL-to-SQL conversion, and expansion revenue percentage align product, marketing, and sales on outcome optimization rather than activity completion. Companies implementing this framework achieve 41% conversion rates and 38-day sales cycles compared to industry averages of 18% and 72 days. The 90-day sprint model provides structured implementation path with clear checkpoints and accountability mechanisms.
Framework 2: Product-Sales Enablement Flywheel

The Pre-Sell Validation Model
Traditional product development follows build-then-sell sequence where engineering ships features before sales validates customer demand. This creates expensive misalignment when capabilities don't match buyer needs or competitive positioning.
The enablement flywheel reverses this pattern through pre-sell validation. Sales identifies high-value opportunities blocked by capability gaps. Product validates demand through champion conversations. Engineering builds with confirmed buyer commitment. Sales demos to pre-sold audience.
This approach eliminates feature adoption risk while accelerating sales cycles through validated roadmap alignment. A comprehensive UX audit can help identify which features actually solve user problems before development begins.
Discovery-Driven Roadmap Prioritization
Market Intelligence:
Sixty-eight percent of B2B SaaS deals lost to "doesn't do X" objections stem from product-sales misalignment on capability priorities. Sales encounters objections daily but lacks structured channel to inform product decisions. Product ships features based on internal assumptions rather than competitive intelligence.
Sales-led discovery multiplies feature prioritization speed by 3x according to product management benchmarks. Direct buyer conversations reveal not just what capabilities matter but why they matter, how they'd be used, and what outcomes they'd drive.
Demo-readiness scoring improves close rates 22% by ensuring sales can confidently present capabilities rather than making vague promises about future roadmap items. Clear go/no-go criteria for feature launches prevent premature selling of half-built functionality.
Expert Perspective on Roadmap Validation
"Top SaaS companies don't build roadmaps—they validate them through sales conversations first. Product owns execution, sales owns discovery."
— Prodnovate Chief Revenue Officer, 2025
This inverted relationship challenges traditional product management orthodoxy where product managers own customer research and roadmap decisions independently. In high-performing organizations, sales brings opportunities and intelligence while product evaluates feasibility and prioritization.
The key distinction: sales discovers what buyers need, product determines whether and how to build it. This division of labor leverages each function's strengths while creating accountability for results.
The Deal Desk Process
Structured Opportunity Review:
Companies implementing deal desk processes for opportunities exceeding $50,000 create systematic product-sales coordination. When sales identifies potential deal blocked by capability gap, structured review determines whether to commit product resources.
Product schedules 48-hour discovery call with champion to understand specific use case, current workarounds, success criteria, and competitive alternatives being evaluated. This direct engagement reveals whether requested capability represents isolated edge case or broader market need.
Engineering joins pre-close demo during week three of sales cycle, providing technical validation and building customer relationship before contract signature. This involvement reduces post-sale implementation friction while ensuring realistic capability expectations.
Marketing converts closed deals into case studies within six weeks, creating sales assets demonstrating capability value to future prospects. The flywheel accelerates as each successful deployment strengthens sales positioning.
UserGems Revenue Flywheel Case Study
Initial Challenge State:
UserGems accumulated 500+ feature requests from sales team without systematic prioritization framework. Product selected features based on internal technical interest rather than revenue impact, resulting in 12% adoption rate for shipped capabilities.
Sales team frustration mounted as product shipped features unrelated to deal blockers while requested capabilities remained unbuilt. This created organizational tension and finger-pointing about responsibility for lost deals.
Deal Desk Implementation:
The company introduced structured process for opportunities exceeding $25,000 requiring specific product capabilities. Sales submitted capability gap form triggering product review within 24 hours with documented response on feasibility and timeline.
For validated opportunities, product managers joined discovery calls with buyer champions to understand specific requirements, success metrics, and competitive alternatives. This direct engagement transformed feature requests from sales wish lists to customer-validated requirements.
Engineering participated in week-three pre-close demos for major opportunities, providing technical validation and establishing post-sale relationship. Customers appreciated direct access to product team, strengthening close rates through confidence in delivery capability.
Marketing systematically converted closed deals into case studies within six-week windows, creating sales assets demonstrating capability value. These case studies accelerated future sales cycles by providing proof points addressing common objections.
Performance Transformation:
Close rates improved 52% for opportunities entering deal desk process compared to standard sales motion. Feature adoption rates jumped from 12% to 67% as shipped capabilities addressed validated customer needs rather than internal assumptions.
Most importantly, sales cycle velocity increased 3x for deals involving new capabilities as pre-selling created buyer commitment before feature completion. Customers willing to commit based on roadmap conversations closed faster than those evaluating completed features.
Seven-Step Enablement Playbook
Step 1: Deal Desk Intake (Sales → Product)
Configure CRM workflow automatically flagging opportunities exceeding $25,000 with missing capability tags. Sales completes structured form documenting specific customer requirement, competitive context, success criteria, and timeline expectations.
Product reviews all submissions within 24 hours, providing preliminary assessment on feasibility, effort estimation, and alternative solutions. Clear yes/no decision prevents stringing sales along with vague "we're considering it" responses.
Step 2: Champion Discovery (Product → Customer)
Product manager schedules 60-minute discovery call with customer champion within 48 hours of deal desk approval. Call focuses on understanding current workarounds, success metrics, technical environment, and decision criteria.
Document conversation verbatim including top three objections to current approach and specific outcomes required for success. This raw customer intelligence informs both feature design and sales positioning refinement.
Step 3: Demo Readiness Scoring (0-100 Point Scale)
Evaluate each capability across three dimensions before sales presents to prospects. Feature coverage assesses completeness versus customer requirements (40 points maximum). Sales confidence measures team's ability to demonstrate and position capability (30 points).
Competitive positioning examines differentiation versus alternatives buyers evaluate (30 points). Capabilities scoring below 70 require redesign before sales enablement to prevent credibility damage from premature launches.
Step 4: Pre-Close Engineering Participation
Engineering joins customer demo during week three of sales cycle for deals exceeding $50,000. This serves dual purpose: technical validation for complex requirements and relationship building for post-sale implementation.
Customer access to engineering team strengthens close rates through confidence in delivery capability while setting realistic expectations on customization limits and timeline considerations.
Step 5: Launch Coordination (Marketing → Sales → Product)
Marketing creates demo video under three minutes demonstrating core capability and typical use cases. Sales receives competitive battlecards documenting positioning against alternatives and objection handling scripts.
Product provides FAQ document addressing top 15 customer questions and concerns. Sales receives ROI calculator tool quantifying value proposition for different customer segments and use cases.
Step 6: Adoption Tracking (Product → Sales)
Product monitors feature adoption metrics for customers who purchased based on specific capabilities. Low adoption rates trigger customer success outreach to resolve implementation blockers before they become churn risks.
Sales receives quarterly reports on feature-driven revenue and adoption patterns, informing future positioning and capability prioritization. This feedback loop strengthens sales team's trust in product commitments.
Step 7: Win-Loss Intelligence (Sales → Product)
Sales submits structured win-loss reports including call transcripts, competitive intelligence, and capability feedback. Product reviews monthly to identify patterns in objections and competitive positioning weaknesses.
This systematic intelligence gathering creates continuous improvement loop where product roadmap reflects real market demands rather than internal assumptions or executive opinions.
Product-Sales Enablement Checklist
Pre-Launch Requirements (Product → Sales):
Three-minute demo video showing core capabilities
Competitive battlecards with differentiation points
FAQ document addressing top 15 customer objections
ROI calculator quantifying value by customer segment
Technical requirements documentation
Implementation timeline and resource estimates
Sales training session with Q&A
Demo environment access and test data
Post-Launch Requirements (Sales → Product):
Win-loss call transcript submission process
Monthly demo feedback collection
Quarterly feature request prioritization review
Capability gap reporting workflow
Competitive intelligence sharing protocol
Customer success metric tracking
Adoption rate monitoring dashboard
Renewal and expansion correlation analysis
Micro-Summary: Product-sales enablement flywheel eliminates 68% of "doesn't do X" losses through pre-sell validation before building features. Deal desk processes create systematic coordination where sales discovers buyer needs and product evaluates feasibility. UserGems demonstrated 52% close rate improvement and 3x adoption velocity through this approach. Demo readiness scoring prevents premature launches while engineering participation in sales cycles strengthens technical credibility and relationship building.
Framework 3: Launch Alignment Operating System
The Coordinated Go-To-Market Problem
Marketing launches product campaigns without sales preparation. Product ships features without marketing assets ready. Sales scrambles to understand positioning while trying to hit quota. This pattern creates 43% launch failure rate despite quality products and capable teams.
The dysfunction stems from asynchronous planning rather than incompetence. Marketing operates on campaign calendars disconnected from product roadmaps. Product ships when engineering declares done without considering market readiness. Sales learns about launches through customer questions rather than proactive enablement.
90-Day Launch Timeline
The Single Operating System Approach:
Successful launches require single coordinated timeline owned by revenue operations rather than individual departments. This eliminates handoff gaps and ensures all teams execute synchronized go-to-market motions.
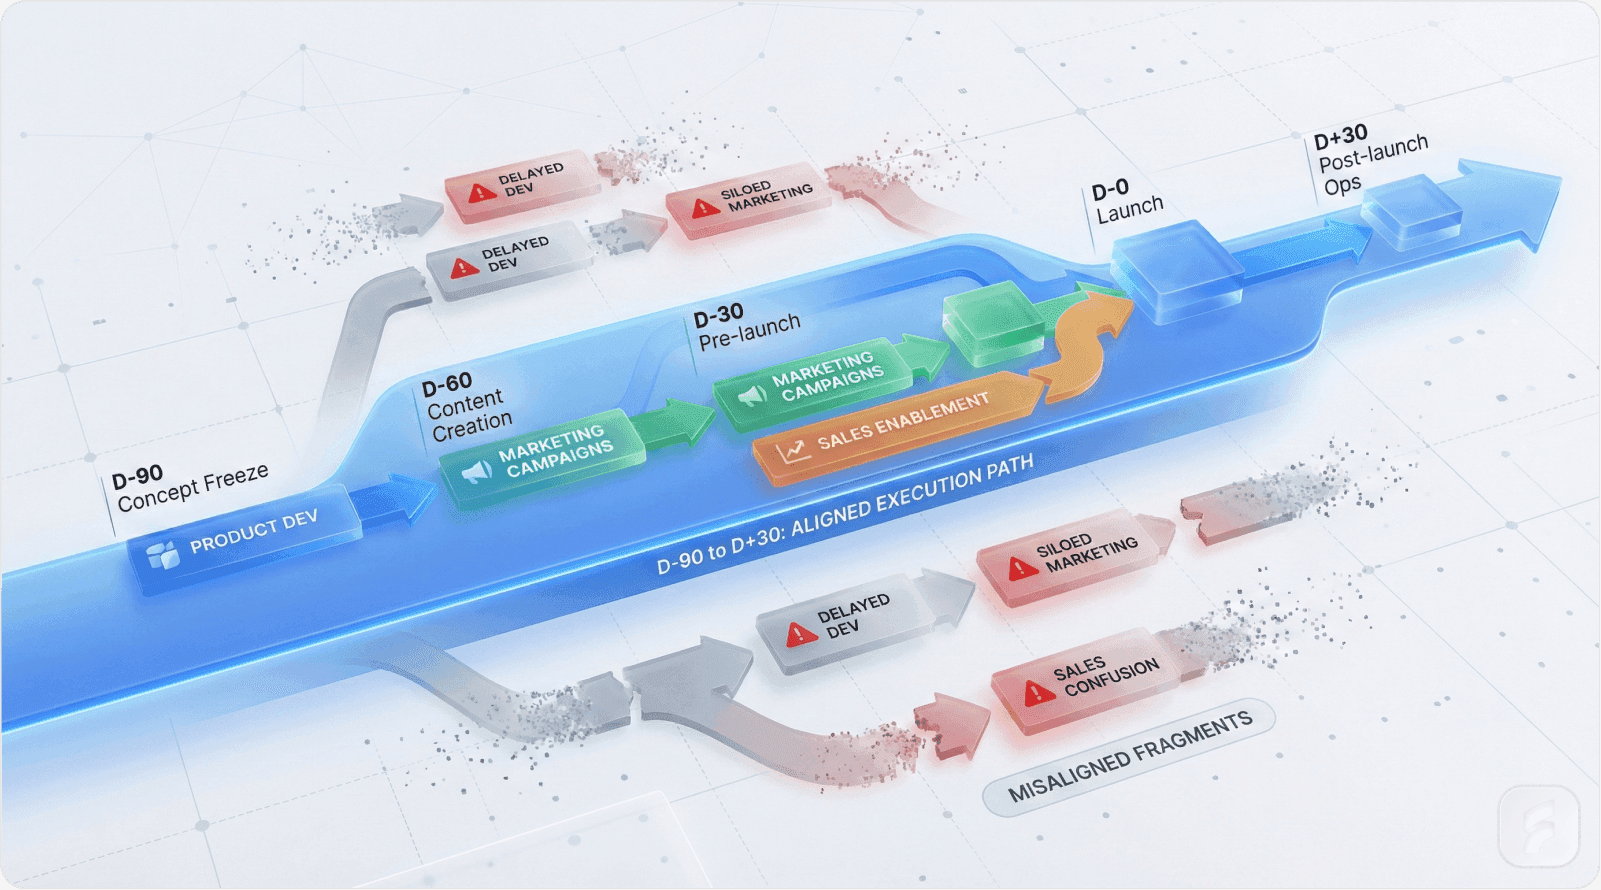
D-90: Strategic Planning Phase
Product creates comprehensive marketing brief documenting ideal customer profile, positioning strategy, proof points, competitive differentiation, and success metrics. This brief serves as single source of truth for all downstream planning.
Marketing validates campaign capacity and budget allocation for launch support. Sales confirms team bandwidth to absorb new capability training and execute launch-specific outreach. Revenue operations establishes tracking infrastructure for launch performance measurement.
This upfront alignment prevents last-minute scrambles when product ships features sales can't position or marketing can't support with campaign assets.
D-60: Sales Enablement Development
Sales playbook development begins eight weeks before launch, providing adequate time for content creation, review, and training. Playbook includes demo flow scripts, objection handling responses, competitive positioning, and pricing guidance.
Product creates demo environments with representative data showing capabilities in realistic use cases. Sales receives access six weeks before launch for practice and feedback, identifying positioning problems before customer conversations.
Marketing initiates competitive intelligence updates documenting how launch capabilities change competitive positioning and which alternatives buyers will evaluate. This intelligence informs both sales conversations and campaign messaging development.
D-30: Campaign Asset Production
Marketing produces all campaign assets 30 days before launch including case studies, email sequences, landing pages, paid advertising creative, and social media content. This timeline allows adequate review cycles without last-minute emergencies.
Sales receives early access to all marketing assets for feedback on customer resonance and competitive positioning accuracy. Marketing adjusts messaging based on sales team's frontline customer intelligence before public launch.
Product finalizes FAQ documentation, technical requirements guides, and implementation playbooks for customer success teams. These materials ensure consistent post-sale experience regardless of which team member handles implementation.
D-0: Coordinated Launch Execution
All teams execute simultaneous launch activities creating market moment rather than gradual rollout. Marketing activates paid campaigns, publishes content, and initiates email sequences. Sales begins targeted outreach to accounts matching ideal customer profile.
Product announces launch through in-app notifications and release notes. Customer success reaches out to existing customers who would benefit from new capabilities. This coordinated approach maximizes market impact and customer awareness.
D+30: Performance Review and Iteration
Revenue operations conducts comprehensive win-loss analysis examining launch performance across all channels and customer segments. Which messaging resonated? What objections emerged? How did competitive positioning perform?
This systematic review feeds iterations on positioning, sales approaches, and product adjustments. Launches improve continuously through documented learning rather than repeating same mistakes.
Market Performance Data
Launch Alignment Impact:
Cross-functional launches generate 37% higher annual recurring revenue compared to siloed department initiatives. The coordination eliminates market confusion from inconsistent messaging while ensuring sales team readiness to convert interest into revenue.
Sales-prepared launches demonstrate 2.1x higher demo-to-deal conversion as teams confidently position capabilities versus competitors. Training and enablement investment pays immediate dividends through higher win rates and faster sales cycles.
Post-launch review processes accelerate iteration speed 28% by systematically capturing intelligence and implementing improvements. Organizations learning from each launch compound advantages over competitors executing one-off initiatives.
Expert Analysis on Launch Coordination
"Launch alignment fails because teams optimize for their function, not revenue. Force fit every launch into single timeline owned by Revenue Ops."
— Dock Chief Revenue Officer, 2025
The critical insight: individual departments executing excellent work in isolation creates organizational failure. Marketing might produce brilliant campaigns, product might ship quality features, sales might execute flawless demos—yet revenue suffers from timing misalignment and message inconsistency.
Revenue operations ownership creates accountability for coordinated execution. Single leader ensures all teams hit synchronized milestones and resolves conflicts over resource allocation or timeline adjustments.
FlawlessInbound Launch Framework Case Study
Baseline Performance:
FlawlessInbound operated with typical misalignment where product shipped features when ready, marketing scrambled to create supporting assets, and sales learned about capabilities through customer questions. Average sales cycles spanned three months with 18% conversion rates.
Launch failures compounded as sales couldn't articulate value propositions, marketing messaging missed buyer pain points, and customers confused about product capabilities. The company shipped quality features that generated minimal revenue due to go-to-market dysfunction.
90-Day Launch OS Implementation:
The organization implemented structured 90-day launch operating system used successfully by 47 other B2B SaaS companies. Template provided clear milestone definitions and accountability structures eliminating ambiguity about who owns what by when.
D-90 product marketing briefs formalized customer insight sharing between product and marketing teams. Sales provided input on competitive landscape and buyer objections before positioning solidified, preventing tone-deaf messaging.
D-60 sales playbook development gave teams two full months to master new capabilities, practice demos, and provide feedback on positioning before customer conversations. This preparation time proved critical for complex enterprise features.
D-30 campaign asset production allowed marketing to create high-quality content with proper review cycles. Sales early access enabled feedback incorporating frontline customer intelligence into final messaging.
D-0 coordinated launches created market moments with simultaneous activity across all channels. Customers encountered consistent messaging whether discovering through paid ads, sales outreach, or in-app notifications.
Performance Transformation:
Sales cycles compressed 28% from three months to 52 days through better prepared teams and coordinated market approach. Conversion rates improved from 18% to 31% as sales confidently demonstrated capabilities to pre-warmed audiences.
Pipeline growth accelerated 42% as marketing campaigns and sales efforts reinforced each other rather than creating market confusion. The synchronized approach multiplied effectiveness of individual channel investments.
Most significantly, launch execution became repeatable system rather than heroic individual efforts. Newer team members executed successful launches following documented playbook versus relying on institutional knowledge.
Launch Operating System Checklist
D-90 Planning Phase:
Product marketing brief completed and approved
Sales capacity confirmed for launch support
Marketing campaign budget allocated
Competitive intelligence research initiated
Success metrics and tracking infrastructure defined
Revenue operations review and approval
Risk assessment and mitigation planning
D-60 Enablement Phase:
Sales playbook drafted with demo flows and objection handling
Competitive battlecards updated with new capability positioning
Demo environment configured with realistic test data
Sales training sessions scheduled
Pricing and packaging finalized
Technical requirements documented
Customer success implementation guides drafted
D-30 Campaign Phase:
Landing pages designed, reviewed, and published
Email sequences written and tested
Case studies or proof points developed
Paid advertising creative produced and approved
Social media content calendar created
PR and analyst outreach initiated
Sales cadence automation configured
D-0 Launch Day:
All marketing campaigns activated simultaneously
Sales outreach sequences initiated
In-app notifications deployed
Customer success team notified
Support documentation published
Performance tracking dashboards active
Executive communication sent
D+30 Review Phase:
Win-loss analysis completed across all channels
Sales feedback collected and synthesized
Marketing performance metrics analyzed
Product adoption tracking reviewed
Competitive intelligence updated
Lessons learned documented
Next launch improvements identified
Micro-Summary: Launch alignment operating system eliminates 43% failure rate through synchronized 90-day timeline spanning planning, enablement, campaign production, execution, and review phases. FlawlessInbound demonstrated 28% sales cycle reduction and 42% pipeline growth through coordinated launches versus siloed initiatives. Revenue operations ownership creates accountability for cross-functional execution while standardized playbook enables repeatable success versus heroic individual efforts.
Framework 4: Customer Journey Scorecard
The Funnel Optimization Trap
Marketing optimizes MQL volume. Sales optimizes demo bookings. Product optimizes feature usage. Each team hits departmental targets while overall revenue performance stagnates or declines.
This siloed optimization creates invisible pipeline leakage. Marketing generates leads sales can't convert. Sales books demos for accounts product can't activate. Product ships features that don't drive expansion revenue.
The solution requires unified customer journey scorecard measuring complete lifecycle from awareness through expansion. Every team shares accountability for overall journey health rather than isolated stage performance.
Seven-Stage Journey Scoring Model
Comprehensive Journey Tracking:
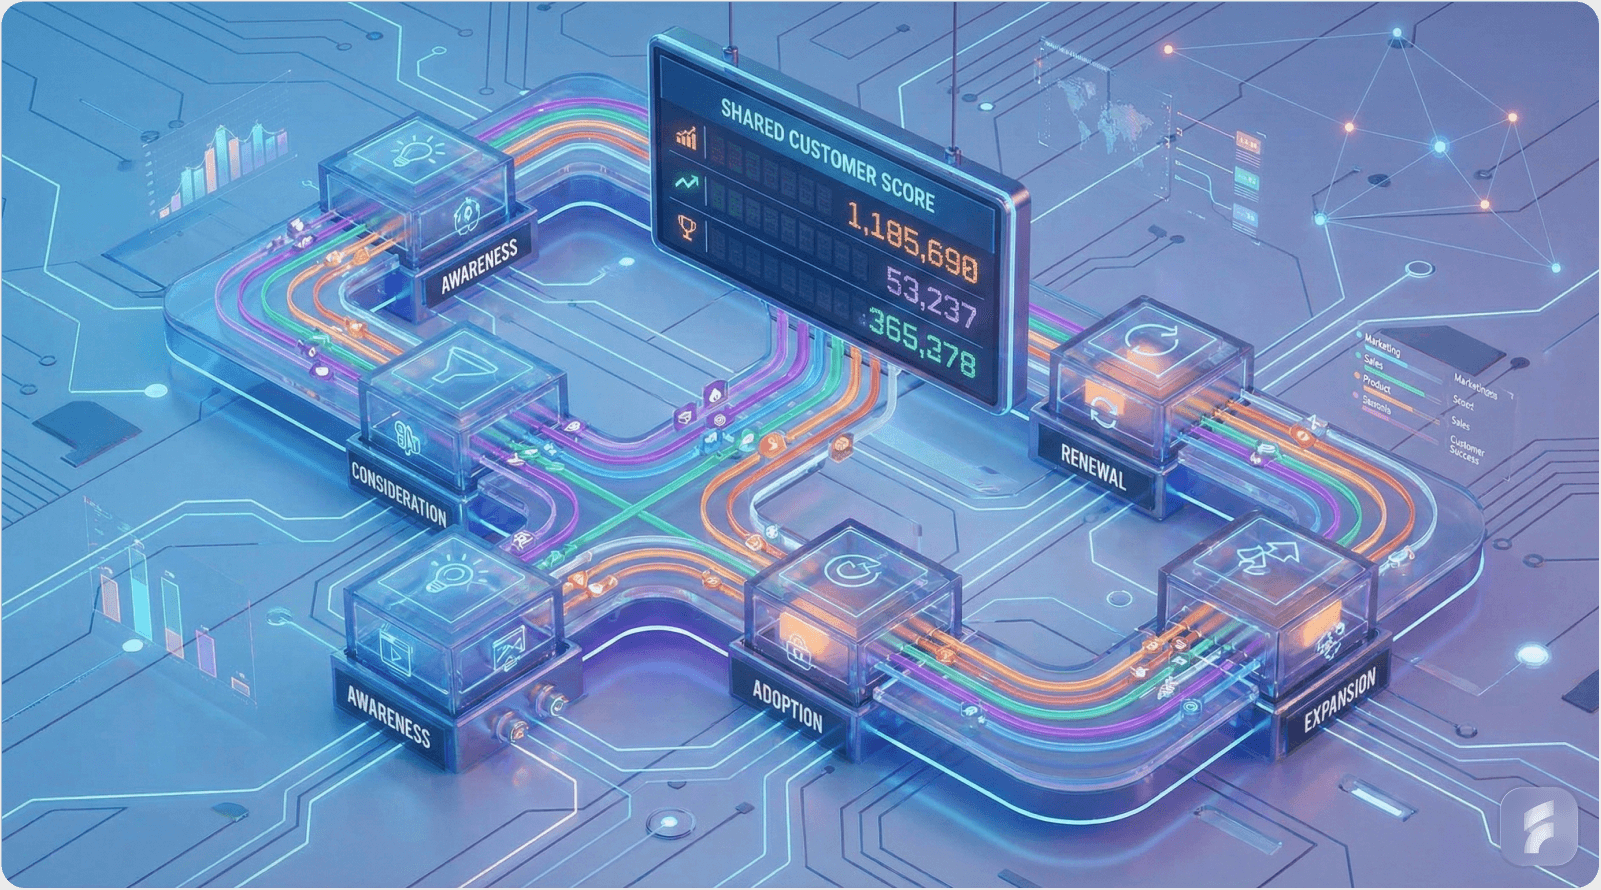
Customer journey scorecard assigns 100 total points across seven critical stages representing complete buyer lifecycle. Each stage receives specific point allocation reflecting importance to revenue outcomes.
Awareness stage measures content engagement and brand interaction, allocated 15 points. Marketing owns this stage through thought leadership, SEO performance, and paid advertising effectiveness generating initial market awareness.
Interest stage tracks MQL scoring quality and account fit, allocated 15 points. Marketing and sales development representatives collaborate on lead scoring models ensuring qualified opportunities enter pipeline versus volume metrics gaming.
Consideration stage measures demo booking and technical evaluation, allocated 20 points. Sales owns presentation quality and needs discovery while product ensures demo environments showcase relevant capabilities for buyer use cases.
Decision stage tracks proposal quality and commercial terms, allocated 20 points. Sales drives negotiation while product validates technical fit and marketing provides proof points supporting value justification.
Closed stage measures contract signature and onboarding activation, allocated 15 points. Revenue operations tracks conversion efficiency while customer success ensures smooth implementation preventing buyer's remorse churn.
Expansion stage measures feature adoption and upsell readiness, allocated 15 points. Product owns capability development driving expansion while sales executes upsell conversations based on usage patterns.
Shared Accountability Structure
Cross-Functional Ownership:
Traditional funnels create handoff mentality where marketing owns top, sales owns middle, product owns bottom. Journey scorecard eliminates handoffs through shared accountability for complete lifecycle performance.
Marketing cares about demo quality because poor sales presentation damages brand perception and wastes lead investment. Sales cares about product activation because inactive customers churn quickly destroying quota credit.
Product cares about lead quality because wrong-fit customers consume support resources and generate negative feature feedback. This shared accountability creates collaborative problem-solving versus departmental finger-pointing.
Performance Impact Data
Journey Scorecard Outcomes:
Organizations implementing unified journey scorecards demonstrate 3x faster pipeline velocity through elimination of handoff friction. Teams coordinate activities optimizing complete journey versus isolated stages.
MQL-to-SQL conversion improves from industry average 25% to best-in-class 41% when marketing and sales jointly own qualification criteria. Collaboration on scoring models ensures leads meeting criteria actually match sales capacity to convert.
Customer acquisition cost declines 22% through reduced waste on activities not contributing to complete journey success. Teams eliminate campaigns generating vanity metrics without revenue contribution.
Expert Perspective on Unified Metrics
"Siloed KPIs create siloed behaviors. One journey scorecard forces every team to care about every stage."
— Improvado Revenue Analytics Lead, 2026
The behavioral insight proves critical. Individual departmental metrics create territorial behavior where teams protect their numbers regardless of impact on overall business outcomes. Journey scorecard realigns incentives toward revenue generation.
When marketing bonuses depend partly on activation rates, campaign strategy shifts from volume to quality. When product team success incorporates sales win rates, feature prioritization considers competitive positioning versus pure technical elegance.
Implementation Framework
Scorecard Development Process:
Begin with current state mapping documenting existing customer journey with conversion rates and cycle times at each stage. Identify specific leakage points where qualified opportunities exit pipeline unnecessarily.
Define point allocation across seven stages reflecting business model and customer lifecycle. Enterprise SaaS might weight decision and expansion stages higher given long sales cycles and expansion revenue models.
Establish measurement infrastructure connecting marketing automation, CRM, product analytics, and customer success platforms. Most companies discover data exists in silos requiring integration work before unified tracking possible.
Create shared dashboards accessible to all teams showing real-time journey health across complete lifecycle. Transparency prevents metric gaming and creates accountability for collaborative problem-solving.
Micro-Summary: Customer journey scorecard eliminates siloed optimization by assigning shared accountability across seven lifecycle stages from awareness through expansion. Organizations achieve 3x pipeline velocity and 41% MQL-to-SQL conversion by forcing cross-functional ownership versus departmental handoffs. Point allocation system (100 total points across stages) creates unified success criteria where marketing cares about activation and product cares about lead quality, fundamentally realigning incentives toward revenue generation.
Implementation: 90-Day Revenue Alignment Roadmap

Complete Transformation Timeline
Organizations cannot implement all frameworks simultaneously without overwhelming teams and diluting focus. Structured 90-day roadmap provides realistic implementation sequence with clear milestones and success criteria.
Phase 1: Foundation Building (Weeks 1-2)
Metric Definition and Baseline:
Conduct cross-functional workshop with product, marketing, and sales leadership defining three shared KPIs: pipeline velocity, MQL-to-SQL conversion, and expansion revenue percentage. Achieve explicit consensus on measurement methodology and target benchmarks.
Document current baseline performance across all three metrics. Many companies discover measurement gaps requiring instrumentation before optimization begins. Acknowledge gaps honestly versus fabricating numbers to appear competent.
Create revenue operations Slack channel with required membership from all teams. Establish norms around transparency, problem-focused discussions, and blame-free post-mortems. Culture change begins with communication infrastructure.
Phase 2: System Development (Weeks 3-6)
Dashboard and Process Implementation:
Deploy Looker Studio or Tableau dashboard integrating product analytics, marketing automation, and CRM data. Ensure single source of truth preventing metric disputes and data quality arguments.
Implement deal desk process for opportunities exceeding $50,000. Configure CRM workflow triggering product review within 24 hours of sales submission. Document response SLA and escalation protocol.
Build launch operating system template documenting 90-day timeline with specific milestones and ownership assignments. Train teams on framework usage and success criteria for each phase.
Phase 3: Execution and Optimization (Weeks 7-12)
Coordinated Launch and Iteration:
Execute first cross-functional product launch using new operating system. Treat as learning experience versus perfect execution, documenting problems and improvements for future iterations.
Conduct weekly pipeline review meetings every Friday 3pm with cross-functional representation. Timebox to 15 minutes focusing on anomalies and action items versus status updates everyone can read.
Run monthly win-loss deep dive sessions where product, marketing, and sales jointly analyze closed opportunities. What capabilities drove wins? What objections caused losses? How should positioning evolve?
Deploy quarterly feature adoption tracking showing which capabilities drive revenue and which languish unused. Product and sales collaborate on adoption improvement plans versus shipping more unused features.
Success Metrics Tracking
Target Performance Benchmarks:
Pipeline velocity should decrease from typical 72 days to under 45 days for enterprise deals through better handoffs and shared context. Mid-market targets 30-35 days, SMB targets under 21 days.
MQL-to-SQL conversion should improve from industry average 18-25% to best-in-class 40-45% through collaborative lead scoring and qualification standards. Quality over volume becomes shared value.
Close rates should increase from typical 20-25% to 35-42% as sales presents coherent value propositions supported by product capabilities and marketing proof points. Alignment multiplies individual team effectiveness.
New feature ARR contribution should grow from typical 8-12% to 25-30% as product ships what sales pre-validated and marketing positions effectively. Features drive revenue versus collecting digital dust.
Revenue Alignment Health Assessment
Diagnostic Scorecard:
Rate your organization across fifteen critical dimensions using 1-10 scale where 1 represents complete misalignment and 10 represents perfect coordination. Honest assessment identifies improvement priorities.
Metrics Dimension (Minimum 8/10):
Pipeline velocity under target benchmarks for your segment. MQL-to-SQL conversion exceeding 40%. Demo-to-close rates above 35%. Expansion revenue contributing 25%+ to new ARR.
Process Dimension (Minimum 7/8):
Weekly revenue synchronization meetings occurring consistently. Deal desk actively processing high-value opportunities. Launch operating system used for all major releases. Customer journey scorecard tracking complete lifecycle.
Cultural Dimension (Minimum 6/8):
Cross-functional trust enabling transparent problem-solving. Shared accountability versus departmental blame games. Data-driven decision making versus political positioning. Customer-centric versus internally-focused behaviors.
Organizations scoring below 7 overall require fundamental transformation. Companies scoring 7-8 need tactical improvements. Teams scoring 8+ should focus on optimization and competitive differentiation.
Common Implementation Pitfalls
Executive Sponsorship Failure:
Revenue alignment initiatives require C-level sponsorship resolving resource conflicts and enforcing accountability. Without explicit CEO or board support, departmental politics undermine cross-functional collaboration.
Secure commitment before launch versus assuming alignment will sell itself. Document expected investment in time, tools, and organizational change. Set realistic expectations about improvement timeline and interim challenges.
Metric Gaming Behavior:
Teams optimize individual metrics destructively when incentives remain departmental despite shared scorecards. Marketing generates garbage leads hitting MQL targets. Sales books unqualified demos hitting activity metrics.
Address through compensation redesign linking individual bonuses to shared outcomes. Product, marketing, and sales leadership should share meaningful portion of variable compensation tied to unified metrics.
Tool Fragmentation:
Organizations using incompatible technology stacks struggle with data integration required for unified visibility. Marketing uses Marketo while sales uses Salesforce while product uses Mixpanel with no integration layer.
Invest in integration platforms like Segment or mParticle creating single event stream feeding all systems. Alternative: consolidate onto unified platforms accepting some feature trade-offs for integration benefits.
Micro-Summary: 90-day implementation roadmap structures transformation into foundation building (weeks 1-2), system development (weeks 3-6), and execution phases (weeks 7-12). Target metrics include pipeline velocity under 45 days, MQL-to-SQL conversion above 40%, and close rates exceeding 35%. Health assessment scorecard across metrics, process, and culture dimensions identifies improvement priorities. Common pitfalls include insufficient executive sponsorship, metric gaming through misaligned incentives, and tool fragmentation preventing data integration.
Take Action Now
Revenue alignment isn't theory—it's operational discipline. Companies implementing these frameworks achieve 67% higher close rates, 28% faster sales cycles, and 42% better conversion.
Start This Week:
Schedule a revenue alignment kickoff for Wednesday at 3pm. Invite product, marketing, and sales leadership. Agenda: define three shared KPIs, document current baselines, commit to the 90-day sprint.
Track progress weekly in a dedicated #revenue-ops Slack channel. Hold teams accountable to milestones.
Your competitors aren't smarter or better funded. They've eliminated internal friction. Start today.


