


Last Update:
Table of Contents
No headings found in Blog Content.
Share

The global SaaS market reached $317 billion in 2024 and projects to $1.2 trillion by 2032, representing an 18.4% compound annual growth rate — yet most founders miss the opportunity entirely
Expansion revenue from existing customers now outpaces new customer acquisition by a 4:1 ratio among top-quartile SaaS firms
80% of SaaS startups never expand beyond their initial geography or industry vertical — companies that remain domestic forfeit an average of 46% potential revenue from international markets
Asia-Pacific leads global software growth at 22% CAGR through 2033, making it the fastest-growing region for SaaS products
Flat pricing models cap ARPU at 30-40% below potential — value metric pricing delivers 40-50% higher ARPU with 50% lower churn compared to feature-based alternatives
More than 50% of new SaaS users remain inactive after their first week — poor onboarding costs mid-stage SaaS companies approximately $1.2 million annually
Siloed SaaS products demonstrate 47% lower retention compared to ecosystem-integrated alternatives — integration ecosystems drive 70% higher retention by embedding products in daily workflows
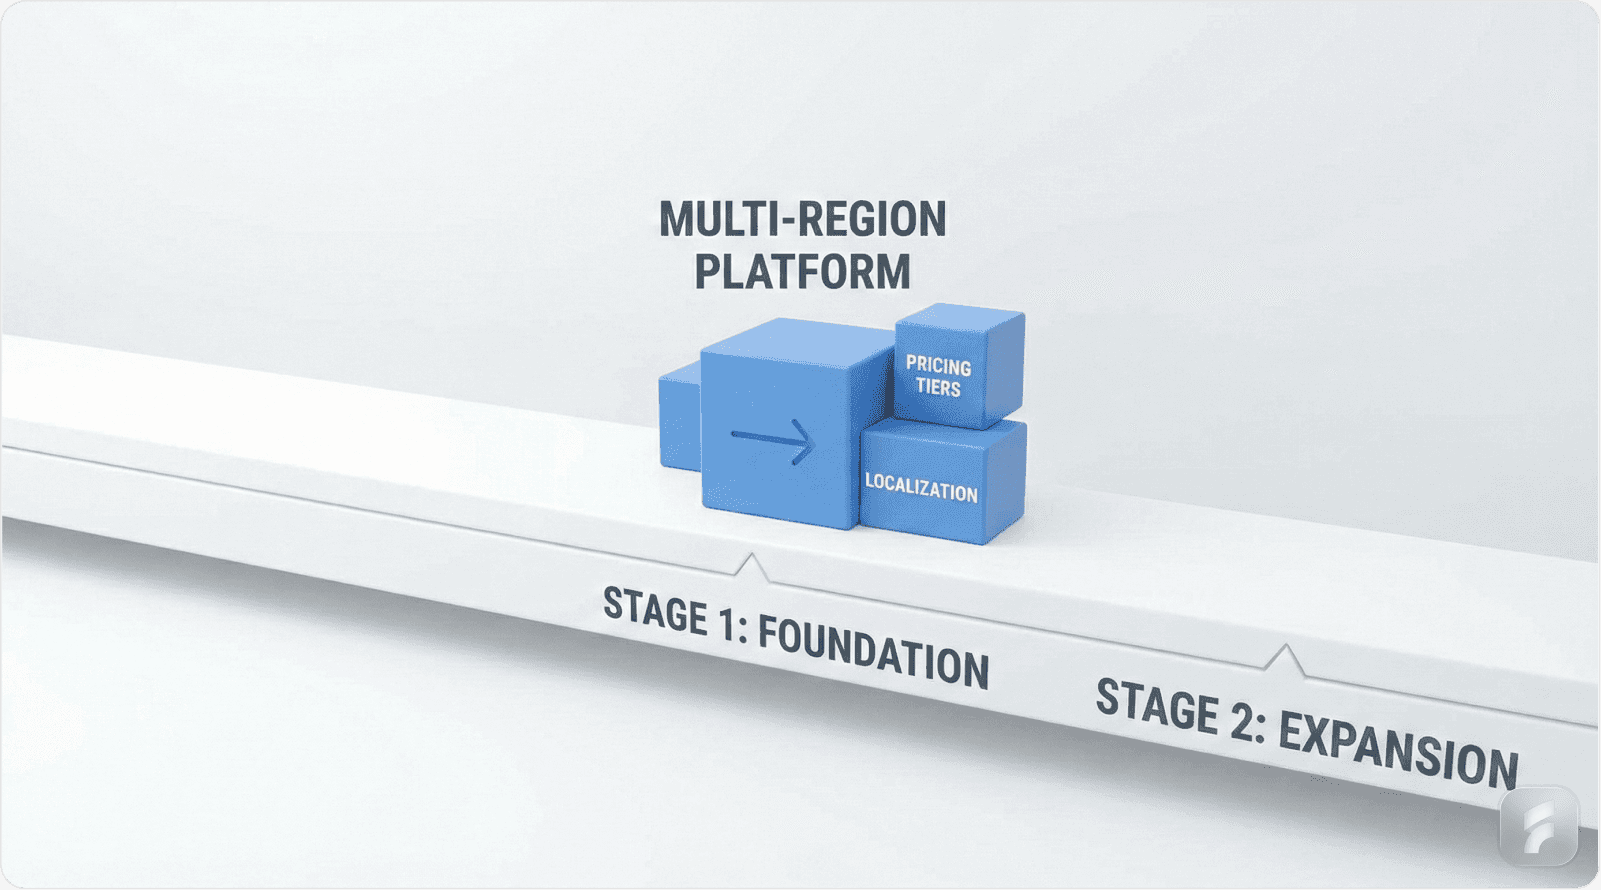
Introduction: Why Most SaaS Expansion Fails
SaaS expansion isn't about chasing growth—it's about engineering it with precision. The global SaaS market reached $317 billion in 2024 and projects to $1.2 trillion by 2032, representing an 18.4% compound annual growth rate. Yet most founders miss the opportunity entirely.
The difference between stagnant products and category leaders comes down to four systematic approaches: intelligent market entry, pricing evolution, onboarding optimization, and ecosystem development. This guide delivers the frameworks, data, and implementation checklists you need to capture expansion revenue.
Why Most SaaS Expansion Fails
Expansion revenue from existing customers now outpaces new customer acquisition by a 4:1 ratio among top-quartile SaaS firms. The companies mastering upsell, cross-sell, and geographic expansion dominate their categories while others struggle with single-digit growth.
The challenge isn't lack of ambition. It's lack of method.
This article provides verified strategies backed by current market data, expert analysis from industry leaders, and case studies from companies like HubSpot and Dropbox. Each section includes actionable frameworks you can implement immediately.
Strategy 1: Expanding to New Markets Through Geographic and Vertical Growth

Understanding Market Expansion Friction
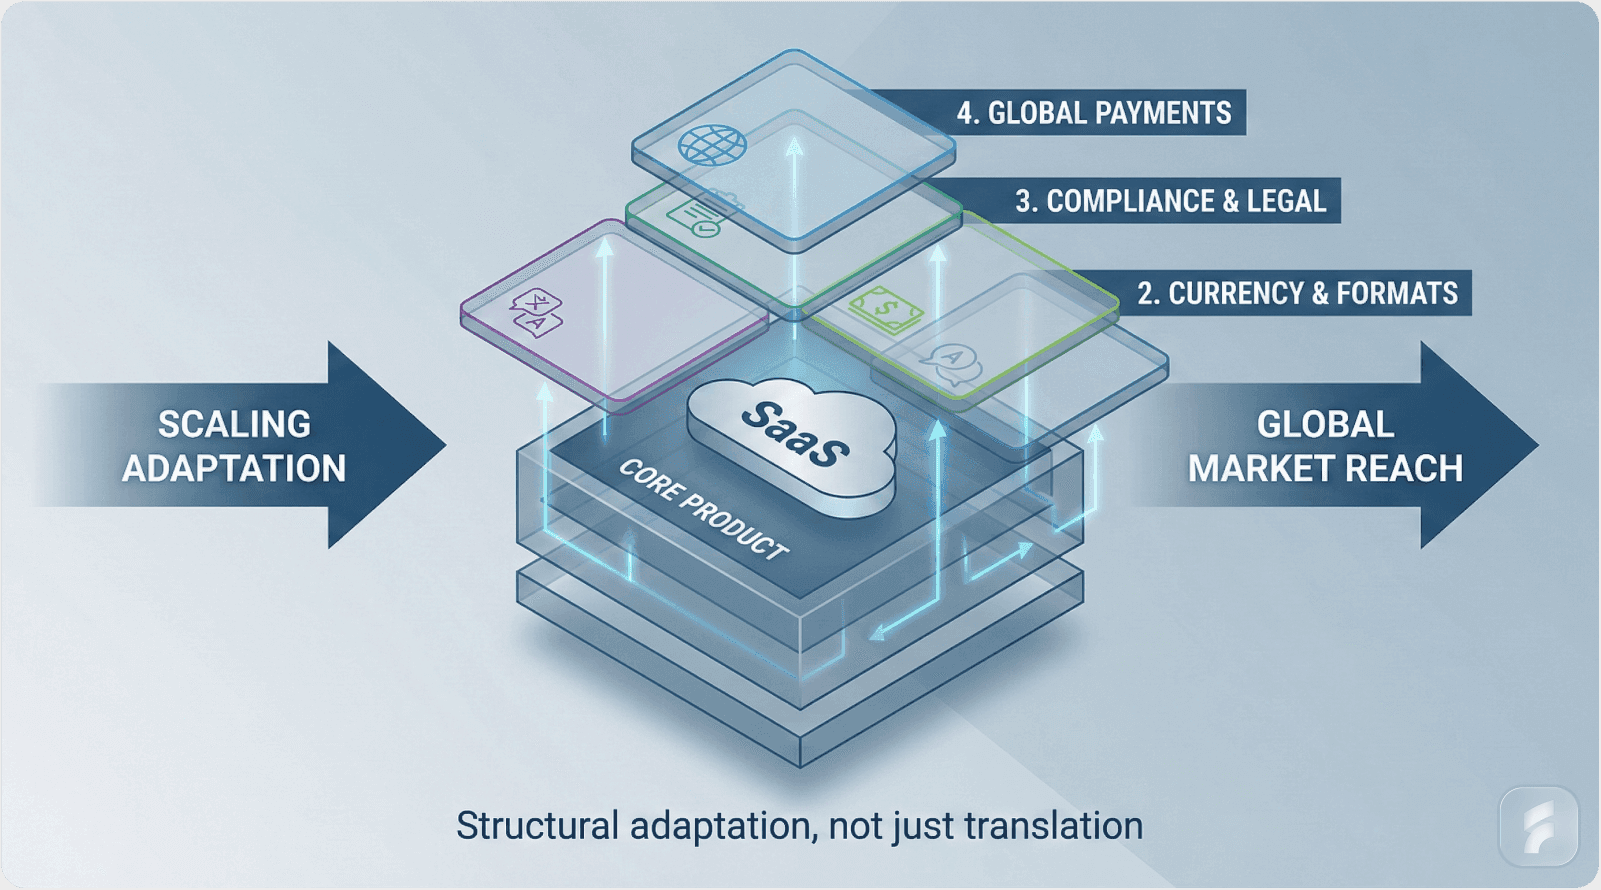
Eighty percent of SaaS startups never expand beyond their initial geography or industry vertical. The barriers appear insurmountable: product-market fit uncertainty, localization costs averaging 15-20% of target ARR, and compliance requirements like GDPR and data sovereignty regulations.
This hesitation carries a measurable cost. Companies that remain domestic forfeit an average of 46% potential revenue from international markets. Worse, founders often waste 6-12 months pursuing the wrong regions, burning through $500,000 or more in failed market entry attempts.
The activation friction for international expansion is real but manageable with the right approach.
The Geographic Opportunity Window
Not all markets present equal opportunity. Asia-Pacific leads global software growth with a 22% compound annual growth rate through 2033, making it the fastest-growing region for SaaS products. North America still commands 44% of total global software revenue, but the growth trajectory favors international expansion.
Market Size Distribution:
The current market landscape shows clear geographic patterns. Asia-Pacific's 22% CAGR significantly outpaces North America's mature 10-12% growth rate. Europe maintains steady expansion at 15-17% annually, while Latin America and emerging markets show promise at 18-20% growth.
Top-performing SaaS companies now derive 46% of revenue from international markets, according to HubSpot's 2024 expansion data. This represents a strategic shift from domestic-first to globally distributed revenue models.
Product-Qualified Lead Validation
"International revenue now represents 46% of our total—achieved through localized hubs, regional data centers, and partner ecosystems rather than one-size-fits-all global rollout." — HubSpot Leadership, 2024 Expansion Announcement
The key to reducing market entry risk lies in product-qualified leads (PQLs). Rather than expensive market research, successful companies analyze organic traffic patterns and user behavior to identify viable expansion targets.
PQLs provide concrete demand signals before capital deployment.
Track which countries generate the highest signup rates, engagement metrics, and conversion intent. If you're seeing 500+ monthly signups from Germany with minimal marketing investment, that's a demand signal worth investigating.
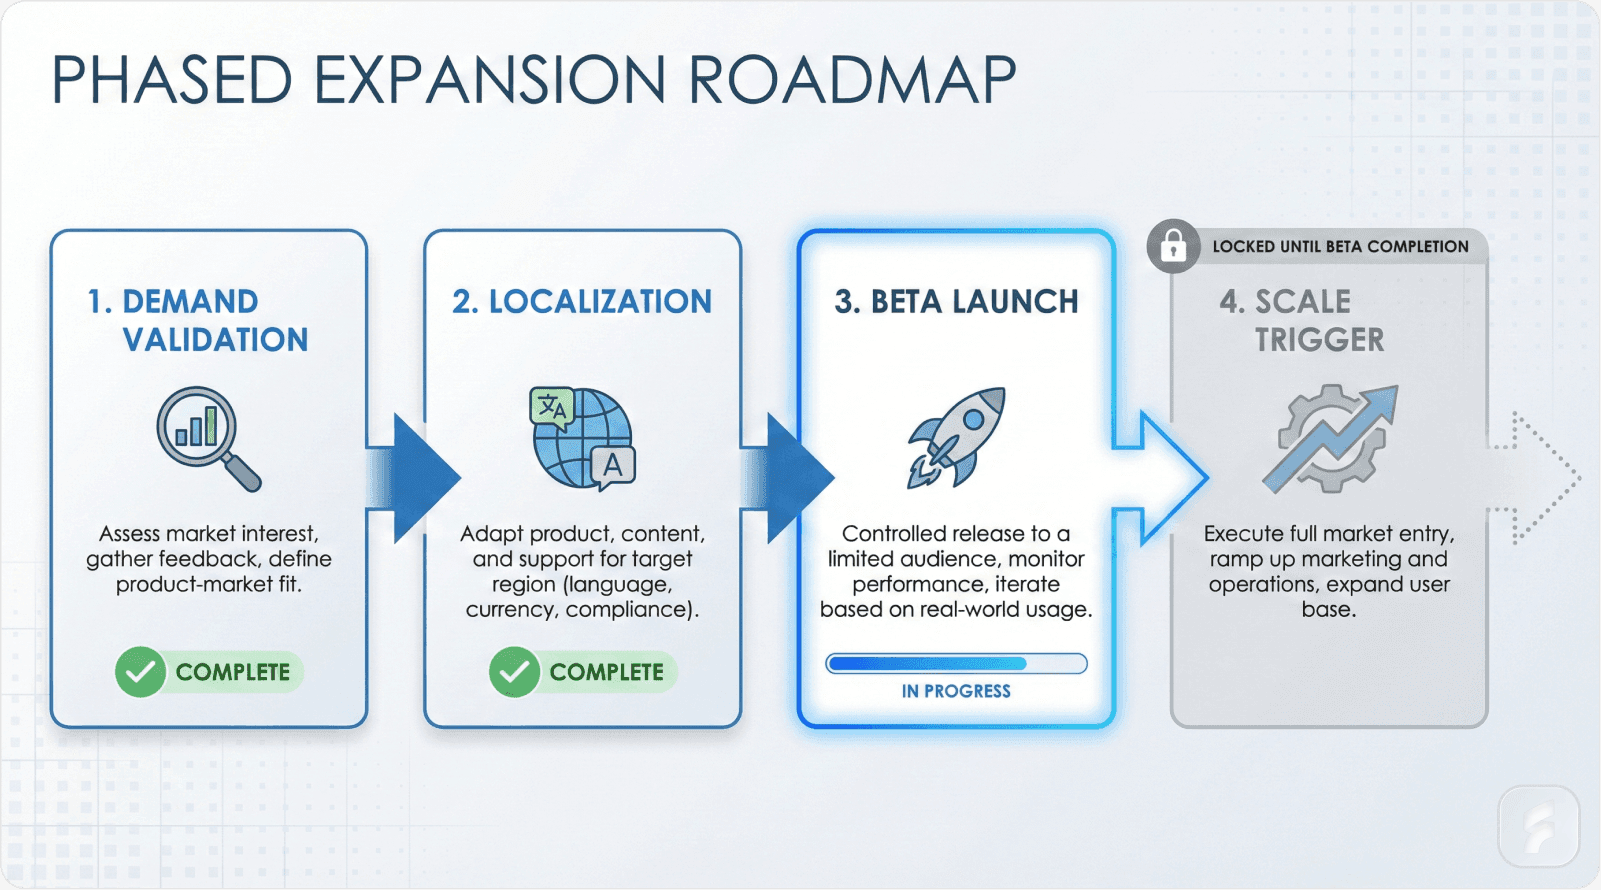
Sequential Market Entry Framework
Successful expansion follows a deliberate sequence rather than simultaneous multi-market launches. The mental model here mirrors product development: validate before scaling.
Phase 1: Demand Validation (90 days)
Begin with market intelligence gathering. Use tools like Google Trends, SimilarWeb, and SEMrush to quantify search volume and competitive intensity. Look for markets with $1 billion+ total addressable market and fewer than five established competitors.
Analyze your existing user base. Where are your international users coming from? What's their activation rate compared to domestic users? Information hierarchy matters—prioritize markets showing both volume and engagement quality.
Phase 2: Localization Assessment (60 days)
"Asia-Pacific software market grows at 22% CAGR through 2033—SaaS founders ignoring mobile-first, compliance-ready localization miss the decade's biggest opportunity." — MarketDataForecast, 2025 Regional Software Analysis
Localization extends beyond translation. It encompasses currency conversion, date formatting, cultural UX adaptation, and regulatory compliance. The interaction cost of poor localization manifests as increased support tickets and elevated churn rates.
Calculate your localization coefficient: total adaptation costs divided by first-year target ARR. Successful market entries maintain this ratio below 15%.
Real-World Execution: HubSpot's Regional Hub Strategy
HubSpot's international expansion demonstrates systematic geographic scaling. In 2018, international revenue represented just 28% of total ARR. By 2025, that figure reached 46% through deliberate infrastructure investment.
Timeline and Milestones:
The company launched three new regional hubs in 2022: Spain, Netherlands, and Québec. Each hub operated as a complete go-to-market unit with local data centers, region-specific pricing in EUR and GBP, and vertical marketing adapted for European agency customers.
Results validated the strategy. European and Australian customer counts tripled within three years. More importantly, international markets now contribute 40%+ of annual recurring revenue with retention curves matching domestic performance.
Strategic Pattern Recognition:
HubSpot began with English-speaking markets—United Kingdom and Australia—before tackling Romance and Germanic language regions. This reduced cognitive load on product, support, and sales teams during initial expansion.
The company used PQL data from organic traffic to prioritize. Markets demonstrating strong product engagement without localized marketing received priority over larger markets with weak engagement signals.
Geographic Expansion Implementation Framework
Step 1: Market Demand Analysis
Deploy a 90-day observation period using Google Trends for search volume trending, SimilarWeb for competitor traffic analysis, and LinkedIn for demographic verification. Track month-over-month changes to distinguish seasonal patterns from sustained demand.
Step 2: Competitive Matrix Development
Build a comprehensive competitive analysis for each target region. Document the top three competitors' pricing models, feature sets, localization depth, and customer acquisition strategies. This creates your competitive friction scoring baseline.
Step 3: Localization Audit Execution
Conduct a full localization requirements assessment. Language translation through services like DeepL, currency and payment gateway integration, date and number formatting, and legal compliance requirements including GDPR, CCPA, and regional data protection laws.
Step 4: Beta Cohort Recruitment
Launch a controlled beta with 50-100 users per target region. Use Product Hunt international launches or LinkedIn geographic targeting to acquire early adopters. Set a minimum activation rate threshold of 20% to validate product-market fit.
Step 5: Partnership Development
Identify local agencies, startup accelerators, and potential distribution partners. According to Nielsen Norman Group research on ecosystem development, partnership channels reduce customer acquisition costs by 30-40% in new markets.
Step 6: Success Metrics Definition
Establish clear expansion success criteria before launch. Minimum viable metrics include 20% activation rate (matching domestic performance), 10% month-over-month growth for 90 days, and $50,000 monthly recurring revenue within six months.
Step 7: Scale Trigger Identification
Define explicit triggers for full market commitment. Typical thresholds include reaching $50,000 MRR per region, maintaining 80%+ customer satisfaction scores, and achieving unit economics matching domestic markets within margin of error.
Geographic Expansion Readiness Checklist
Market Validation Requirements:
Target market exceeds $1 billion total addressable market (verified via Statista or Gartner
Top three competitors identified with documented positioning analysis
Localization cost projection below 15% of first-year ARR target
GDPR, CCPA, and regional compliance requirements mapped
Local currency pricing tested with 100+ users
Mobile optimization complete (critical for Asia-Pacific markets)
Regional data center or partnership agreements in place
Beta launch timeline under 90 days from decision
Product-qualified lead conversion rate exceeds 15%
Local language support team trained and onboarded
Micro-Summary
Geographic expansion succeeds when founders prioritize data over assumptions. Use PQL signals to validate markets, maintain localization costs below 15% of target ARR, and follow sequential entry rather than simultaneous launches. Asia-Pacific's 22% CAGR and established companies' 46% international revenue share demonstrate the opportunity cost of remaining domestic-only.
Strategy 2: Building Scalable Pricing Architecture for Multi-Segment Expansion

The Pricing Optimization Gap
Flat pricing models cap average revenue per user at 30-40% below potential. This represents millions in foregone revenue for mid-stage SaaS companies. Yet 68% of SaaS firms test pricing less than once quarterly despite documented 20-40% revenue upside from optimization.
The root cause isn't complexity avoidance. It's uncertainty about what to test and how to measure results.
Pricing architecture directly impacts expansion capability. Rigid single-tier models force product teams to choose between serving SMB customers or enterprise buyers. Attempting to serve both with one price point satisfies neither segment.
Value Metric Pricing Fundamentals
Definition Block: Value metric pricing bases charges on customer outcome metrics rather than feature access. Instead of "pay $99/month for premium features," companies charge based on measurable usage: active users, storage capacity, workflow executions, or API calls.
This model aligns pricing with delivered value while creating natural expansion revenue as customers grow.
"Value metric pricing grows at double the rate with half the churn. Feature-based pricing guarantees you'll leave money on the table." — Patrick Campbell, CEO of ProfitWell/Paddle
The data supports this assertion. Companies using value-based pricing models experience 40-50% higher average revenue per user compared to feature-based alternatives. More significantly, they demonstrate 50% lower churn rates and 2x faster growth trajectories.
Optimal Tier Structure Analysis
Pricing tier psychology impacts conversion rates and customer lifetime value. Research analyzing 1,500+ SaaS companies identified optimal tier counts between two and seven distinct plans.
Tier Count Impact:
Two-tier models work for simple products with clear customer segmentation. Four-tier models dominate the market as they serve SMB, mid-market, enterprise, and custom segments. Seven-tier structures risk cognitive overload and conversion paralysis.
The sweet spot for most B2B SaaS products sits at three to four tiers. This provides segment flexibility without introducing decision friction during the purchase process.
For expert guidance on product design that supports scalable pricing architecture, explore frameworks that align tier structure with user experience best practices.
Pricing Evolution Case Study: Dropbox's Multi-Tier Journey
Dropbox's pricing transformation illustrates systematic tier development. The company began with a pure freemium model before introducing tiered paid options as customer segments crystallized.
Evolution Timeline:
Initial freemium offering established market presence and user base. The Pro tier at $11.99/month targeted individual power users with storage needs exceeding free tier limits. Business tier at $15/user/month added administrative controls and compliance features for team deployments.
Enterprise tier introduction enabled custom pricing, single sign-on, dedicated support, and service level agreements. This unlocked the high-value segment with average revenue per user 5x higher than SMB customers.
Value Metric Selection:
Dropbox combined storage capacity with active user count as dual value metrics. This created natural expansion revenue as both individual storage needs and team sizes grew over time. Annual subscription options increased grandfathering of legacy pricing while encouraging longer commitment periods.
The results speak clearly: enterprise ARPU reached 500% of SMB tier pricing while maintaining comparable retention curves.
Pricing Architecture Framework
Customer Segmentation Matrix:
Begin with clear segment definition based on company size, use case complexity, and willingness to pay. Small business (1-50 seats) requires simple per-user pricing with minimal setup. Mid-market (50-500 seats) justifies setup fees and advanced features. Enterprise (500+ seats) demands custom pricing with professional services.
Value Metric Selection Process:
Evaluate potential value metrics against three criteria: Does it correlate with customer outcomes? Can customers understand and predict it? Does it create expansion revenue as usage grows?
Common effective value metrics include active users, workflow or process executions, storage consumption, and API request volume. According to research from Gartner on SaaS pricing models, companies using outcome-based metrics see 35% higher net revenue retention.
A/B Testing Protocol:
Structure pricing experiments methodically. Test one variable at a time: flat versus tiered structure first, then value metric options, followed by specific price points. Use tools like ProfitWell or Recurly for experiment management and analysis.
Quick Breakdown: Annual Discount Optimization
Testing 1,000+ SaaS companies identified optimal annual prepayment discounts between 17-20%. Below 17%, conversion to annual plans drops significantly. Above 20%, you're leaving money on the table without proportional retention improvement.
Pricing Implementation Action Plan
Phase 1: Research and Analysis (14 days)
Map three customer segments with corresponding ARR ranges and feature requirements. Build a competitor pricing matrix analyzing five direct rivals. Conduct value metric workshops with product and customer success teams to identify maximum three outcome measurements.
Phase 2: Testing Period (28 days)
Develop three distinct pricing variants for A/B testing. Split signup flow traffic 50/50 between control and test variants. Track 7-day conversion metrics with statistical significance thresholds.
Phase 3: Launch Execution (14 days)
Grandfather existing customer plans to avoid negative retention impact. Provide 14-day advance notice with clear migration paths for customers wanting to switch. Train customer success team on objection handling and upgrade conversations.
Pricing Optimization Checklist
Three customer segments mapped with ARR ranges documented
Competitor pricing matrix complete (minimum five rivals)
Value metric workshop conducted with 3 outcome metrics maximum
Three pricing variants built in billing system
A/B test configured with 50% traffic split
Seven-day conversion tracking dashboard deployed
Grandfathering policy defined for existing customers
Customer notification timeline established (14+ days)
Customer success team trained on pricing objection responses
Migration path documentation complete for all customer segments
Statistical significance calculator configured
Rollback plan documented if tests show negative results
Advanced Pricing Tactics
Anchoring Strategy:
Present the highest-tier enterprise plan first in pricing page layout. This establishes an anchor price making mid-tier options appear more reasonable. Baymard Institute research on e-commerce psychology demonstrates 23% higher conversion to mid-tier plans when premium options anchor the comparison.
Feature Bundling Science:
Bundle complementary features that increase activation likelihood rather than grouping by development cost. Features driving customer success belong in lower tiers; premium tiers should contain features reducing friction for larger organizations like SSO, audit logs, and compliance reporting.
Micro-Summary
Pricing architecture determines expansion ceiling. Value metric models outperform feature-based pricing with 40-50% higher ARPU and 50% lower churn. Optimal tier counts sit between three and four plans for most B2B products. Test systematically, grandfather existing customers during transitions, and align pricing with customer outcome metrics rather than internal feature costs.
Strategy 3: Engineering Product Onboarding for Activation and Retention

The Activation Crisis
More than 50% of new SaaS users remain inactive after their first week. This inactive user cohort represents tremendous economic waste. For a mid-stage SaaS company, poor onboarding costs approximately $1.2 million annually according to 2025 Pendo research on activation economics.
Feature overload during initial user experience creates cognitive overload. Users confronted with dozens of features, settings, and options experience decision paralysis rather than value discovery.
The time-to-value metric determines whether users reach their "aha moment" before abandoning your product. For comprehensive guidance on UX optimization that drives faster activation, explore strategies that reduce friction across the entire user journey.
Personalization Impact Quantified
Personalized onboarding experiences increase feature usage by 29% compared to generic one-size-fits-all flows. This statistic from Pendo's analysis of thousands of SaaS products demonstrates the power of segmentation.
Segmentation Dimensions:
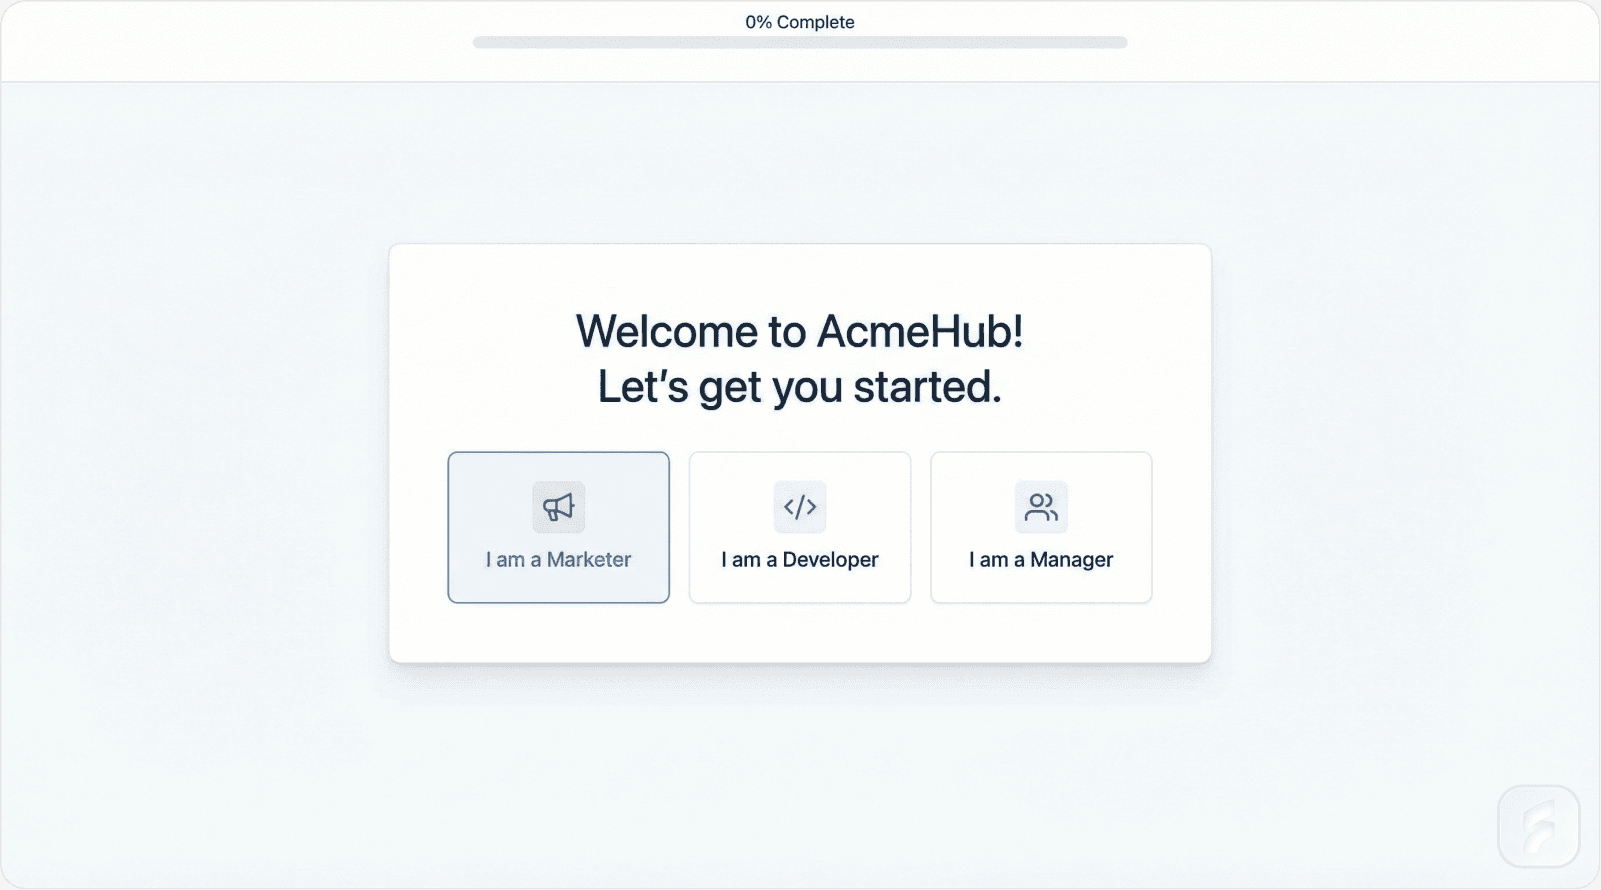
Effective personalization requires identifying meaningful user differences. Common segmentation approaches include role-based paths (admin versus end user), plan-based experiences (trial versus paid), use case clustering (by industry or job function), and company size adaptation (team versus enterprise).
Each segment requires distinct activation milestones and success metrics.
"Guide users to 'aha moment' via personalized in-app experiences plus behavioral triggers. Activation predicts lifetime value better than any demographic." — Intercom Product Guide, 2025 Edition
Checklist-Driven Activation
Interactive checklists increase activation rates by 3x compared to passive documentation. Intercom's research on checklist psychology reveals why: checklists provide clear progress indicators, create small dopamine hits with each completion, and guide users through critical feature sequences.
Formula: Activation Rate Impact
Activation Rate = (Users Completing Critical Actions) / (Total New Users) × 100
For products using segmented checklists, this formula typically yields 60-75% activation versus 20-35% for products without structured onboarding.
Companies implementing checklist-driven onboarding report time-to-value reductions of 50%, translating to 25-40% retention improvements over 90-day cohorts.
Verified Onboarding Case Studies
UserTesting Personalization Results:
UserTesting deployed personalized onboarding tours tailored to user research roles. The result: 29% more users reached the critical "Draft Test" milestone representing their aha moment. This single optimization increased paid conversion by double digits.
GoTo Behavioral Triggers:
GoTo implemented behavior-based onboarding flows adjusting dynamically to user actions. Users who explored team collaboration features received collaboration-focused guidance. Those focused on individual use saw personalized content emphasizing productivity gains.
This adaptive approach generated a 4% trial-to-paid conversion lift—substantial for a mature product with millions of users.
Intercom Plan Segmentation:
Intercom created distinct onboarding paths for each pricing tier. Free users received essential feature orientation. Growth tier customers got advanced automation training. Enterprise tier onboarding included dedicated implementation support.
Task completion rates tripled compared to their previous unified onboarding experience.
Critical User Journey Framework
Onboarding Journey Map:
Identify the minimum viable feature set delivering core value. Map the shortest path from signup to first success. Remove all non-essential steps, settings, and decisions from this critical path.
Time-to-Value Optimization:
Measure time from account creation to first meaningful outcome. For project management tools, this might be creating and sharing a first project. For analytics platforms, generating an initial insight or report. For communication tools, sending a first message or holding a first meeting.
Reduce this timeline aggressively. According to Stanford Human-Computer Interaction research, each additional day in time-to-value correlates with 5-8% activation rate reduction.
Pendo-Intercom Hybrid Onboarding Model
Critical Flow 1: First Project Creation
Deploy a three-step maximum tooltip tour highlighting only essential actions. Create a simple checklist: "Create → Share → Get Feedback." Each step includes a single-sentence explanation and a clear call-to-action button.
Avoid overwhelming users with feature explanations. Focus exclusively on completing the first meaningful action.
Critical Flow 2: Team Collaboration
Implement Slack and email auto-suggest for team invitations. Reduce invitation friction from 5-6 clicks to 1-2 clicks. Provide a brief role-based permissions tour after the first team member joins.
This reduces activation friction while establishing multi-user engagement patterns that dramatically improve retention.
Success Metrics Definition:
Define activation as completing three key actions within 72 hours. This compressed timeframe forces focus on the highest-impact behaviors while user motivation remains high.
For a deeper understanding of how UX audit processes can identify and eliminate friction points in your onboarding flow, explore professional assessment frameworks that validate activation paths.
Comprehensive Onboarding Implementation Checklist
Technical Setup Requirements:
Account creation completes in under 90 seconds
Progressive feature disclosure implemented (advanced features hidden initially)
Mobile app experience achieves parity with web application
Data import functionality supports CSV and API sources
Single sign-on integration complete for enterprise customers
Session persistence prevents login loops during onboarding
Content Framework Development:
Three-minute core value video produced and tested
Interactive templates created (minimum three options per use case)
Success playbook downloadable as PDF resource
Role-specific help documentation organized by persona
In-app messaging sequences drafted for key moments
Tooltip copy tested for clarity and brevity
Cross-Functional Coordination:
Customer success and product management weekly sync established
Segment-specific onboarding paths defined and documented
Seven-day activation goal communicated across organization
User research sessions scheduled for onboarding feedback
Analytics dashboard tracking activation metrics deployed
A/B testing framework established for iterative improvement
Advanced Activation Techniques
Behavioral Email Sequences:
Deploy triggered email campaigns based on user inaction. If a user doesn't complete onboarding step two within 24 hours, send a helpful nudge with a direct link to resume. If they abandon during step three, send a case study showing how similar users succeeded.
McKinsey research on customer engagement demonstrates that behavioral triggers increase completion rates by 35-40% compared to time-based campaigns.
In-App Messaging Strategy:
Use contextual in-app messages rather than interrupting tooltips. When users hover over advanced features, display brief explanatory text. When they complete key actions, provide positive reinforcement and suggest logical next steps.
This approach respects user agency while providing guidance when needed.
Micro-Summary
Onboarding determines whether users activate or churn. Personalized experiences increase feature usage 29% while reducing time-to-value by 50%. Implement segmented, checklist-driven flows focusing on three critical actions within 72 hours. Companies achieving this standard see 25-40% retention improvements and 3x higher activation rates than generic onboarding approaches.
Strategy 4: Building Integration Ecosystems for Network Effects

The Ecosystem Imperative
Siloed SaaS products demonstrate 47% lower retention compared to ecosystem-integrated alternatives. The reason lies in workflow embedding: products integrated into users' daily tools become essential infrastructure rather than optional software.
No integration strategy equals limited workflow penetration. Limited workflow penetration equals high churn vulnerability.
Integration Impact Metrics
Companies with robust integration ecosystems achieve 70% higher retention rates according to UserView analysis of customer success platforms. This retention advantage compounds over time, creating significant lifetime value differentials.
Partnership revenue share among top-performing SaaS firms reaches 20-30% of total ARR. This represents substantial business value from ecosystem development beyond direct retention benefits.
Integration Economics:
Each integration requires engineering investment but reduces customer acquisition cost by embedding your product in existing workflows. The break-even point typically arrives when 15-20% of your user base actively uses a specific integration.
Strategic Integration Prioritization
"Integrations tap existing behaviors for immediate value. Build what users live in daily." — Brian Balfour, Founder of Reforge
Not all integrations deliver equal value. Prioritize based on user request frequency, competitive necessity, and implementation complexity using RICE scoring methodology.
RICE Framework Application:
Reach measures percentage of users requesting or likely to use the integration. Impact scores expected effect on retention and expansion (1-10 scale). Confidence represents data quality supporting the estimates (percentage). Effort quantifies engineering weeks required.
Formula: RICE Score = (Reach × Impact × Confidence) / Effort
Integration Priority Analysis
Slack Integration Example:
Reach: 85% of target customers use Slack daily. Impact: 9/10 (notifications, collaboration, bot commands). Confidence: 95% based on user surveys. Effort: 3 engineering weeks.
RICE Score: (85 × 9 × 0.95) / 3 = 241
Salesforce Integration Example:
Reach: 40% of target customers use Salesforce. Impact: 10/10 (critical for sales team workflows). Confidence: 90% based on enterprise customer interviews. Effort: 8 engineering weeks.
RICE Score: (40 × 10 × 0.90) / 8 = 45
Build Slack integration first despite Salesforce's higher impact due to superior RICE score. This framework prevents building integrations that look strategic but deliver limited actual usage.
Ecosystem Success Story: Zapier's Integration Moat
Zapier built 2,000+ integrations becoming the workflow automation category leader. The company recognized that each integration creates switching costs and network effects.
Strategic Insight:
Slack and Google Drive integrations unlocked 10x growth by embedding Zapier into users' most frequent workflows. Rather than being a destination tool, Zapier became invisible infrastructure enabling other tools to communicate.
The no-code approach democratized automation, expanding total addressable market beyond technical users. This positioned Zapier as essential middleware in the SaaS ecosystem.
Network Effect Compounding:
Each new integration increases value for all existing integrations by creating additional connection possibilities. At 100 integrations, users can create 4,950 unique pairs. At 2,000 integrations, the possibility space explodes to nearly 2 million combinations.
Integration Development Framework
Phase 1: Discovery and Validation
Conduct a comprehensive user tool survey identifying the top ten requested integrations. Build a competitor integration matrix showing which integrations rivals offer. Look for white space—integrations users want but competitors haven't built.
Analyze support ticket data for integration requests. Users explicitly asking for integrations demonstrate active demand worth prioritizing.
Phase 2: Technical Architecture
Develop a public, well-documented API as foundation for all integrations. This enables third-party developers and partners to build connections beyond your core team's capacity.
For strategic guidance on product design that supports API-first architectures, explore frameworks that balance developer experience with end-user value delivery.
Implement two-way data sync as minimum viable integration. One-way data flow limits utility and creates friction in user workflows. Ensure robust error handling and automatic retry logic for API failures.
Phase 3: Launch and Adoption
Create an in-app integration marketplace making discovery frictionless. Users shouldn't need to leave your product to find and enable integrations. Implement one-click authentication using OAuth standards.
Deploy co-marketing webinars with integration partners. These create win-win promotion while educating users on workflow possibilities. Track integration usage via dedicated analytics dashboard to measure adoption and identify optimization opportunities.
Integration Development Checklist
Discovery Phase Requirements:
User tool survey completed identifying top ten requested integrations
Competitor integration matrix built analyzing five primary rivals
Support ticket analysis quantifying integration request frequency
RICE scoring completed for all candidate integrations
Engineering capacity allocated for top three integrations
Build Phase Requirements:
Public API documentation published and maintained
Two-way data synchronization implemented
Error handling and automatic retry logic deployed
Rate limiting and throttling configured
Webhook support enabled for real-time updates
OAuth authentication flow tested across providers
Launch Phase Requirements:
In-app integration marketplace designed and deployed
One-click integration authentication implemented
Co-marketing webinar scheduled with integration partner
Usage tracking dashboard configured in analytics platform
Customer success team trained on integration capabilities
Help documentation created for each integration
Advanced Ecosystem Strategies
Marketplace Revenue Models:
Consider creating a paid integration tier for premium connectors requiring additional infrastructure or support. HubSpot's App Marketplace demonstrates how ecosystem monetization can generate substantial revenue while expanding product utility.
Developer Partnerships:
Establish a formal partner program for developers building on your API. Provide technical support, co-marketing opportunities, and revenue sharing arrangements. This scales integration development beyond internal team capacity.
Micro-Summary
Integration ecosystems drive 70% higher retention by embedding products in daily workflows. Prioritize integrations using RICE scoring rather than executive preference or competitor copying. Build API-first architectures enabling partner-driven expansion. Companies with robust ecosystems achieve 20-30% revenue share from partnership channels while creating significant switching costs for customers.
Implementation Roadmap: From Strategy to Execution
Week 1: Audit and Baseline
Stop building features based on feature-voting roadmaps. Stop using flat pricing that leaves money on the table. Stop deploying generic onboarding that fails to activate users.
Start with comprehensive auditing. Analyze your current pricing structure against value metric opportunities. Review onboarding analytics identifying drop-off points. Survey customers about integration needs and workflow frustrations.
Document baseline metrics for comparison as you implement changes.
Month 1: Quick Wins
Launch your first strategic integration targeting highest RICE score opportunity. Deploy A/B tests for two pricing page variants testing tier structure or value metrics. Implement basic segmentation in onboarding flows distinguishing between user roles or plan types.
These initiatives require minimal engineering investment but generate measurable impact within 30 days.
Quarter 1: Foundation Building
Target 10% expansion revenue mix from upsells, cross-sells, and geographic expansion. This requires systematic approach to customer success, product analytics, and pricing optimization.
Implement product-qualified lead scoring to identify expansion opportunities. Deploy usage-based pricing tiers enabling natural revenue growth. Create segmented onboarding paths for each customer persona.
For a holistic view of how these strategies connect to broader SaaS growth frameworks, explore resources that unify expansion, retention, and product strategy.
Year 1: Systematic Expansion
Build geographic expansion playbook based on PQL data and market research. Launch marketplace for integrations enabling partner ecosystem. Optimize pricing quarterly based on cohort analysis and value metric performance.
Most importantly, establish cross-functional rituals ensuring expansion remains strategic priority rather than tactical afterthought.
Glossary of Key Terms
Activation Rate
Percentage of new users completing critical actions demonstrating product value discovery, typically measured within 7-day window from signup.
Activation Friction
Obstacles preventing users from reaching their aha moment, including complexity, unclear value proposition, or technical issues.
Average Revenue Per User (ARPU)
Total revenue divided by number of active users, key metric for measuring pricing effectiveness and expansion success.
Cognitive Load
Mental processing power required to understand and use product features; excessive cognitive load during onboarding reduces activation rates.
Customer Acquisition Cost (CAC)
Total sales and marketing expenses divided by number of new customers acquired in given period.
Ecosystem Integration
Connections between your product and other tools in customers' workflows, creating switching costs and retention improvements.
Interaction Cost
Combined time and mental effort required for users to complete tasks within product interface.
Mental Models
Users' existing understanding of how software should work, based on previous experience with similar tools.
Net Revenue Retention (NRR)
Revenue from existing customer cohort including expansions, contractions, and churn; measures expansion effectiveness independently from new customer acquisition.
Product-Qualified Lead (PQL)
User demonstrating buying intent through product usage patterns and engagement metrics rather than traditional demographic criteria.
RICE Score
Prioritization framework calculating (Reach × Impact × Confidence) / Effort to objectively rank features, integrations, and initiatives.
Time-to-Value (TTV)
Duration from initial product signup to first meaningful outcome or aha moment for user.
Usability Debt
Accumulated design inconsistencies, unclear flows, and user friction that compound over time reducing product effectiveness.
Value Metric Pricing
Pricing model charging based on customer outcomes (users, workflows, storage) rather than feature access tiers.
Retention Curve
Graph showing percentage of users remaining active over time, used to identify churn patterns and intervention opportunities.
Authoritative References
This article synthesizes research and data from the following institutions and organizations:


