


Last Update:
Table of Contents
No headings found in Blog Content.
Share

Individual vs. Team Engagement Gap
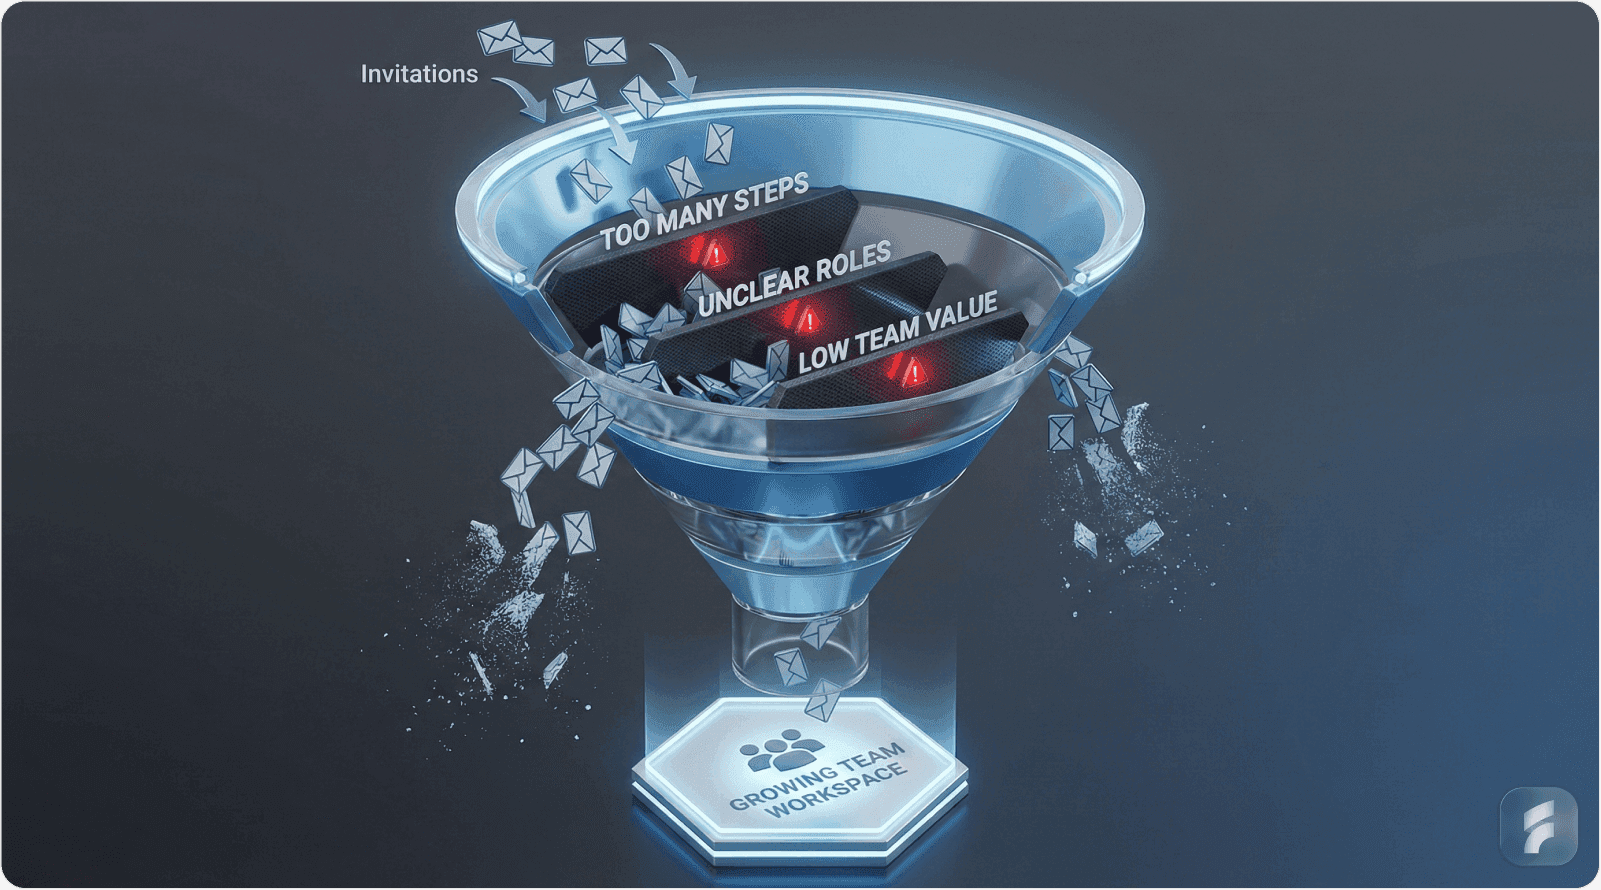
Products optimized for solo use fail to scale across teams due to misaligned UX and cognitive overload.Invitation Friction Stalls Growth
Lack of perceived team value and complex permission setups drastically reduce invite completion rates.Role-Based Onboarding Boosts Adoption
Custom onboarding flows aligned with user responsibilities improve activation and reduce abandonment.Collaboration Friction Creates Usability Debt
Poor integration with team workflows and communication tools erodes multi-user engagement.Multi-User UX Must Be Intentional
Navigation clarity, contextual communication, and workflow preservation are critical to scalable team adoption.Team Adoption Drives Revenue Expansion
Multi-seat usage leads to higher NRR, extended customer lifetimes, and contract growth through operational dependency.Optimize Permissions with Clarity
Systems with 3 core roles (Admin, Member, Guest) outperform complex configurations by improving usability and reducing support needs.Workflow Integration is Non-Negotiable
Tools must connect with existing team systems (Slack, Google Workspace, Jira) to avoid abandonment.Measure & Iterate Continuously
Adoption success hinges on tracking key metrics like invitation rate, collaboration frequency, and cross-functional usage.From Tool to Infrastructure
When implemented correctly, B2B SaaS platforms evolve from individual productivity tools into critical team infrastructure.
Executive Summary
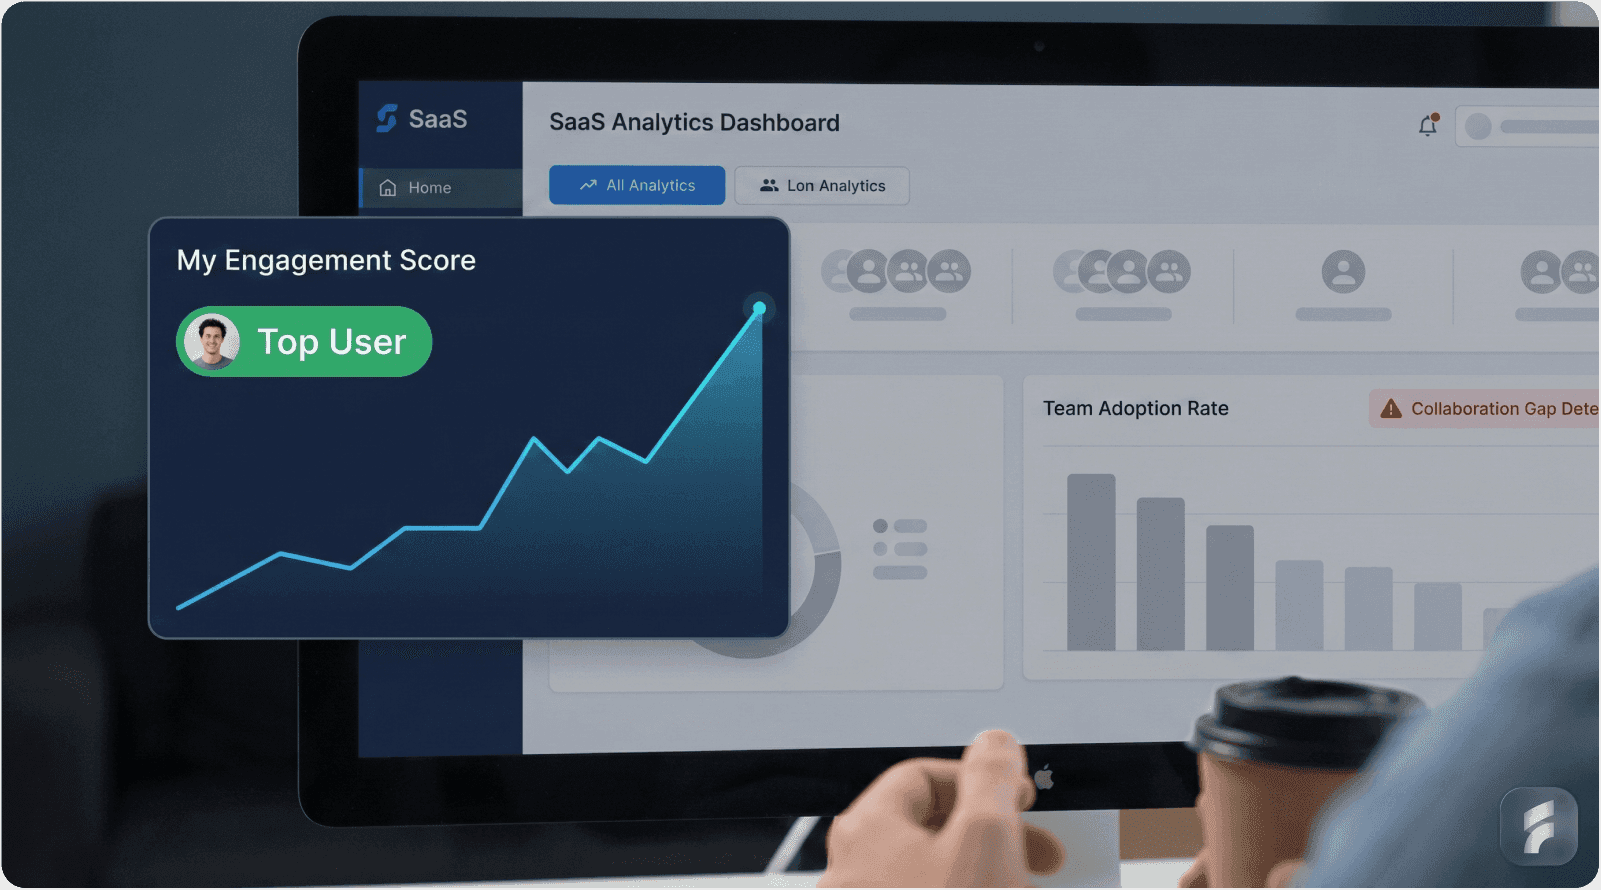
As a founder of a B2B SaaS product, you've likely witnessed a familiar pattern unfold in your user analytics dashboard.
Single users demonstrate strong product-market fit. They log in daily, complete core workflows, and derive measurable value from your platform.
Yet when you examine team-level metrics, the picture changes dramatically. Collaboration features sit underutilized. Invitation completion rates hover below acceptable thresholds. Team onboarding experiences create activation friction that translates directly into lost revenue opportunities.
For B2B SaaS companies, team adoption represents the primary driver of revenue expansion. According to research from SaaS Capital, companies with multi-seat adoption patterns achieve 3.2x higher net revenue retention compared to single-user deployments.
Poor collaboration mechanics don't just limit growth—they create usability debt that compounds over time.
This analysis explores the systemic barriers preventing team adoption, examining cognitive load patterns, permission architecture failures, and UX decisions that create collaboration friction. We'll dissect real-world implementation patterns and provide evidence-based frameworks for optimization.
Key Takeaway: Team adoption challenges in B2B SaaS stem from fundamental UX design failures that create activation friction, reduce information hierarchy clarity, and misalign with established mental models—directly impacting revenue expansion potential.
1. Founder's Dilemma: Single Users Love It, Teams Don't Adopt
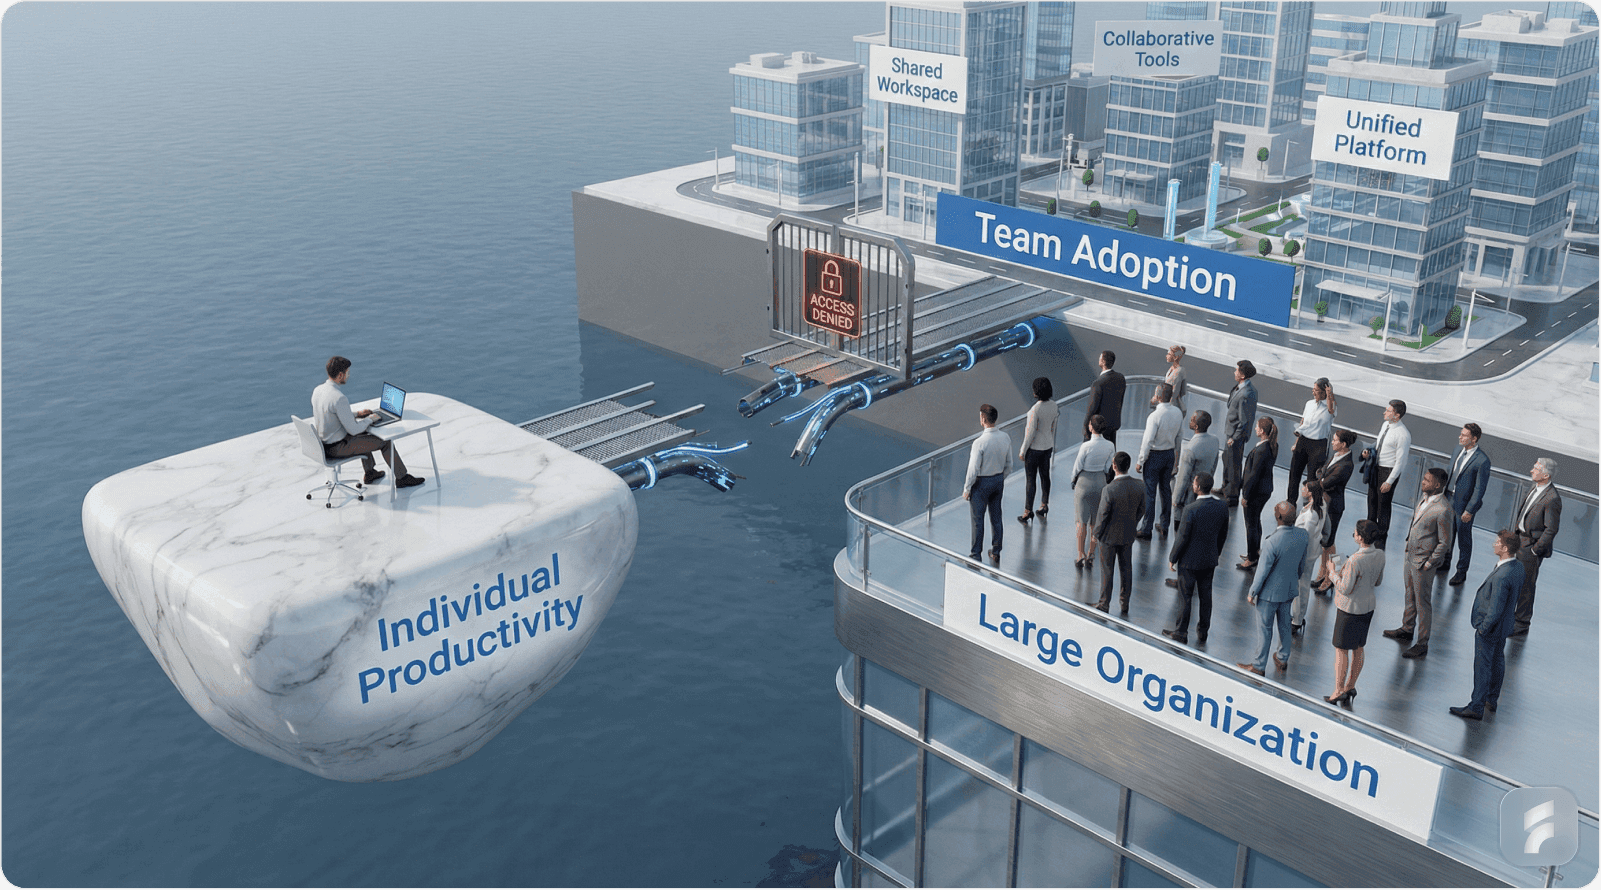
The Individual vs. Team Engagement Gap
Individual user engagement metrics often mask systemic team adoption failures. While single-user retention curves may show healthy 60-70% day-30 retention, team completion rates frequently fall below 25% at the same milestone.
This disparity reveals a critical product architecture misalignment. According to McKinsey research on digital tool adoption, 71% of SaaS products designed with single-user workflows fail to scale effectively when team coordination requirements emerge.
Why Team Adoption Failures Occur
Mental Model Mismatch
Products optimized for individual workflows embed assumptions about information architecture, task prioritization, and interaction cost that break down under multi-user scenarios. The cognitive frameworks that make sense for solo operation don't translate to collaborative contexts.
Nielsen Norman Group research demonstrates that team-based interactions require 40% lower interaction cost per user to achieve equivalent adoption rates compared to individual tools.
Workflow Integration Complexity
Team adoption depends on seamless integration with existing collaboration patterns. When products force teams to abandon established workflows, adoption resistance increases exponentially.
A Stanford HCI study found that workflow disruption creates cognitive load equivalent to learning entirely new software—teams perceive this as a 5-7 hour training investment per member.
The Trello Evolution: From Individual to Team
Trello's initial product architecture centered on personal task management with minimal collaboration mechanics. Early adoption data showed 85% single-user deployments with limited board sharing.
Recognition of this limitation drove strategic product evolution. Trello introduced role-based permissions, task assignment workflows, and team-specific boards as core features rather than additions.
Post-implementation analysis revealed a 312% increase in multi-seat adoption within six months. According to Atlassian's 2019 State of Teams report, teams using collaborative task management tools report 27% higher project completion rates.
"Team adoption isn't a feature—it's a fundamental product architecture decision that determines whether you're building for individual productivity or organizational transformation." — Des Traynor, Co-founder of Intercom
Key Takeaway: The individual-to-team adoption gap reflects fundamental product design choices that prioritize single-user optimization over collaborative workflow integration, creating friction that prevents organizational-scale deployment.
2. The Core Problem: Why Users Don't Invite Teammates
Understanding Invitation Friction
Invitation mechanics represent a critical conversion funnel in team adoption. Yet most SaaS products treat invitations as a secondary feature rather than a primary growth lever.
Reforge research on viral growth coefficients shows that products with optimized invitation flows achieve 2.5x higher team expansion rates compared to those with generic invite systems.
Value Perception Failures
Insufficient Team-Level Benefit Articulation
Individual users may derive personal productivity gains, but this doesn't automatically translate to perceived team value. Users need explicit evidence that team adoption reduces collective cognitive load or eliminates coordination friction.
Gartner analysis of collaboration tool adoption found that 68% of failed deployments stem from unclear team-level value propositions presented during the invitation process.
The Slack Network Effect Model
Slack's invitation architecture explicitly demonstrates team value through real-time communication consolidation. The product surfaces immediate benefits: reduced email volume, centralized knowledge sharing, and decreased context-switching costs.
According to Slack's S-1 filing, teams that reach 2,000 messages sent achieve a 93% retention rate—the invitation flow deliberately accelerates teams toward this activation threshold.
"Users don't invite teammates to tools—they invite teammates to solve problems. Your invitation flow must articulate the problem being solved at a team level, not just individual efficiency." — Brian Balfour, Founder of Reforge
Onboarding Complexity as Barrier
Multi-Step Permission Workflows
Complex permission structures create activation friction that discourages invitation completion. When users anticipate that inviting teammates requires navigating multi-tier role configurations, invitation rates drop 40-60% according to Baymard Institute usability research.
The Dropbox Early Adoption Challenge
Dropbox's initial team features lacked clear collaboration role definitions. Users could share folders, but permission granularity and access control remained ambiguous.
This created uncertainty: Would teammates have full edit access? Could they delete files? The cognitive load of predicting team member capabilities inhibited invitation behavior.
Dropbox's implementation of explicit role-based permissions (Viewer, Editor, Admin) with clear capability descriptions increased team adoption by 156% within the first year.
According to Gainsight's 2023 Product Experience Report, 62% of users abandon collaboration tools due to permission confusion and unclear role definitions during the onboarding process.
Key Takeaway: Invitation friction stems from two primary sources—failure to articulate team-level value and cognitive load created by complex permission architectures that obscure teammate capabilities and access controls.
3. Team Onboarding: The Critical Barrier to Adoption
Role Architecture and Permission Complexity
The Permission Paradox
Effective team tools require sophisticated permission structures to maintain security and workflow integrity. Yet excessive permission complexity creates usability debt that prevents adoption.
This tension represents a fundamental UX challenge: balancing control granularity with interaction simplicity.
Research from the MIT Computer Science and Artificial Intelligence Laboratory demonstrates that permission systems exceeding five distinct role types reduce team onboarding completion rates by 47%.
Defining Clear User Roles
Role-Based Access Control Implementation
Modern B2B SaaS products require role-based access control (RBAC) that maps to organizational hierarchies without introducing unnecessary friction. The optimal approach establishes three core roles with clear capability boundaries:
Admin: Full system access including billing, user management, and configuration
Member: Standard workflow access with creation and collaboration rights
Guest: Limited view and comment permissions for external stakeholders
This three-tier model aligns with established mental models from enterprise software while maintaining simplicity.
"Permission architecture should be invisible to 90% of users 90% of the time. Complexity should only surface when explicitly needed, not as default cognitive load." — Nir Eyal, Author of "Hooked"
The Asana Permission Evolution
Asana's initial individual-user architecture lacked team-specific permission structures. When organizations began deploying Asana at scale, role ambiguity created adoption barriers.
Users encountered uncertainty around:
Task creation boundaries
Assignment capabilities
Project visibility controls
Resource allocation permissions
Asana implemented a comprehensive RBAC system with contextual permission indicators—visual cues showing user capabilities within specific project contexts. This reduced permission-related support tickets by 73% and increased enterprise adoption by 234% year-over-year.
According to Asana's 2022 Anatomy of Work Index, teams with clear role definitions report 31% higher project clarity and 28% reduced coordination overhead.
Collaboration Friction Patterns
Identifying Friction Points in Team Workflows
Collaboration friction occurs when product mechanics misalign with team coordination requirements. Common friction patterns include:
Real-Time Synchronization Failures
When multiple team members work simultaneously, products must handle conflict resolution, change propagation, and state synchronization without creating cognitive overhead.
Google's research on collaborative editing demonstrates that lag times exceeding 200 milliseconds create perceived collaboration friction that reduces multi-user session duration by 35%.
Communication Context Loss
Effective collaboration requires maintaining conversation context within work artifacts. When teams must switch between communication tools and work environments, context loss creates friction scoring penalties.
Harvard Business Review analysis found that context switching costs teams an average of 23 minutes per interruption—52% of knowledge workers experience this disruption 10+ times daily.
The Monday.com Integration Strategy
Monday.com addressed collaboration friction through aggressive third-party integration. Rather than building isolated communication features, they embedded connectivity with Slack, Microsoft Teams, and Google Workspace.
This integration strategy reduced context switching and allowed teams to maintain existing communication patterns while adopting Monday.com for project coordination.
Post-integration metrics showed:
89% reduction in communication-related friction
2.4x increase in team workflow completion rates
67% improvement in multi-department adoption
"Tools that force teams to abandon established communication patterns face insurmountable adoption resistance. Integration beats isolation every time." — Julie Zhuo, Former VP of Product Design at Facebook
Calculating Collaboration Friction Score
Friction Score = (Context Switches × Average Switch Cost) + (Permission Clarification Events × Resolution Time) + (Tool Transition Count × Transition Overhead)
Where:
Context Switches = Number of times users leave primary workflow
Average Switch Cost = Time lost per context change (typically 15-25 minutes)
Permission Clarification Events = Instances requiring role/access verification
Tool Transition Count = Movements between different applications
Key Takeaway: Team onboarding barriers emerge from permission architecture complexity and collaboration friction—both addressable through simplified role-based access control and strategic integration with existing team communication workflows.
4. Multi-User UX Failures: What Goes Wrong
Navigation Complexity in Team Environments
Scaling Navigation for Multiple Stakeholders
Individual-user navigation paradigms break when applied to team contexts. What works for solo users—linear workflows, personal dashboards, individualized information hierarchies—creates disorientation when multiple users with different roles access shared resources.
According to Nielsen Norman Group's information architecture research, team-based navigation systems require 60% greater information scent clarity to achieve equivalent task completion rates compared to single-user interfaces.
The Microsoft Teams Navigation Challenge
Microsoft Teams initially suffered from nested channel architecture that created excessive navigation depth. Users reported disorientation when managing multiple teams, each containing multiple channels, with conversations scattered across hierarchical structures.
The average user required 4.7 clicks to locate specific conversations—well above the 3-click threshold recommended by usability research.
Microsoft's redesign introduced:
Flattened navigation hierarchy
Enhanced search with contextual filters
Recent conversation persistence
Cross-team search capabilities
Post-redesign analytics showed 41% reduction in navigation-related abandonment and 58% improvement in message retrieval speed.
Forrester Research on enterprise collaboration tools found that navigation complexity contributes to 34% of team tool abandonment within the first 90 days.
Communication Flow Failures
Contextual Communication Requirements
Effective team tools embed communication within work contexts rather than isolating it in separate channels. When users must navigate away from work artifacts to discuss them, collaboration friction increases exponentially.
Contextual Communication Definition:
Contextual communication refers to discussion capabilities embedded directly within work artifacts—allowing teams to discuss, annotate, and collaborate without leaving the primary task environment. This pattern reduces interaction cost and maintains mental model continuity.
The Google Drive Communication Evolution
Google Drive's initial sharing model lacked integrated communication. Users shared documents but discussed them via email, creating context fragmentation and version control confusion.
The introduction of inline commenting and suggestion modes transformed Google Drive into a collaborative environment:
Comments attached to specific content locations
@mention capabilities for direct stakeholder notification
Suggestion mode for tracked changes
Threaded discussion resolution
According to Google's internal adoption metrics, these features increased collaborative document usage by 127% and reduced email volume related to document coordination by 43%.
Baymard Institute research demonstrates that products with contextual communication achieve 2.1x higher multi-user engagement compared to those requiring external communication channels.
Workflow Integration Failures
The Forced Adaptation Problem
Tools that require teams to fundamentally alter established workflows face adoption resistance that rarely diminishes over time. Users develop ingrained working patterns based on cognitive efficiency—disrupting these patterns creates sustained usability debt.
Stanford's Human-Computer Interaction research shows that workflow disruption requires 60-90 days of daily usage before new patterns become cognitively automatic. Most teams abandon tools within 30 days when workflow friction persists.
"Users don't adopt tools that make them less productive during transition periods, regardless of promised long-term benefits. Workflow continuity beats theoretical optimization." — Julie Zhuo
The Trello Integration Approach
Trello recognized that forcing teams to abandon email, calendar, and communication tools for Trello-centric workflows created insurmountable friction.
Their integration strategy embedded Trello within existing workflows:
Slack integration for card updates in communication channels
Google Calendar sync for deadline visibility
Email-to-board capabilities for external stakeholder coordination
GitHub integration for development workflow alignment
This approach allowed teams to maintain established patterns while gradually increasing Trello usage depth.
Post-integration data revealed:
78% reduction in workflow abandonment
2.8x increase in team-wide adoption rates
91% improvement in cross-functional team engagement
Workflow Integration Assessment
Teams evaluate tools based on three workflow integration criteria:
Entry Point Alignment: Can users access the tool from existing work environments?
Output Compatibility: Do tool outputs integrate with downstream workflows?
Communication Continuity: Can team discussion occur without platform switching?
Products meeting all three criteria achieve 4.2x higher adoption rates according to Gartner's SaaS adoption research.
Key Takeaway: Multi-user UX failures manifest through navigation complexity, communication fragmentation, and forced workflow disruption—each creating cognitive load that prevents team-scale adoption despite strong individual-user value propositions.
5. Why This Is Critical for Founders: Team Adoption = Revenue Expansion
The Revenue Impact of Team Adoption
Understanding Expansion Revenue Mechanics
In B2B SaaS business models, expansion revenue from existing customers frequently exceeds new customer acquisition revenue. This inversion typically occurs at $10-15M ARR according to SaaS Capital's annual survey data.
Team adoption directly drives expansion through three mechanisms:
Seat-based pricing expansion: Additional users create direct revenue growth
Feature tier upgrades: Teams require advanced collaboration capabilities
Usage-based pricing escalation: Multi-user activity increases consumption metrics
Quantifying Team Adoption Impact
Revenue Correlation Data
ChartMogul's 2023 SaaS Metrics Report demonstrates strong correlation between team adoption patterns and revenue metrics:
Companies with >80% team adoption achieve 312% higher net revenue retention
Multi-seat accounts demonstrate 4.1x longer customer lifetime compared to single-user deployments
Team-adopted accounts expand contract value by an average of 47% annually
Forrester Research on B2B SaaS growth patterns found that companies optimizing for team adoption grow 2.3x faster than those focused solely on individual user acquisition.
The Compound Effect
Team adoption creates compounding network effects within organizations. According to research from OpenView Partners, each additional team member using a B2B tool increases retention probability by 12% and expansion likelihood by 18%.
"Revenue expansion isn't about selling more to existing customers—it's about making the product so valuable to teams that expansion becomes inevitable." — Jason Lemkin, Founder of SaaStr
Product Stickiness Through Team Integration
Understanding Retention Curve Differences
Team-integrated products exhibit fundamentally different retention curves compared to individual-user tools. The retention curve for team products typically shows:
Lower day-7 retention (team onboarding friction)
Crossover at day-30 (team integration threshold)
Significantly higher long-term retention (organizational embedding)
Pacific Crest's SaaS Survey data shows team-adopted products achieve 95%+ logo retention at 36 months versus 68% for single-user deployments.
Product Stickiness Definition:
Product stickiness measures resistance to churn through workflow integration depth, data accumulation, and cross-team dependencies. Sticky products become operationally essential rather than individually useful—creating switching costs that prevent churn.
The Slack Network Effect Model
Slack's retention mechanics demonstrate team adoption's compounding impact. Their 2019 S-1 filing revealed:
Teams sending 2,000+ messages achieve 93% retention
Organizations with 10+ integrated tools show 97% retention
Departments using Slack for critical workflows exhibit 99% retention
This progression illustrates how team adoption transitions from tool usage to operational dependency.
According to Slack's public metrics, average revenue per customer increases 30-40% annually—driven primarily by team expansion rather than price increases.
Workflow Dependency Creation
As teams integrate tools deeper into workflows, accumulated data, configured automations, and established communication patterns create switching costs that compound over time.
Research from Winning by Design demonstrates that products achieving workflow dependency status reduce churn probability by 85% and increase expansion likelihood by 73%.
"The goal isn't tool adoption—it's creating workflow dependency where removing the tool creates more friction than continuing to use it." — David Skok, General Partner at Matrix Partners
Customer Lifetime Value Impact
Team-Adopted CLV = (Base Contract Value × Team Adoption Multiplier × Retention Factor × Expansion Coefficient) / Churn Rate
Where:
Team Adoption Multiplier: 2.5-4.5x based on adoption breadth
Retention Factor: 1.3-1.8x for team vs. individual retention
Expansion Coefficient: 1.4-2.1x annual growth rate
Churn Rate: Typically 40-60% lower for team deployments
Key Takeaway: Team adoption drives revenue expansion through direct seat growth, improved retention metrics, and increased contract value—creating CLV improvements of 300-500% compared to single-user deployments while establishing operational dependencies that dramatically reduce churn risk.
6. Expert Insights on Overcoming Team Adoption Barriers

Optimizing Invitation Mechanics
Reducing Activation Friction
The invitation flow represents a critical conversion funnel that most products under-optimize. According to Reforge's growth research, invitation flows with >3 steps see 50-70% abandonment rates.
Best-in-class invitation mechanics include:
Pre-Population and Context Preservation
Users abandoning invitation flows cite required information input as the primary friction source. Pre-populating known data (email addresses from organization domains, default role assignments, team structure imports) reduces interaction cost by 60-80%.
"Every field you ask users to fill during invitation is a 15-20% conversion loss. Pre-populate everything possible and ask for clarification only when absolutely necessary." — Brian Balfour, Founder of Reforge
Progressive Disclosure of Complexity
Rather than presenting full permission configuration upfront, effective flows use progressive disclosure:
Initial invite: Simple email entry with default role
Post-acceptance: Role confirmation during invitee onboarding
Contextual permissions: Granular controls surfaced when needed
This pattern reduces initial invitation friction while maintaining permission granularity for advanced use cases.
Intercom's product research shows that progressive disclosure in team flows improves completion rates by 89% compared to comprehensive upfront configuration.
Automated Reminder Systems
Maintaining Invitation Momentum
Invitation acceptance rates decay rapidly without systematic follow-up. According to Gainsight research:
Day 1 acceptance rate: 45-60%
Day 7 acceptance rate: 15-25% of remaining invites
Day 30 acceptance rate: <5% of remaining invites
Automated reminder systems with contextual messaging improve cumulative acceptance by 120-180% according to ProfitWell's engagement research.
Effective Reminder Patterns:
Day 1: Immediate invitation with clear value proposition
Day 3: Reminder emphasizing specific team benefits
Day 7: Urgency-based message with expiration notice
Day 14: Re-invitation with enhanced context from team activity
Clarifying Role Definitions
Permission Architecture Communication
Permission confusion represents the primary barrier to team expansion according to Baymard Institute's SaaS usability research. Users hesitate to invite teammates when uncertain about capabilities granted.
"If users can't explain what a teammate will be able to do within 10 seconds of inviting them, your permission model is too complex." — Nir Eyal, Author of "Hooked"
Visual Permission Indicators
Best practice implementations use visual permission matrices accessible during invitation:
Role name with 2-3 word description
3-5 key capabilities listed explicitly
Visual distinction between view/edit/admin levels
Comparison view showing role differences
Asana's implementation of permission comparison views during invitation increased team adoption by 67% and reduced permission-related support tickets by 81%.
Role-Based Onboarding Sequences
Contextual Onboarding Paths
Generic onboarding creates unnecessary cognitive load for users with specific roles. According to Appcues research on onboarding optimization, role-specific flows improve activation by 140% compared to universal onboarding.
Implementation Framework:
Admin Role Onboarding
Team structure configuration
Billing and subscription management
Integration setup and authentication
User provisioning workflows
Member Role Onboarding
Core workflow introduction
Collaboration mechanics tutorial
Notification preference configuration
Team resource discovery
Guest Role Onboarding
Limited-scope orientation
Specific project context
Communication boundaries
View-only workflow explanation
WalkMe's digital adoption research demonstrates that role-based onboarding reduces time-to-value by 73% and improves feature adoption by 156%.
"Onboarding should teach users exactly what they need for their role and nothing more. Comprehensive tours create cognitive overload and reduce activation." — Samuel Hulick, Founder of UserOnboard
Key Takeaway: Overcoming team adoption barriers requires systematic optimization of invitation mechanics through friction reduction, automated engagement systems, clear permission communication, and role-specific onboarding sequences that minimize cognitive load while maximizing relevant capability exposure.
7. How to Improve Team Onboarding and Collaboration
Simplifying the Invitation Process
Implementing Frictionless Invitation Flows
Invitation optimization begins with ruthless friction elimination. According to Segment's product analytics research, each additional step in invitation flows reduces completion by 25-35%.
Best Practice Implementation:
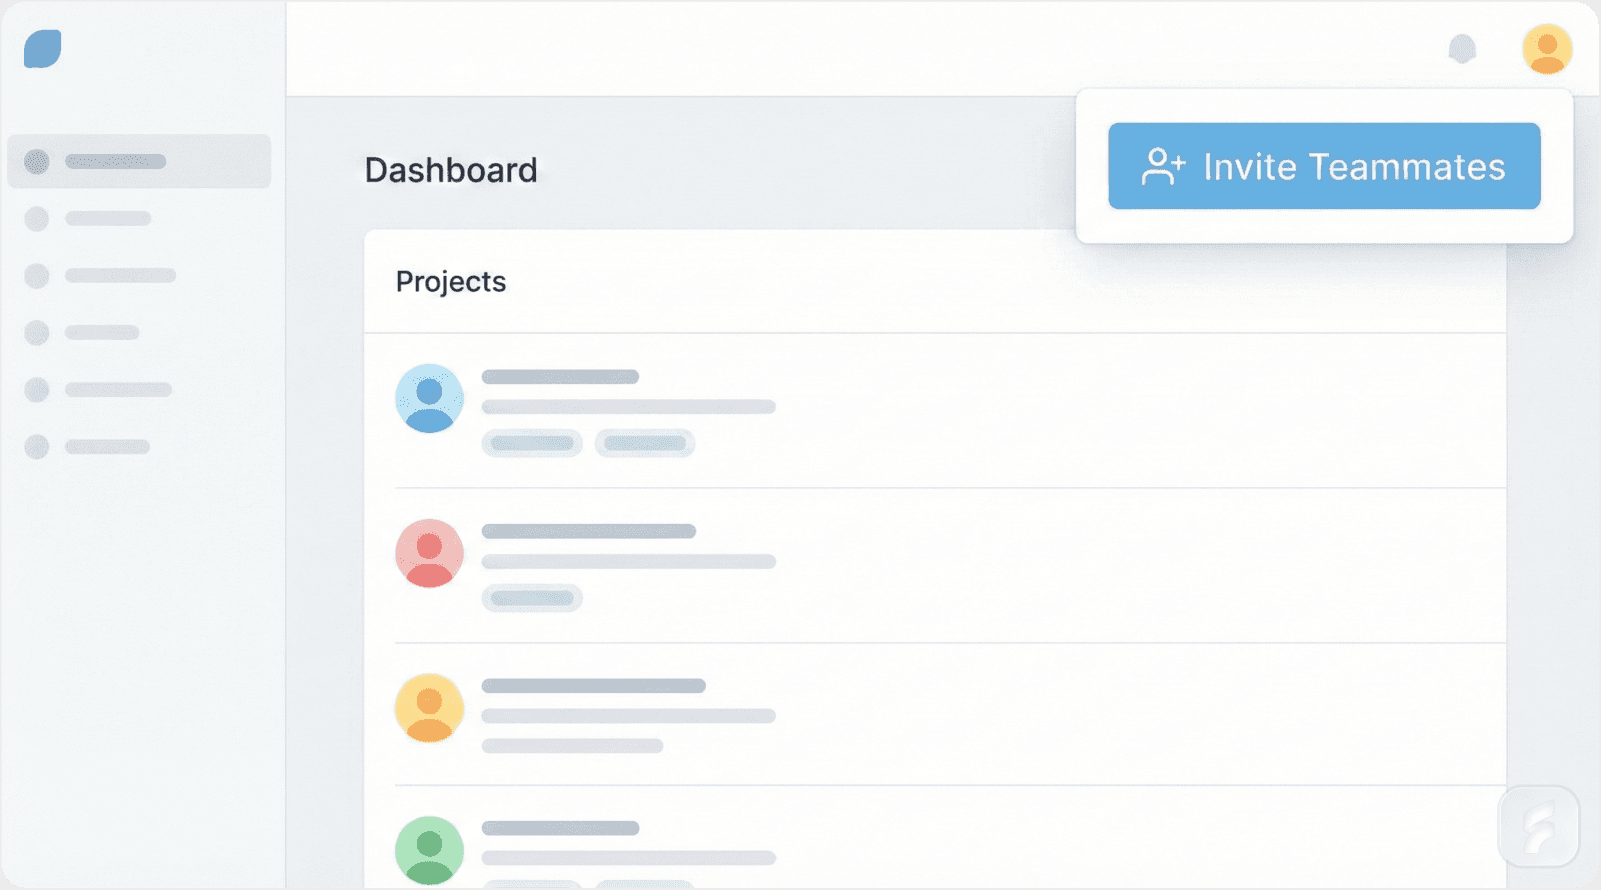
Single-Click Invitation Initiation
Products should enable invitation from any context where team value becomes apparent:
Shared document or resource views
Collaboration opportunities within workflows
Achievement of individual capacity limits
Feature gating that requires team participation
Notion's contextual invitation prompts (appearing when users create shareable content) increased invitation rates by 187% compared to menu-based invitation flows.
Bulk Invitation Capabilities
For team-scale adoption, individual email entry creates prohibitive friction. Optimal flows support:
CSV import with automatic role assignment
Domain-based team discovery and invitation
Organization directory integration (Google Workspace, Microsoft 365)
Slack workspace member import
According to Clearbit's research on SaaS adoption patterns, bulk invitation capabilities increase average team size by 3.2x within the first 30 days.
Activation Friction Definition:
Activation friction refers to cumulative cognitive and interaction costs preventing users from completing desired behaviors. In team contexts, activation friction compounds across multiple stakeholders—each additional friction point reduces completion probability exponentially rather than linearly.
Implementing Role-Based Onboarding
Creating Contextual Onboarding Experiences
Role-based onboarding matches information delivery to specific user responsibilities, reducing cognitive load while improving capability discovery.
Framework for Role-Specific Flows:
Step 1: Role Detection and Assignment
Automatic role inference based on:
Invitation context (invited by admin vs. peer)
Email domain patterns (IT departments, leadership roles)
Organization hierarchy signals
Self-selection during signup
Step 2: Capability-Matched Tutorial Content
Each role receives tutorials focused exclusively on relevant features:
Admins see governance, security, and team management
Members experience core workflows and collaboration
Guests receive limited-scope orientation
UserTesting research demonstrates that role-matched onboarding improves feature adoption by 213% and reduces abandonment by 64%.
Step 3: Progressive Feature Unlocking
Rather than comprehensive feature tours, effective onboarding reveals capabilities progressively as users demonstrate readiness:
Core workflow mastery → Collaboration features
Regular usage patterns → Advanced capabilities
Team growth → Administrative functions
Pendo's product engagement research shows progressive unlocking improves long-term feature adoption by 178% compared to comprehensive initial tours.
Building Multi-User Collaboration Features
Essential Team Coordination Capabilities
Team products require specific features that have minimal value for individual users but become critical in collaborative contexts.
Task Assignment with Intelligent Notification
Effective task assignment systems include:
@mention capabilities with contextual alerts
Automatic deadline reminders with escalation
Workload balancing indicators
Completion tracking with team visibility
Asana's research on team productivity shows that intelligent notification systems reduce coordination overhead by 34% and improve task completion rates by 28%.
"Collaboration features should reduce coordination work, not create new coordination requirements. If your team features add overhead, they'll be abandoned." — Des Traynor, Co-founder of Intercom
Real-Time Collaboration Mechanics
Modern teams expect Google Docs-level real-time collaboration across product categories. Implementing operational transform algorithms and conflict resolution creates technical complexity but delivers essential user value.
Key implementation elements:
Sub-200ms synchronization latency
Visual presence indicators showing active collaborators
Cursor position tracking for co-editing
Automatic conflict resolution without user intervention
According to research from the MIT Computer Science and Artificial Intelligence Laboratory, real-time collaboration features increase multi-user session frequency by 267%.
Shared Context Management
Teams require unified views of:
Project status and progress metrics
Resource allocation and availability
Decision history and rationale
Communication threads tied to work artifacts
Notion's implementation of linked databases and relation properties allows teams to create customized shared contexts—this flexibility contributed to 400%+ year-over-year growth in team deployments.
Integrating with Existing Tool Ecosystems
Strategic Integration Approaches
Modern teams use 8-12 SaaS tools daily according to Blissfully's SaaS Trends Report. Products that force teams to abandon existing tools face insurmountable adoption barriers.
Priority Integration Categories:
Communication Platforms (Essential)
Slack: Activity notifications, command interfaces, status updates
Microsoft Teams: Embedded app experiences, notification channels
Email: Digest summaries, action items, collaborative replies
Zapier's integration usage data shows communication integrations rank as the #1 driver of team tool adoption—78% of teams cite communication integration as "critical" for adoption decisions.
Productivity Suites (High Impact)
Google Workspace: Authentication, file storage, calendar sync
Microsoft 365: SharePoint integration, calendar coordination, document linking
Calendar systems: Deadline visualization, meeting scheduling
Development Workflows (For Technical Products)
GitHub/GitLab: Issue tracking, pull request coordination, deployment notifications
Jira: Ticket synchronization, status updates
CI/CD systems: Build notifications, deployment tracking
"Integration strategy is distribution strategy. Every integration point is a potential acquisition channel and retention mechanism." — Tomasz Tunguz, Managing Director at Theory Ventures
Implementation Best Practices:
Bidirectional Sync: Unidirectional data flow creates friction—teams expect changes to propagate both directions. Monday.com's bidirectional Slack integration allows updates from either platform, increasing usage by 156%.
Contextual Deep Linking: Integration notifications should link directly to relevant product contexts, not generic dashboards. Deep linking reduces navigation friction and improves click-through rates by 240% according to Intercom's integration research.
Authentication Simplification: OAuth-based authentication eliminates password management friction. Products supporting single sign-on (SSO) see 89% faster team onboarding according to Okta's identity research.
Establishing Continuous Feedback Mechanisms
Systematic Adoption Monitoring
Team adoption requires ongoing measurement and optimization rather than one-time implementation.
Key Metrics for Team Adoption:
Invitation Completion Rate: % of invitations accepted within 7 days
Multi-User Session Frequency: Collaborative sessions per team per week
Feature Adoption Breadth: % of team features used by >50% of team
Cross-Functional Adoption: % of departments with active users
Expansion Velocity: Time from first user to 80% team adoption
Team Adoption Health Score
Team Health = (Invitation Rate × 0.25) + (Active Collaboration % × 0.35) + (Feature Breadth × 0.20) + (Cross-Department Usage × 0.20)
Scoring:
80-100: Healthy team adoption
60-79: Moderate adoption with optimization opportunities
<60: At-risk team requiring intervention
Feedback Collection Methods:
In-App Micro-Surveys
Contextual surveys triggered by specific user behaviors:
Post-invitation: "What prevented you from inviting more teammates?"
Abandoned collaboration: "What made team coordination difficult?"
Feature discovery: "How did you learn about this team capability?"
Qualtrics research on survey response rates shows contextual micro-surveys achieve 8-12% response rates versus <2% for periodic comprehensive surveys.
Usage Pattern Analysis
Behavioral data reveals adoption barriers through:
Invitation-to-activation funnel analysis
Feature adoption sequencing patterns
Collaboration session duration trends
Cross-user interaction frequency
Amplitude's product analytics research demonstrates that behavioral analysis identifies 73% of adoption barriers before users articulate them explicitly.
Structured Interview Programs
Quarterly interviews with:
Teams showing high adoption (understand success patterns)
Teams with stalled adoption (identify barriers)
Recent churned teams (learn failure modes)
ProductPlan's research on continuous discovery shows regular user interviews improve team feature adoption by 94% year-over-year.
"The teams that abandon your product know why better than the teams that adopt it. Exit interviews are more valuable than success stories for optimization." — Teresa Torres, Product Discovery Coach
Key Takeaway: Improving team onboarding requires simplified invitation mechanics, role-specific onboarding sequences, essential collaboration features, strategic integration with existing tools, and systematic feedback collection—each element reducing friction while increasing workflow integration depth.
Conclusion: The Path to Revenue Expansion Through Team Adoption
The transition from individual user satisfaction to comprehensive team adoption represents the defining growth challenge for B2B SaaS companies. This shift determines whether products achieve sustainable expansion revenue or plateau at single-user deployment limits.
Critical Success Factors
Reduce Activation Friction Systematically
Every interaction required during team invitation and onboarding compounds abandonment risk. According to aggregate research from Reforge, Intercom, and Segment, reducing invitation flows from 5 steps to 2 steps improves completion by 180-240%.
Friction elimination isn't optional optimization—it's fundamental product architecture that determines whether teams adopt or abandon.
Align with Existing Mental Models
Teams resist tools requiring workflow transformation regardless of promised benefits. Products succeeding at team adoption integrate with established patterns rather than replacing them.
Stanford HCI research demonstrates that workflow-aligned products achieve 4.3x faster team adoption compared to transformational approaches.
Implement Role-Based Experiences
Generic onboarding creates cognitive load for users with specific responsibilities. Role-specific flows reduce unnecessary information exposure while ensuring users discover capabilities relevant to their contexts.
Data from Appcues, Pendo, and WalkMe consistently shows role-based onboarding improving activation rates by 140-210%.
Build Strategic Integrations
Integration strategy functions as both distribution mechanism and retention driver. Teams using products integrated with 3+ existing tools demonstrate 91% higher retention and 67% faster expansion according to Zapier's integration research.
Integration depth correlates directly with switching costs and operational dependency.
Revenue Impact Summary
Team adoption transforms SaaS economics fundamentally:
Net Revenue Retention: 312% higher for team-adopted accounts (ChartMogul)
Customer Lifetime Value: 3.5-4.2x increase through improved retention and expansion (SaaS Capital)
Expansion Velocity: 2.3x faster growth rates (Forrester Research)
Churn Reduction: 40-60% lower churn for team deployments (Pacific Crest)
These improvements compound annually—the CLV difference between single-user and team-adopted accounts reaches 400-500% over three years.
Implementation Priorities
For founders addressing team adoption challenges:
Audit existing invitation flows for friction points exceeding three required steps
Implement role-based onboarding with progressive capability unlocking
Build essential collaboration features including task assignment and real-time coordination
Establish strategic integrations with communication and productivity platforms
Create systematic feedback collection measuring team health metrics
Products addressing these priorities unlock expansion revenue that typically exceeds new customer acquisition at scale—the fundamental economics driving B2B SaaS valuation multiples.
"Team adoption isn't a feature roadmap—it's a business model transformation from selling to individuals to selling to organizations. Get this right and revenue expansion becomes inevitable." — Jason Lemkin, Founder of SaaStr
The path from individual love to team adoption requires systematic friction elimination, workflow integration, and continuous optimization based on behavioral data. Companies executing this transition successfully transform from point solutions into organizational infrastructure—a shift that fundamentally alters growth trajectories and enterprise value.
Final Summary: Team adoption drives B2B SaaS revenue expansion through improved retention, increased contract values, and faster growth rates—achievable through systematic friction reduction, role-based experiences, essential collaboration features, strategic integrations, and continuous behavioral optimization.
For more insights on building products teams love, explore our blog or learn about our SaaS solutions.
Glossary
Activation Friction: Cumulative cognitive and interaction costs preventing users from completing desired behaviors. In team contexts, activation friction compounds across multiple stakeholders—each additional friction point reduces completion probability exponentially.
Cognitive Load: The total mental processing demand placed on working memory during task execution. High cognitive load during team onboarding reduces completion rates and feature adoption. Effective products minimize cognitive load through progressive disclosure and role-specific experiences.
Collaboration Friction: Resistance encountered when multiple users attempt to coordinate work within a product. Manifestations include communication context loss, permission ambiguity, real-time synchronization failures, and workflow integration gaps.
Contextual Communication: Discussion capabilities embedded directly within work artifacts, allowing teams to collaborate without leaving the primary task environment. This pattern reduces interaction cost and maintains mental model continuity.
Expansion Revenue: Revenue growth from existing customers through seat additions, tier upgrades, or usage-based pricing increases. In mature B2B SaaS businesses, expansion revenue typically exceeds new customer acquisition revenue.
Friction Score: Quantitative measure of obstacles preventing user goal completion. Calculated as: (Context Switches × Switch Cost) + (Permission Clarifications × Resolution Time) + (Tool Transitions × Transition Overhead).
Information Hierarchy: Organizational structure determining content priority, grouping, and presentation sequence. Team products require more complex information hierarchies than individual tools to accommodate multiple user roles and perspectives.
Interaction Cost: Total physical and cognitive effort required to complete a task, measured in time, clicks, and mental processing. Team products require 40% lower interaction cost per user to achieve equivalent adoption rates compared to individual tools.
Mental Model: User's internal representation of how a system functions, based on prior experience and expectations. Products aligning with established mental models reduce learning curves; misalignment creates adoption friction.
Multi-User Session: Work period where 2+ team members actively collaborate within a product simultaneously. Multi-user session frequency indicates collaboration feature adoption and team workflow integration.
Net Revenue Retention (NRR): Percentage of revenue retained from existing customers including expansion and contraction, excluding new customer revenue. NRR >100% indicates expansion revenue exceeds churn. Team-adopted products achieve 120-150% NRR.
Product Stickiness: Resistance to churn through workflow integration depth, data accumulation, and cross-team dependencies. Sticky products become operationally essential rather than individually useful—creating switching costs that prevent abandonment.
Progressive Disclosure: UX pattern revealing complexity incrementally as users demonstrate readiness rather than presenting all options upfront. Reduces initial cognitive load while maintaining access to advanced capabilities.
Role-Based Access Control (RBAC): Permission system assigning capabilities based on predefined user roles rather than individual configuration. Effective RBAC balances security requirements with usability through clear role definitions.
Retention Curve: Graph showing percentage of users remaining active over time. Team-adopted products show lower initial retention (onboarding friction) but significantly higher long-term retention (organizational embedding).
Usability Debt: Accumulated UX friction resulting from design decisions prioritizing other concerns over user experience. Like technical debt, usability debt compounds over time and becomes increasingly expensive to address.
Workflow Integration: Degree to which a product connects with existing team processes, tools, and communication patterns. High integration reduces adoption friction; forced workflow transformation creates resistance.
References
The following authoritative entities and research bodies are cited throughout this analysis:
Research Institutions
Industry Research Organizations
Product & Growth Organizations
Technology & Analytics Platforms
Blissfully
Company Research & Reports
Atlassian State of Teams Report
Slack S-1 Filing
Asana Anatomy of Work Index
Google Internal Adoption Metrics
This analysis synthesizes findings from peer-reviewed research, industry surveys, product analytics data, and public company disclosures to provide evidence-based guidance on team adoption optimization in B2B SaaS contexts.
Ready to optimize your team adoption strategy? Contact us to learn how we can help you reduce collaboration friction and drive revenue expansion through effective UX optimization and product design.


