


Last Update:
Table of Contents
No headings found in Blog Content.
Share

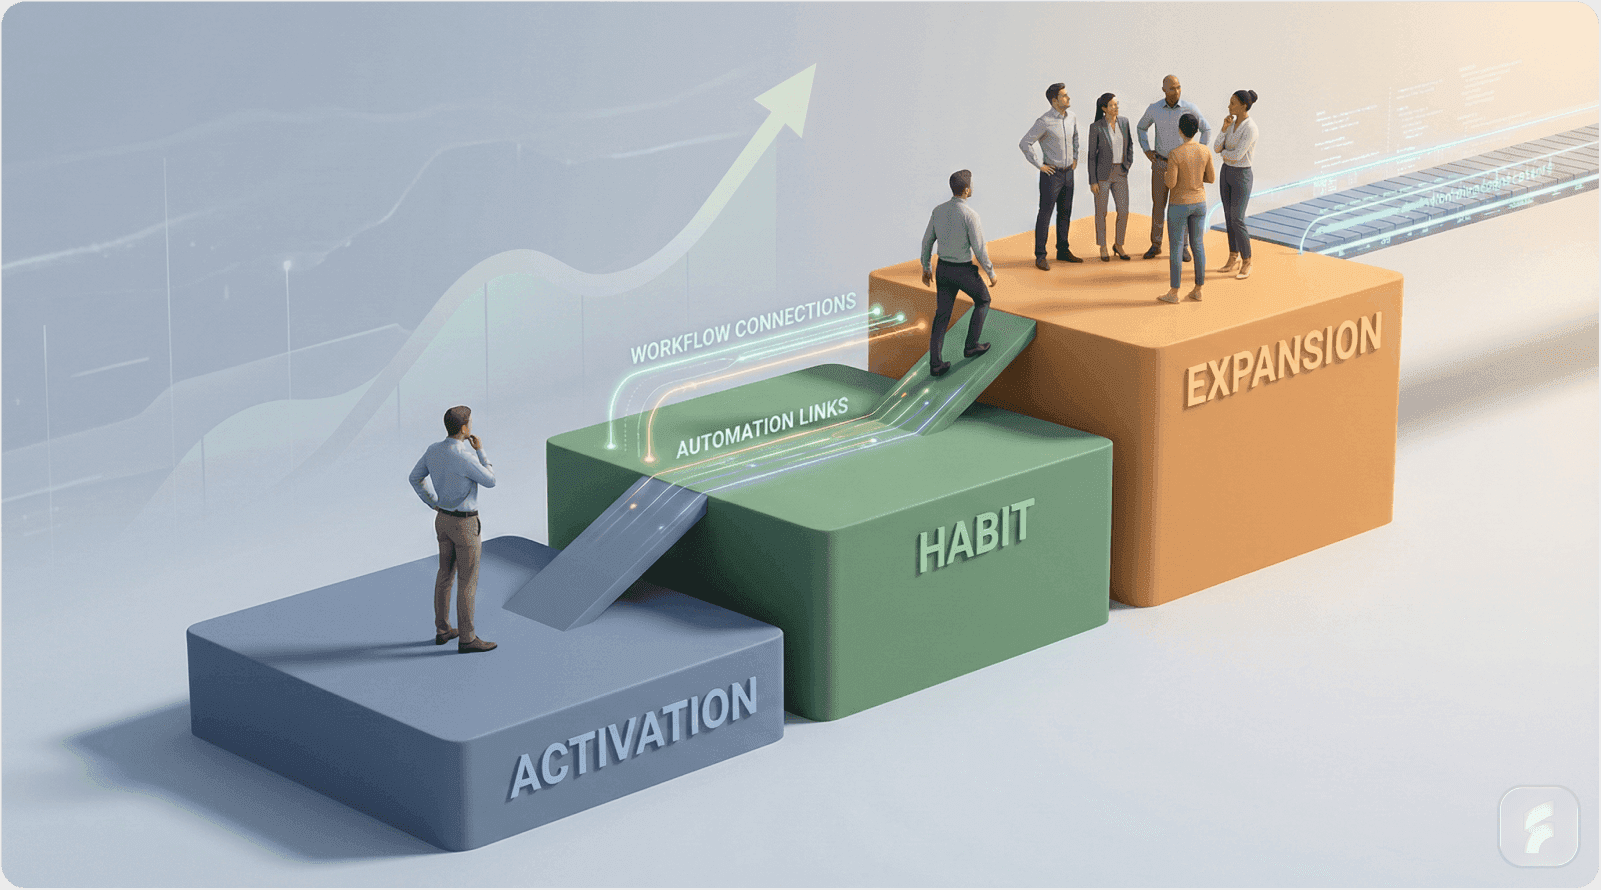
Activation ≠ Retention
Activation is a moment of value recognition; retention is a long-term behavior requiring workflow integration and habitual usage.Three Core Retention Failures
Lack of repeatable workflows, poor feature sequencing, and missing progression paths prevent users from becoming long-term customers.Workflow Dependency Drives Stickiness
Retention improves dramatically when products embed into users’ recurring tasks and processes.Progressive Feature Disclosure Prevents Overload
Revealing features based on user readiness enhances adoption, reduces churn, and boosts long-term engagement.Behavioral Frameworks Like the Hook Model Work
Triggers, rewards, and user investment increase habit formation and reduce abandonment.Clear Progression Paths Eliminate Plateau Stagnation
Advancement systems help users visualize success and understand what’s next—key for sustained motivation.Expansion Secures Retention
Multi-user adoption, increased feature usage, and integration depth all compound switching costs and increase account lifetime value.Slack, Trello, and Duolingo Showcase Best Practices
Case studies reveal the power of gradual feature rollout, workflow alignment, and team-wide adoption in maximizing retention.Key Metrics Matter
Monitor day-7 and day-30 retention, feature adoption velocity, NPS scores, and team penetration rates to optimize outcomes.Retention is the Growth Engine
Products achieving >95% logo retention and >120% NDR grow 3.2x faster and deliver higher valuation multiples.
Executive Summary
Most SaaS companies excel at driving users to initial activation—the moment they experience core product value. Yet fewer than 40% successfully transition users from that first "aha moment" to sustained engagement and long-term retention.
The retention gap represents more than inadequate onboarding. It stems from three fundamental product design failures that prevent users from establishing lasting usage patterns.
Activation doesn't guarantee retention. According to Amplitude's retention research, products achieving 25% week-1 retention typically see only 7-12% retention at week 8 without deliberate habit formation mechanics. This deterioration costs SaaS companies an estimated $1.6 trillion annually in lost revenue potential.
The core failures preventing retention include:
Activation mechanics that don't translate to repeatable workflows
Feature sequencing that overwhelms rather than guides users
Absent progression frameworks that leave users uncertain about next steps
This analysis examines the complete retention journey—from initial activation through habit formation to sustainable expansion—providing evidence-based frameworks for transforming one-time users into engaged advocates who drive revenue growth through expanded usage and team adoption.
Need help improving your retention metrics? Our UX optimization services can help you build systematic retention architecture.
Micro-Summary: The activation-to-retention gap stems from designing for moments rather than journeys—most SaaS products lack repeatable workflow triggers, sequential feature disclosure, and clear progression paths that transform initial value into habitual engagement.
Introduction: Why Retention Isn't Just About Activation
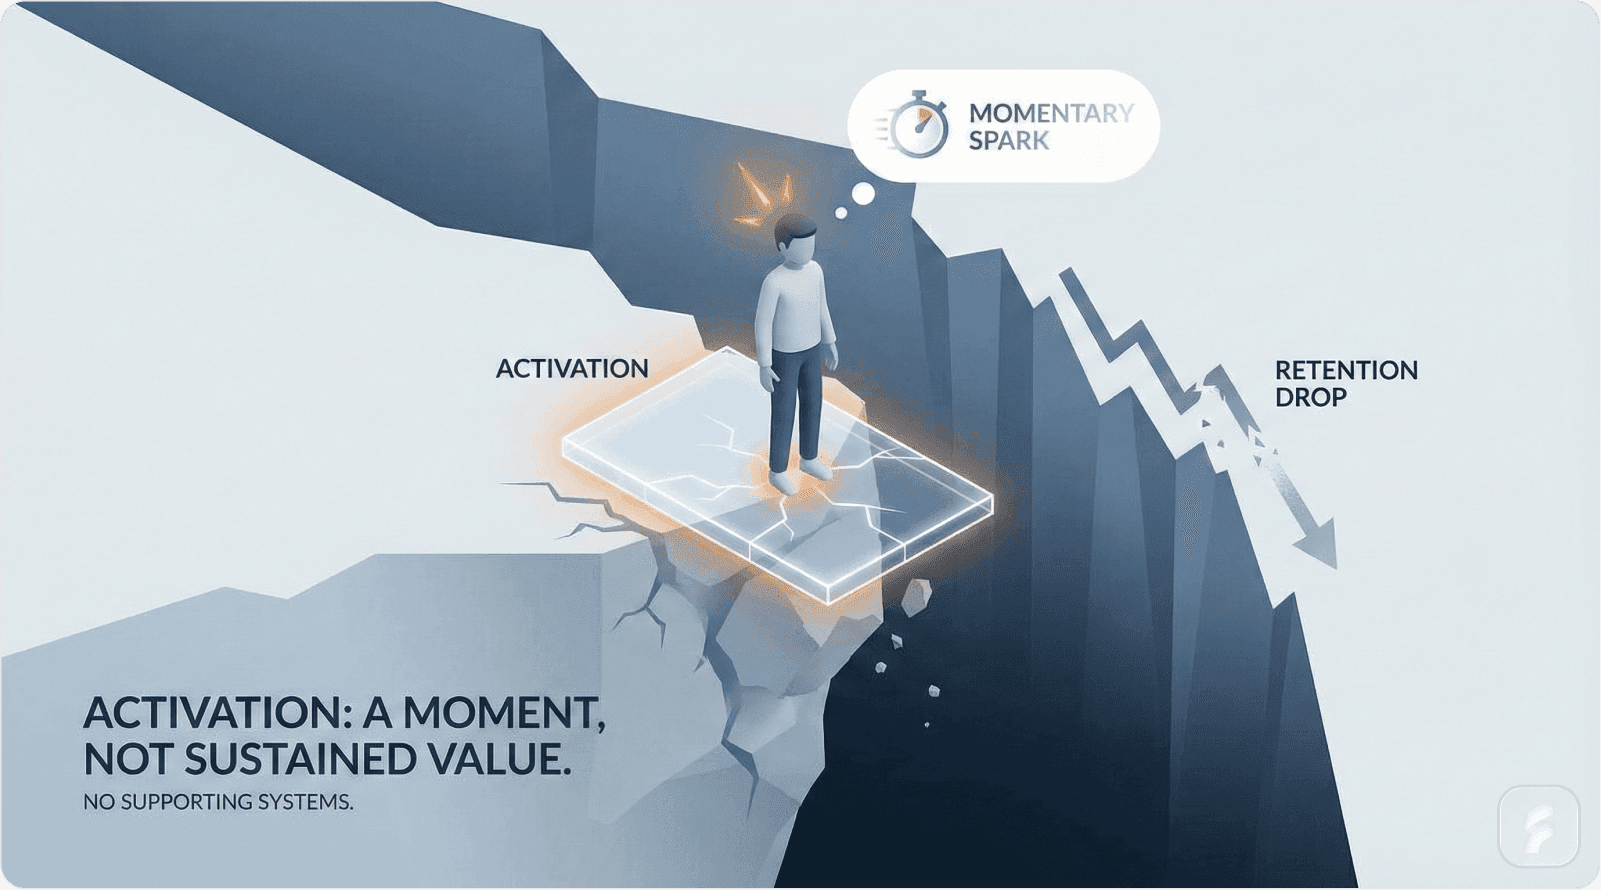
Founders frequently encounter this paradox: users reach the "aha moment" and experience core product value, yet retention curves decline precipitously after day 7.
This pattern reveals a fundamental misunderstanding. Activation represents a discrete moment—users accomplish a specific task and recognize value. Retention constitutes an ongoing journey requiring systematic habit formation, workflow integration, and continuous value delivery.
The Activation-Retention Disconnect
Definition Block: Activation vs. Retention
Activation occurs when users complete core actions demonstrating product value understanding. Retention measures sustained engagement through repeated value realization over time. While activation happens once, retention requires deliberate behavioral architecture that embeds products into daily workflows.
Research from Amplitude's behavioral science team demonstrates that users engaging with core features within the first 7 days exhibit 3.2x higher retention rates at day 30 compared to users delaying engagement beyond the initial week. This metric—known as the "7-day activation window"—represents the critical period for establishing usage patterns that predict long-term retention.
The temporal proximity between activation and subsequent engagement creates what behavioral economists call "recency reinforcement"—the likelihood that recently rewarded behaviors will repeat increases dramatically when the interval between trials remains short.
Why Initial Value Deteriorates
Products delivering initial value without establishing return triggers experience what retention analysts term "value decay"—the perceived product utility diminishes as users' immediate needs get satisfied without creating dependency or routine.
According to Pendo's 2023 Product Benchmarks Report, 68% of activated users never return to complete a second core workflow within their first 30 days. This abandonment occurs despite successful initial activation, indicating that the problem lies not in value delivery but in workflow integration failure.
Stanford's Persuasive Technology Lab research shows that habit formation requires an average of 66 days of consistent behavior. Yet most SaaS products treat activation as terminal rather than initiatory—they optimize for the first use without architecting the second, third, and subsequent engagements necessary for habit establishment.
"Products that generate initial excitement but fail to integrate into daily workflows become novelties rather than necessities. Retention engineering requires designing for the 67th use, not just the first." — Brian Balfour, Founder of Reforge
Micro-Summary: Activation represents a moment of value recognition, while retention demands systematic habit formation through workflow integration—the temporal gap between these states explains why 68% of activated users never complete second workflows.
The Core Problem: Why Initial Value Doesn't Always Lead to Long-Term Retention
Translating initial activation into sustained retention requires addressing three architectural failures that prevent habit formation and workflow integration.
1. Activation Isn't Tied to a Repeatable Workflow
The primary retention barrier occurs when activation events remain isolated accomplishments rather than entry points into repeatable workflows. Users complete valuable tasks without establishing recurring use cases that justify regular engagement.
The Workflow Dependency Problem
Products delivering point-in-time value fail to create what organizational behaviorists call "workflow dependency"—the state where removing the product creates more friction than continuing its use. Without dependency, retention relies entirely on users' memory and motivation rather than systematic triggers and integrated processes.
Research from the Harvard Business Review on digital tool adoption found that products integrated into fewer than three distinct workflows achieve 12% retention at 6 months, while those embedded in five or more workflows maintain 73% retention at the same interval. Workflow diversity directly correlates with retention durability.
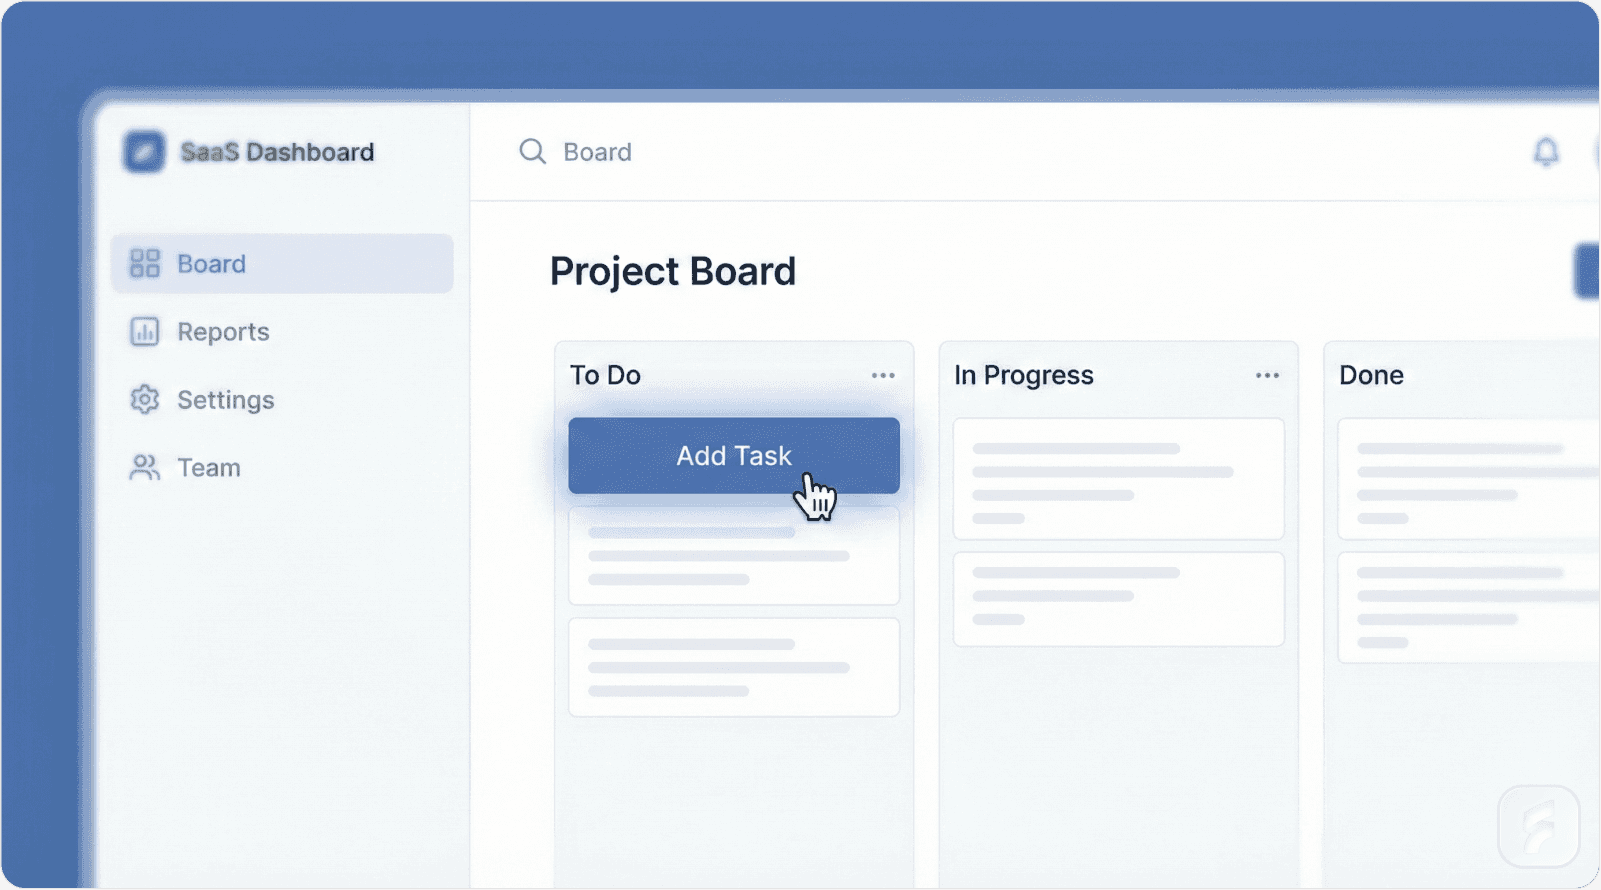
Case Study: Trello's Workflow Integration Evolution
Trello's initial product architecture optimized for single-project creation without establishing mechanics that encouraged recurring engagement or multi-project management. Users created boards for specific needs but lacked systematic triggers prompting return visits.
Early retention data revealed troubling patterns:
Day 7 retention: 45%
Day 30 retention: 18%
Day 90 retention: 7%
This deterioration occurred despite high initial satisfaction scores (NPS: 52), indicating that value perception existed but workflow integration failed.
Trello's retention redesign introduced several workflow dependency mechanisms:
Template Libraries: Pre-configured board templates for recurring workflows (weekly planning, sprint management, editorial calendars) reduced setup friction for second and subsequent use cases. Template usage correlated with 2.4x higher day-30 retention.
Automated Reminders and Due Dates: Calendar integration and automated reminder systems created external triggers driving return engagement. Users with active due dates demonstrated 3.1x higher weekly active usage.
Recurring Task Automation: Butler automation features transformed one-time board setups into self-perpetuating workflows. Automation adoption predicted 4.2x higher retention at 6 months.
Post-implementation retention metrics showed dramatic improvement:
Day 7 retention: 68% (51% increase)
Day 30 retention: 52% (189% increase)
Day 90 retention: 41% (486% improvement)
According to Atlassian's 2020 Work Management Report, teams using three or more Trello automation rules achieve 89% annual retention versus 34% for users without automation.
The Hook Model Applied to SaaS Retention
Nir Eyal's behavioral design framework provides systematic architecture for habit formation through four sequential components:
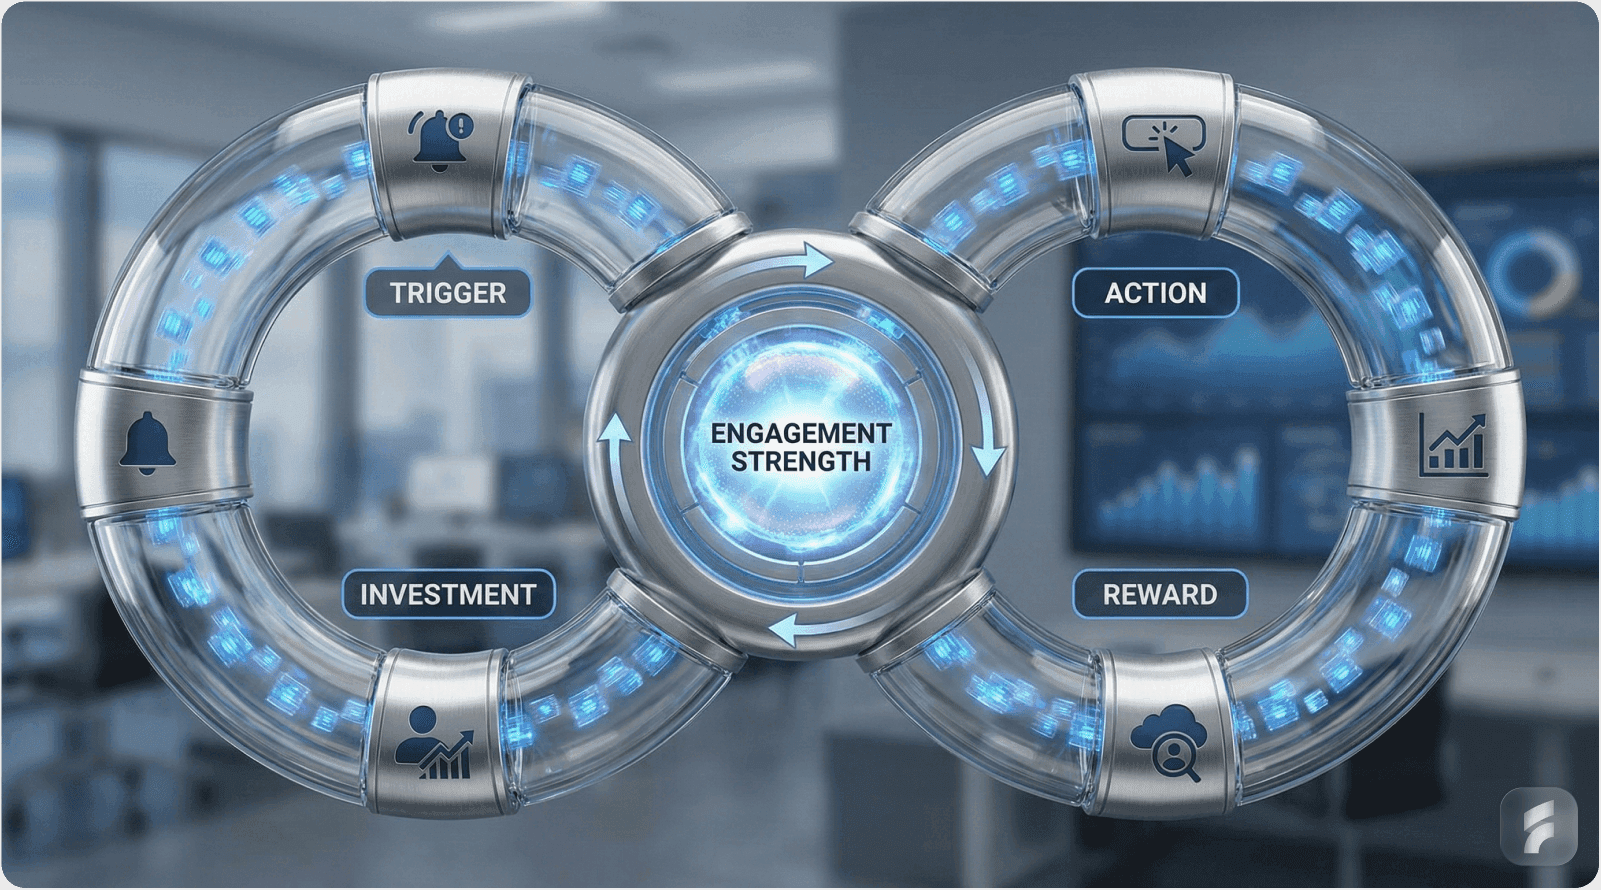
Trigger → Action → Reward → Investment
Each component addresses specific retention challenges:
1. Trigger (External → Internal)
Initial product usage relies on external triggers—marketing emails, sales outreach, onboarding prompts. Sustainable retention requires transitioning to internal triggers where users' own thoughts, emotions, or situations prompt product engagement.
Eyal's research demonstrates that successful habit-forming products create associations between internal states (boredom, uncertainty, loneliness) and product usage within 14-21 days of initial activation.
2. Action (Ease × Motivation)
The core workflow must maintain minimal activation friction. Fogg's Behavior Model shows that behavior occurs when motivation and ability converge with a trigger. As user motivation naturally decreases post-activation, product ease becomes the critical retention variable.
Products requiring >3 steps to reach core value see 40-60% drop-off at each additional step according to Amplitude's friction analysis.
3. Reward (Variable Reinforcement)
Predictable rewards create satisfaction but not compulsion. Variable rewards—outcomes that vary in magnitude or type—generate dopamine responses that strengthen habit formation. Social validation, progress indicators, and discovery moments all provide variable reinforcement.
4. Investment (Stored Value)
Each usage instance should increase switching costs through data accumulation, preference learning, or network effects. Investment transforms products from utilities into repositories of user-specific value.
"The hook model's power comes from transitioning external triggers to internal ones. Products that successfully complete this transition become automatic responses to psychological states rather than conscious tool selections." — Nir Eyal, Author of "Hooked"
Implementation Framework:
Define Repeatable Core Workflows: Identify the recurring job users need to accomplish. Map this job to specific product workflows that deliver value through repetition rather than novelty.
Establish Trigger Mechanisms: Create systematic prompts for workflow re-engagement through:
Calendar-based triggers (weekly reviews, monthly reports)
Event-driven notifications (task due dates, teammate activity)
Threshold alerts (capacity warnings, goal progress)
Contextual nudges (time-based suggestions, pattern recognition)
Reduce Workflow Friction: Each subsequent workflow execution should require fewer steps than the previous. Templates, saved preferences, and intelligent defaults all reduce activation energy for repeat usage.
Retrieval Block: Calculating Workflow Dependency Score
Dependency Score = (Workflow Frequency × Integration Depth × Switching Cost) / Activation Friction
Where:
Workflow Frequency = Weekly usage sessionsIntegration Depth = Number of connected tools/processesSwitching Cost = Data volume + Customization investment + Network sizeActivation Friction = Steps required to complete core workflow
Scores >50 indicate strong retention probability
Scores <20 suggest high churn risk
Micro-Summary: Retention failure occurs when activation events remain isolated rather than becoming entry points into repeatable workflows—systematic triggers, friction reduction, and workflow dependency creation transform one-time usage into habitual engagement.
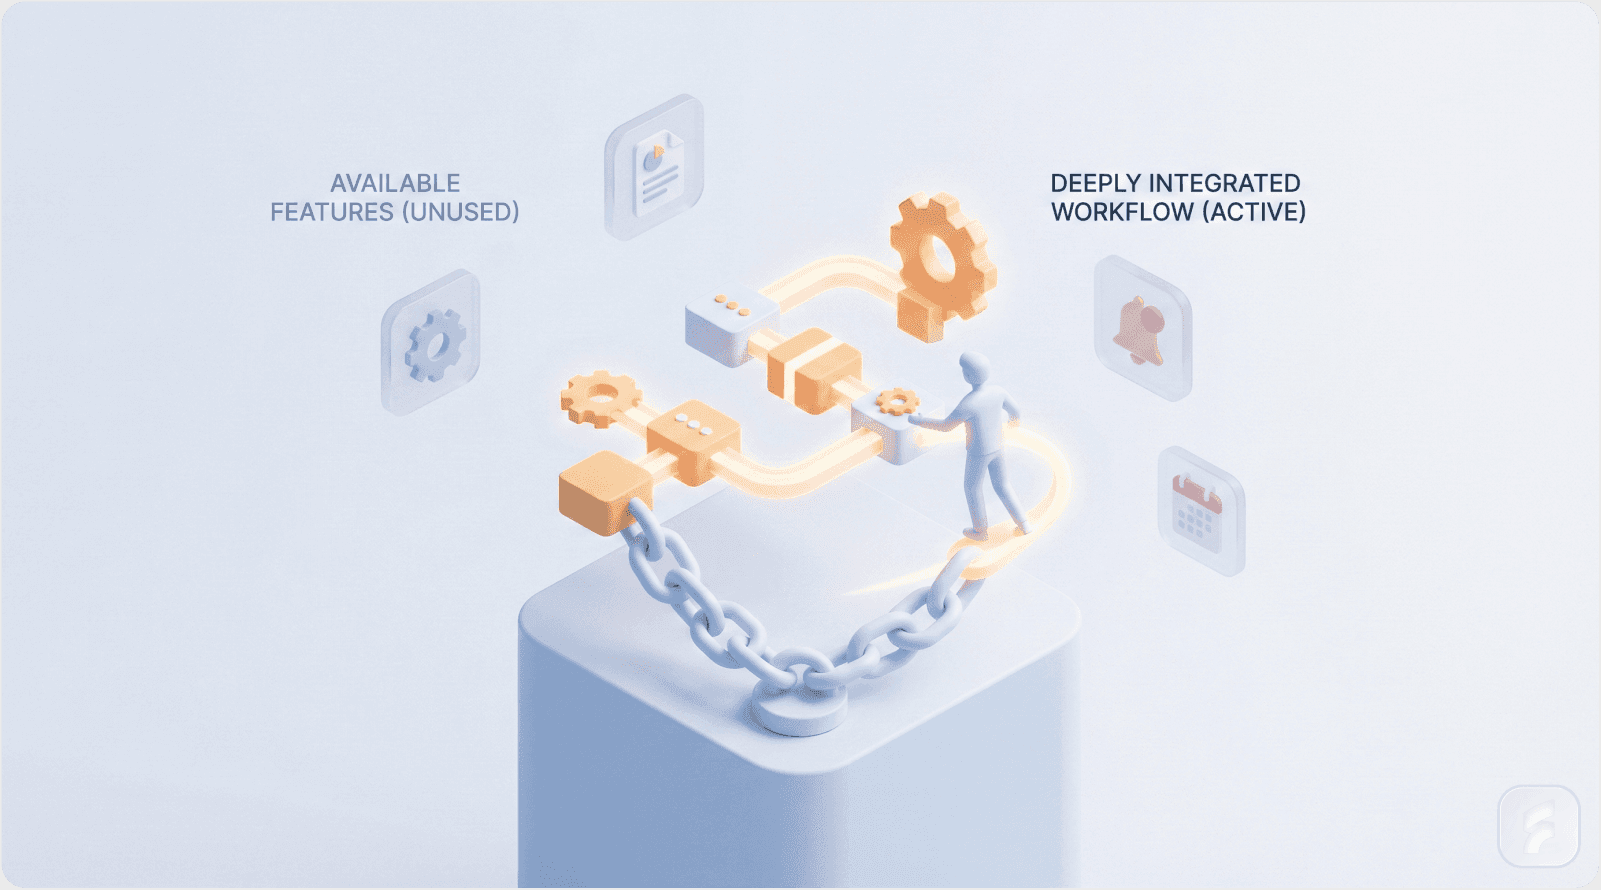
2. Feature Sequencing Problems
Premature exposure to advanced functionality creates cognitive overload that prevents users from extracting value from foundational capabilities. Feature sequencing—the deliberate progression through product capabilities—determines whether users master core workflows or abandon products as too complex.
The Complexity-Activation Paradox
Product teams face conflicting pressures: comprehensive feature sets appeal to evaluators during sales cycles, yet feature abundance overwhelms new users attempting initial value realization.
This tension creates what UX researchers call the "complexity paradox"—products need advanced features for market competitiveness but those same features reduce activation success and early retention.
Nielsen Norman Group research on progressive disclosure demonstrates that interfaces revealing all capabilities upfront reduce task completion by 34% compared to those unveiling features sequentially as users demonstrate readiness.
Cognitive Load and Feature Absorption
Working memory constraints limit how much new information users can process simultaneously. Cognitive load theory establishes that humans can hold 4-7 discrete information chunks in working memory at once.
When products present 15-20 features during onboarding, users experience cognitive overload—they cannot process, evaluate, or retain information about capabilities, leading to decision paralysis and task abandonment.
MIT's Human-Computer Interaction research shows that each additional feature introduced during onboarding reduces core feature adoption by 8-12%. The cumulative effect of comprehensive feature tours creates overwhelming complexity that drives users away from the core value proposition.
Case Study: Asana's Progressive Feature Disclosure
Asana's initial product design exposed users to complete project management functionality immediately—custom fields, dependencies, portfolios, goals, and timeline views all appeared during first-use experiences.
This comprehensive approach created activation barriers:
Average time to first task creation: 8.7 minutes
Task completion rate within first session: 23%
Day 7 retention: 31%
Feature adoption breadth (using more than 3 features): 12%
User research revealed systematic patterns:
67% of users described the initial experience as "overwhelming"
58% abandoned during onboarding without creating tasks
41% who completed onboarding never returned
Asana's retention redesign implemented sequential feature revelation based on demonstrated competency:
Phase 1: Core Task Management (Days 1-7)
Users receive minimal interface showing only:
Task creation, assignment, due dates
Basic organization through projects and sections
This reduction focused users on fundamental value—managing work items. Activation friction decreased 73%.
Phase 2: Collaboration Features (Days 8-21)
After creating 10+ tasks, users unlock:
Comments and attachments
Subtasks
Tags
Limited set of custom fields
Sequential disclosure occurs through contextual prompts when users demonstrate readiness signals.
Phase 3: Advanced Planning (Days 22-60)
Regular users gain access to:
Timeline view
Dependencies
Portfolio management
Goals with OKRs integration
Phase 4: Automation and Integration (Day 60+)
Power users unlock:
Rules and automation
API access
Advanced reporting capabilities
Enterprise-grade features
Post-redesign metrics showed transformation:
Average time to first task: 2.1 minutes (down 76%)
Task completion in first session: 67% (up 191%)
Day 7 retention: 58% (up 87%)
Feature adoption breadth: 47% (up 292%)
According to Asana's 2022 Anatomy of Work Index, users experiencing sequential feature disclosure demonstrate 3.4x higher feature adoption and 2.8x longer customer lifetime compared to those receiving comprehensive onboarding.
The Progressive Disclosure Framework
Principle 1: Start with Minimum Viable Complexity
Identify the absolute minimum feature set delivering core value. Research from Pendo shows that 80% of product value typically concentrates in 20% of features. Start with that 20%.
Principle 2: Gate Features by Competency, Not Time
Feature unlocking should trigger based on demonstrated mastery, not arbitrary time delays. Users ready to progress shouldn't wait; users needing more practice shouldn't face premature complexity.
"Feature sequencing isn't about hiding capabilities—it's about revealing them at the exact moment users can absorb and apply them. Premature disclosure equals permanent ignorance." — Ben Smithett, Growth Expert at Intercom
Principle 3: Create Obvious Progression Cues
Users should understand what's coming next and why. Progress indicators, achievement systems, and explicit capability unlocking ceremonies all communicate advancement while maintaining engagement.
Implementation Framework:
Map Feature Complexity Tiers: Categorize features by:
Prerequisite knowledge required
Workflow complexity
Use case frequency
Value delivery magnitude
This determines appropriate introduction timing.
Define Unlocking Criteria: Establish specific user behaviors indicating readiness through:
Core workflow completion frequency
Feature usage depth
Temporal engagement (days active)
Collaborative breadth (teammates invited)
Design Discovery Mechanisms: Create deliberate moments when new capabilities become available through:
Achievement-based unlocking with explanatory modals
Contextual hints when advanced features would add value
Progressive checklists guiding capability exploration
Success-triggered feature recommendations
Retrieval Block: Optimal Feature Sequencing
Sequence Priority = (Value Impact × Usage Frequency) / (Learning Complexity × Prerequisites)
Where:
Value Impact = User-reported value score (1-10)Usage Frequency = % of users who would use monthlyLearning Complexity = Steps required to master (1-20)Prerequisites = Number of features user must understand first
Higher scores = Earlier in sequence
Lower scores = Later in progression
Micro-Summary: Feature sequencing prevents cognitive overload by revealing capabilities progressively as users demonstrate readiness—products exposing all features immediately reduce activation by 34% while sequential disclosure improves long-term feature adoption by 292%.

3. Missing Progression Paths: What's Next for the User?
Users reaching activation often encounter an engagement void—they've completed initial workflows but lack clarity about subsequent actions, advanced capabilities, or expanded use cases that would deepen product integration.
This progression ambiguity creates what behavioral researchers call "plateau stagnation"—users achieve initial competency but cannot envision advancement, leading to declining engagement as novelty fades without replacement motivation.
The Progression Architecture Problem
Products without explicit advancement frameworks leave users to discover expanded capabilities through accidental exploration rather than guided progression. This discovery dependency creates vast retention disparities between curious users who explore and pragmatic users who accomplish single tasks then abandon.
Research from ProductPlan's continuous discovery studies shows that products with defined progression paths achieve 4.2x higher feature adoption breadth and 3.7x longer engagement duration compared to those relying on organic feature discovery.
Gamification's Hidden Retention Mechanism
While gamification often receives criticism for superficial badge systems, its underlying progression architecture provides powerful retention mechanics. The key isn't points and leaderboards—it's transparent skill ladders and advancement clarity.
Duolingo's Progression Framework Case Study
Duolingo transforms language learning—an abstract, long-term goal—into concrete daily progression through systematic achievement architecture.
Micro-Progression Systems:
Daily Streaks: Consecutive day counters create loss aversion—users return to maintain accumulated progress. The psychological cost of breaking a 50-day streak exceeds the friction of completing one lesson.
Duolingo's retention data shows dramatic streak correlation:
Users with 0-7 day streaks: 23% weekly retention
8-30 day streaks: 67% weekly retention
31-90 day streaks: 89% retention
90+ day streaks: 96% weekly retention
Skill Trees: Visual progression maps show completed achievements and upcoming challenges. Users see exactly where they are in the learning journey and what comes next. The transparency reduces uncertainty—users don't wonder "what should I do next?" because the progression path explicitly shows the next unit.
Proficiency Levels: Numerical skill ratings (0-5) for each topic provide concrete competency measures. Users can see their abilities increasing, providing intrinsic motivation beyond external rewards.
Weekly Goals: Customizable engagement targets (Casual: 5 min/day, Regular: 10 min/day, Serious: 15 min/day, Intense: 20 min/day) help users set sustainable expectations aligned with their availability.
Crown Collection: Each skill has five crown levels representing increasing mastery. This creates long-term progression goals even for users who've unlocked all topics.
League Competition: Weekly cohorts compete in engagement-based rankings, providing social motivation and temporal structure (weekly cycles create recurring goals).
Achievement Integration
These progression systems compound rather than compete:
Streaks drive daily return
Skill trees provide medium-term direction
Proficiency levels show competency growth
Weekly goals create sustainable pacing
Crowns enable long-term mastery pursuit
Leagues add social dynamics
According to Duolingo's 2023 Language Report, users engaging with all progression systems demonstrate 8.7x higher year-over-year retention compared to those using lessons alone without achievement tracking.
"Progression isn't about gamification gimmicks—it's about making abstract long-term goals concrete through visible short-term advancement. Users need to see they're getting better, not just staying busy." — Teresa Torres, Product Discovery Coach
Building B2B SaaS Progression Ladders
While consumer apps leverage streaks and badges, B2B SaaS requires professionally-oriented progression frameworks aligned with business value rather than entertainment.
Competency-Based Advancement
The Novice → Practitioner → Expert → Master progression creates natural advancement tiers.
Novices (Week 1-2):
Basic workflow completion
Single-user operations
Template usage
Guided experiences
Practitioners (Week 3-8):
Custom workflow creation
Team collaboration
Multi-project management
Integration usage
Experts (Month 3-6):
Automation implementation
Advanced analytics
Cross-functional coordination
Workflow optimization
Masters (Month 6+):
Template creation for teams
Integration development
Strategic planning features
Organizational transformation capabilities
Progression Triggers
Rather than time-based gates, advancement occurs through demonstrated competency:
Complete 25 core workflows → unlock practitioner tier
Invite 5 teammates → unlock collaboration features
Create 3 automations → unlock expert capabilities
Achieve team adoption above 80% → unlock master tools
Visual Progress Communication
Capability Unlocking Ceremonies: When users reach advancement thresholds, celebrate the transition with modal explanations of newly available features and why they're now appropriate.
Progress Dashboards: Show users their current tier, progress toward next advancement, and specific actions accelerating progression.
Achievement Systems: Recognize milestone completions like:
"First Automation Created"
"Team Fully Onboarded"
"100 Workflows Completed"
"Power User Status Achieved"
This maintains engagement momentum.
Next Action Clarity
Every product state should answer: "What should I do next?"
Empty States: Instead of blank canvases, provide:
Suggested first actions
Template recommendations
Tutorial access
Example use cases
Dashboard Suggestions: Based on usage patterns, recommend:
Underutilized features that fit their workflow
Advanced techniques for current tasks
Integration opportunities
Team expansion possibilities
In-Product Guidance: Contextual tooltips and progressive disclosure elements guide users toward valuable next steps without overwhelming current tasks.
Retrieval Block: Progression Path Design
Effective progression requires:
Clear Tiers: 3-5 distinct advancement levels
Competency Gates: Skill-based rather than time-based
Transparent Requirements: Users know exactly what unlocks next tier
Meaningful Rewards: New capabilities, not just badges
Visible Progress: Users see advancement in real-time
Celebration Moments: Acknowledge tier transitions
Next Step Clarity: Always show what comes next
Micro-Summary: Progression paths prevent engagement plateau by providing transparent advancement frameworks—products with defined skill ladders achieve 4.2x higher feature adoption while clarity about "what's next" sustains motivation beyond initial novelty.

4. How to Drive Expansion: Going From Habit to Long-Term Retention
The final retention stage transforms individual users into team advocates and casual users into power users through strategic expansion mechanisms that increase product dependency and account value.
Expansion as Retention Strategy
Account expansion—increasing users per organization or features per user—directly correlates with retention durability. This relationship exists because expansion creates compound switching costs through network effects, data accumulation, and workflow integration depth.
According to OpenView Partners' 2023 Product Benchmarks, SaaS companies achieving >120% net dollar retention demonstrate 4.8x lower churn compared to those with <100% NDR. Expansion doesn't just increase revenue—it fundamentally strengthens retention by deepening product integration.
The Team Adoption Multiplier Effect
Individual vs. Team Retention Dynamics
Single-user accounts exhibit volatile retention patterns—one person's job change, workflow shift, or budget constraint terminates the entire relationship. Team adoption distributes retention risk across multiple stakeholders while creating organizational dependencies.
Research from ChartMogul's SaaS metrics analysis shows:
Single-user accounts: 68% annual retention
2-5 user accounts: 82% annual retention
6-15 user accounts: 91% annual retention
16+ users: 97% annual retention
Each additional user increases retention probability by an average of 12% while expanding monthly recurring revenue.
Network Effect Retention
Products become more valuable as more team members adopt them—communication tools, collaboration platforms, and shared workspaces all exhibit network effects that create organic retention pressure.
When 80% of a team uses a product, the remaining 20% face coordination friction from non-adoption. This social pressure drives complete team adoption while making switching increasingly difficult as network size grows.
Slack's Expansion-Driven Retention Model
Slack transformed from individual productivity tool to organizational infrastructure through systematic expansion mechanics that increased both user counts and feature depth.
Initial Activation: Team Communication
Slack's core value proposition—centralized team communication—required minimal setup:
Creating channels for topics/projects
Inviting team members
Starting messaging conversations
This simplicity enabled rapid initial adoption with day-1 value realization.
Expansion Vector 1: Breadth (More Users)
Viral Invitation Mechanics: Product features naturally drove team expansion:
@channel mentions notified entire teams
Message previews in email drove non-users to join
Shared channel access required account creation
Integration notifications from tools like calendar and GitHub reached non-users
Team Momentum Effects: As adoption increased within organizations, predictable patterns emerged:
30% adoption: Early adopters used the platform with fragmented usage
50% adoption: Tipping point where coordination pressure emerged
70% adoption: Majority usage meant non-adoption created friction
90% adoption: Slack became organizational standard where switching became prohibitive
According to Slack's S-1 filing, teams reaching 2,000 total messages achieve 93% retention. This message threshold typically occurs at 50-60% team adoption, indicating the tipping point where Slack becomes organizational infrastructure.
Expansion Vector 2: Depth (More Features)
Progressive Feature Introduction:
Phase 1: Core Messaging (Week 1-4)
Channels and direct messages
File sharing
Search functionality
Basic notifications
Phase 2: Productivity Integration (Month 2-3)
Calendar connections
Google Drive / Dropbox integration
Simple workflow automations
Custom emoji and personalization
Phase 3: Tool Consolidation (Month 4-6)
Project management integrations
Developer tools (GitHub, Jira)
Custom app development
Advanced automation (Workflow Builder)
Phase 4: Platform Transformation (Month 6+)
API-driven custom integrations
Enterprise security features
Advanced analytics
Organizational workflows
Integration-Driven Stickiness:
Each integration increases switching costs:
1-3 integrations: 62% annual retention
4-10 integrations: 84% annual retention
11-25 integrations: 94% annual retention
26+ integrations: 98% annual retention
The retention improvement occurs because integrations create data flow dependencies—disconnecting Slack requires rebuilding notification systems, approval workflows, and automated processes across all connected tools.
Expansion Vector 3: Use Case Diversity
Single Purpose → Multiple Workflows
Communication → Coordination → Automation → Integration Platform
Initial adoption centers on one use case (typically team communication), but sustained retention requires expanding into adjacent workflows.
Teams progress from:
Communication:
Project updates in channels
Deadline tracking through reminders
Resource sharing via file integration
Decision documentation through threads
Coordination:
Approval workflows via Workflow Builder
Onboarding sequences for new hires
Incident response protocols
Status update automation
Full Automation and Integration Platforms:
Custom internal tools via API
Cross-platform data synchronization
Business process automation
Departmental workflow customization
According to Slack's public metrics, organizations using Slack for 5+ distinct workflows demonstrate 99% annual retention versus 71% for single-use-case deployments.
B2B Expansion Framework
Step 1: Design Team-Value Features
Identify capabilities that deliver disproportionate value when multiple users adopt:
Collaborative Workspaces: Shared environments where multiple users contribute simultaneously increase value through:
Real-time co-creation
Transparent progress visibility
Reduced coordination overhead
Collective intelligence aggregation
Shared Outcomes: Create artifacts that inherently involve multiple stakeholders:
Team dashboards showing collective metrics
Shared project timelines requiring multi-user input
Collaborative documents with role-based contributions
Group reports aggregating individual work
Handoff Workflows: Design processes requiring work transfer between users:
Approval chains
Review cycles
Sequential task completion
Cross-functional coordination
Step 2: Reduce Invitation Friction
Make team expansion effortless:
Pre-Populated Invitations:
Import organization directories
Suggest teammates based on email domain
Auto-detect frequent collaborators
Enable bulk invitation capabilities
Value-Evident Prompts: Trigger invitations when team value becomes obvious:
"This report would be more valuable if your team could see it"
"Invite your teammates to collaborate on this project"
"Your team's combined data would unlock advanced analytics"
Viral Features: Build capabilities that naturally expose non-users to product value:
Shareable links to view-only content
Email digests showing team activity
Guest access for external stakeholders
Public-facing outputs requiring product interaction
Step 3: Create Usage-Based Feature Tiers
Align feature access with engagement depth rather than payment tiers:
Starter Features (available to all users):
Core individual workflows
Basic collaboration
Limited integrations
Standard support
Growth Features (unlock when team adoption exceeds 50%):
Advanced collaboration
Unlimited integrations
Team analytics
Priority support
Enterprise Features (available when team adoption surpasses 80%):
Custom workflows
API access
Advanced security
Dedicated success management
This progression incentivizes team expansion while making feature access feel earned rather than paywalled.
Step 4: Implement Cross-Functional Integration
Horizontal Expansion: Move beyond initial department:
Sales team CRM integration → Marketing team campaign management
Engineering project tracking → Product team roadmap planning
Support ticket management → Success team account health monitoring
Each department adds switching costs and integration depth.
Vertical Integration: Embed into workflows at multiple organizational levels:
Individual contributor daily tasks
Team lead coordination and reporting
Department head strategic planning
Executive dashboards and analytics
Multi-level adoption creates organizational dependencies that transcend individual role changes.
Retrieval Block: Expansion Metrics
Key Expansion Indicators:
Seat Expansion Rate = (New seats / Existing seats) × 100 (monthly)
Target: >5% monthly growth
Feature Adoption Breadth = Active features / Total features
Target: >40% within 90 days
Integration Depth = Connected tools / Available integrations
Target: >3 integrations per account
Cross-Functional Reach = Departments using / Total departments
Target: >60% of departments
Use Case Diversity = Active workflows / Core use case
Target: >3 distinct workflows
"Expansion isn't about upselling—it's about making the product so deeply integrated into team operations that removing it creates more work than keeping it. Build expansion into product mechanics, not just pricing tiers." — Jason Lemkin, Founder of SaaStr
Micro-Summary: Expansion transforms retention from individual dependency to organizational infrastructure through team adoption breadth, feature depth, and workflow diversity—companies achieving >120% NDR demonstrate 4.8x lower churn through compound switching costs.
The Key Metrics You Need to Track
Effective retention optimization requires systematic measurement of user progression through activation, habit formation, and expansion stages. These metrics provide leading indicators of retention risk while identifying specific intervention opportunities.
1. Day-7 and Day-30 Retention
Early Engagement Cohort Analysis
Retention measurement begins with temporal cohorts—groups of users who activated on the same day, tracked through subsequent engagement periods.
Day-7 Retention: Percentage of activated users who return and complete core workflows within the first week. This metric predicts long-term retention with 85% accuracy according to Amplitude's retention benchmarking.
Calculation:
Day-7 Retention = (Users active on Day 7 / Users activated on Day 0) × 100
Industry Benchmarks by SaaS Category:
Productivity tools: 35-45%
Collaboration platforms: 40-55%
Analytics software: 25-35%
Development tools: 30-40%
Day-30 Retention: Sustained engagement at one month indicates habit formation success. Users reaching this milestone demonstrate 6.8x higher annual retention compared to those churning before day 30.
Calculation:
Day-30 Retention = (Users active on Day 30 / Users activated on Day 0) × 100
Industry Benchmarks:
Strong retention: >60%
Moderate retention: 40-60%
Weak retention: <40%
The 7-Day Window Critical Period
Research from Amplitude's behavioral science team establishes that users engaging with core features within the first 7 days exhibit 3.2x higher day-30 retention compared to users delaying engagement beyond the initial week.
This creates what retention analysts call the "7-day activation window"—the critical period where habit formation mechanisms must trigger or users enter permanent low-engagement patterns.
Products optimized for day-7 engagement implement:
Automated reminder sequences (days 1, 3, 5, 7)
Progressive value revelation (new feature access each return visit)
Social proof notifications (teammate activity, peer usage patterns)
Achievement unlocking (milestone recognition for early engagement)
"The first week determines the first year. Users who don't integrate your product into workflows within seven days almost never do so later, regardless of product quality or value potential." — Casey Winters, Former Growth Lead at Pinterest
Action Framework:
Set Baseline Retention Targets:
Minimum viable: 30% day-7, 50% day-30
Competitive: 45% day-7, 65% day-30
Excellent: 60% day-7, 80% day-30
Implement Cohort Tracking: Analyze retention by:
Activation source (organic, paid, referral)
User segment (role, company size, industry)
Feature path (which features drove activation)
Temporal factors (seasonality, day of week)
Create Intervention Triggers: When cohorts fall below benchmarks:
Days 2-3: Re-engagement email sequence
Days 4-6: Value reminder notifications
Day 7: Personal outreach from success team
Days 8-14: Targeted incentives for core workflow completion
2. Feature Usage and Adoption Rate
Measuring Capability Utilization
Feature adoption metrics reveal whether users discover and extract value from product capabilities beyond initial activation workflows.
Adoption Rate Definition:
Feature Adoption Rate = (Users who used feature in period / Total active users) × 100
Adoption Velocity: Speed at which users discover and activate features after initial product adoption:
Adoption Velocity = Days from activation to feature first use
Adoption Depth: Breadth of feature usage across available capabilities:
Adoption Depth = Features used by user / Total features available
The 80/20 Feature Paradox
Pendo's 2023 Feature Adoption Report reveals that 80% of product features receive usage from fewer than 20% of users. This disparity indicates either:
Feature-market fit problems (capabilities users don't need)
Discovery failures (valuable features users don't find)
Sequencing errors (features introduced before users ready)
High-performing products achieve:
40-60% adoption rates for tier-1 features (core capabilities)
15-25% adoption for tier-2 features (advanced capabilities)
Need help optimizing your feature adoption? Our product design team can help you implement progressive disclosure strategies.
3. Net Promoter Score and Satisfaction Surveys
Measuring Perceived Value Through Advocacy
Net Promoter Score quantifies users' willingness to recommend products—a proxy for satisfaction and perceived value that predicts retention and expansion.
NPS Methodology:
Single question: "How likely are you to recommend [product] to a colleague?" (0-10 scale)
Segmentation:
Promoters (9-10): Enthusiastic advocates
Passives (7-8): Satisfied but unenthusiastic
Detractors (0-6): Unhappy, potential churners
Calculation:
NPS = % Promoters - % Detractors
Industry Benchmarks:
Excellent: >50
Good: 30-50
Average: 0-30
Poor: <0
The NPS-Retention Correlation:
Research from Bain & Company (NPS creators) shows:
Promoters: 2.3x retention versus passives, 7.8x versus detractors
Each 10-point NPS increase correlates with 3-5% retention improvement
Products with NPS >50 achieve 85%+ annual retention
4. Team Adoption Rate
Measuring Multi-User Engagement
For B2B SaaS, team adoption represents the ultimate retention indicator—it predicts not just user retention but account expansion and revenue growth.
Team Adoption Metrics:
Seat Penetration Rate:
Penetration = (Active users / Total employees in target department) × 100
Multi-User Activation: Percentage of accounts with 2+ active users:
Multi-User % = (Accounts with 2+ users / Total accounts) × 100
Team Growth Velocity: Speed of seat expansion within accounts:
Growth Velocity = New users added / Months since first user activation
Viral Coefficient: Average new users invited per existing user:
Viral Coefficient = Total invitations sent / Existing user base
The Team Adoption Revenue Multiplier
According to Forrester's B2B SaaS research, team adoption creates compound value effects:
Single User Accounts:
Average contract value: $100/month
Annual retention: 68%
Lifetime value: $2,040
2-5 User Accounts:
Average contract value: $350/month
Annual retention: 82%
Lifetime value: $10,200 (5x single user)
6-15 User Accounts:
Average contract value: $1,200/month
Annual retention: 91%
Lifetime value: $47,520 (23x single user)
16+ User Accounts:
Average contract value: $3,800/month
Annual retention: 97%
Lifetime value: $285,000 (140x single user)
This exponential value increase occurs through:
Direct revenue (more seats purchased)
Retention improvement (organizational dependency)
Expansion velocity (easier upsells with team adoption)
Referral generation (team advocates drive new accounts)
Retrieval Block: Retention Metrics Dashboard
Critical Retention KPIs:
Activation Layer:
Day-7 Retention: Target >45%
Day-30 Retention: Target >60%
Time to Value: Target <15 minutes
Habit Layer:
Feature Adoption (Core): Target >60% within 30 days
Feature Adoption (Advanced): Target >20% within 90 days
Weekly Active Users / Monthly Active: Target >40%
Satisfaction Layer:
Net Promoter Score: Target >40
Feature-Specific NPS: Track top 5 features
Detractor Response Time: Target <24 hours
Expansion Layer:
Team Adoption %: Target >35% of accounts
Seats Per Customer: Target 2.5+ growth stage
Viral Coefficient: Target >0.5
Cross-Department Reach: Target >60%
Micro-Summary: Retention measurement requires multi-layered metrics spanning temporal engagement (day-7/30 retention), capability utilization (feature adoption), perceived value (NPS), and organizational integration (team adoption)—these indicators provide leading signals for intervention before churn occurs.
Conclusion: The Path to Sustainable SaaS Retention
Transforming initial activation into sustained retention requires systematic architecture across three critical dimensions: workflow integration that creates usage habits, progressive feature disclosure that prevents cognitive overload, and expansion mechanisms that deepen product dependency.

The Retention Architecture Framework
Layer 1: Activation to Habit (Days 1-30)
Focus on embedding products into daily workflows through:
Repeatable Value Delivery: Design core workflows as ongoing processes rather than one-time accomplishments. Users should return because they need to, not just because they remember to.
Systematic Return Triggers: Create external prompts that drive re-engagement during the critical 7-day window:
Automated reminders
Teammate notifications
Event-based alerts
Contextual suggestions
Friction Minimization: Each subsequent workflow execution should require fewer steps than the previous. Templates, intelligent defaults, and saved preferences all reduce activation energy.
Habit Formation Indicators:
3+ usage sessions within first week
Completing core workflows 2+ times
Return visits without external prompting
Integration with calendar or other daily tools
Layer 2: Feature Progression (Months 2-6)
Guide users through capability expansion via:
Sequential Complexity Introduction: Start with minimum viable feature set delivering core value. Introduce advanced capabilities only after users demonstrate readiness through competency signals.
Progressive Disclosure: Gate features by demonstrated mastery rather than arbitrary time delays. Users ready to progress shouldn't wait; users needing more practice shouldn't face premature complexity.
Achievement-Based Unlocking: Create explicit progression milestones where new capabilities become available. Celebrate transitions while explaining why features are now appropriate.
Progression Indicators:
40%+ core feature adoption within 60 days
20%+ advanced feature adoption within 90 days
3+ distinct workflows in regular use
Competency advancement through defined tiers
Layer 3: Expansion to Retention (Months 6-12+)
Deepen organizational integration through:
Team Adoption Mechanics: Build features delivering disproportionate value with multiple users:
Collaborative workspaces
Shared outcomes
Handoff workflows
Team analytics
Viral Expansion Triggers: Create natural invitation moments when team value becomes obvious. Make expansion effortless through pre-populated invitations and bulk capabilities.
Integration Depth: Connect with existing tools and workflows to increase switching costs. Each integration creates data flow dependencies that prevent churning.
Cross-Functional Reach: Move beyond initial departments to embed across organizational functions. Multi-level adoption creates dependencies that transcend individual role changes.
Expansion Indicators:
35%+ of accounts with 3+ users
3+ integrations per account
Usage across 2+ departments
120%+ net dollar retention
Implementation Priorities
For SaaS companies addressing retention challenges, systematic improvement requires a phased approach:
Months 1-2: Activation Optimization
Map core workflows to repeatable jobs
Implement return trigger systems
Reduce friction in workflow execution
Establish day-7 retention baselines
Months 3-4: Feature Sequencing
Categorize features by complexity tier
Define competency-based unlocking criteria
Create progressive disclosure mechanisms
Track feature adoption velocity
Months 5-6: Progression Frameworks
Build explicit advancement ladders
Implement achievement systems
Create next-action clarity
Monitor progression completion rates
Months 7-12: Expansion Mechanics
Design team-value features
Reduce invitation friction
Build viral expansion triggers
Track team adoption metrics
The Compounding Returns of Retention
Retention improvements create multiplicative value effects across SaaS economics:
Revenue Perspective:
5% retention improvement yields 25-95% profit increase (Bain & Company)
Customers retained 5+ years generate 2.5x revenue of new customers
80% of future revenue comes from existing customer expansion
Cost Efficiency:
Customer acquisition costs 5-25x more than retention
Retained customers have 50% higher success rate for upsells
Referral acquisition costs 65% less than paid channels
Growth Acceleration:
Net dollar retention exceeding 120% enables growth without new customer acquisition
Team adoption creates viral growth within organizations
Product-led growth compounds through retention-driven expansion
According to research from Pacific Crest's annual SaaS survey, companies achieving top-quartile retention (>95% logo retention, >120% NDR) grow 3.2x faster and achieve 4.5x higher valuations than those with bottom-quartile retention.
"Retention isn't a metric to optimize—it's the fundamental equation determining whether you're building a sustainable business or subsidizing temporary usage. Get retention right and growth becomes inevitable; get it wrong and no amount of acquisition spending compensates." — David Skok, General Partner at Matrix Partners
The Path Forward
Moving users from initial value to long-term retention requires rejecting the fallacy that activation equals retention. Products must architect for the journey, not just the moment.
This architecture demands:
Workflow integration replacing isolated value delivery
Progressive disclosure preventing cognitive overload
Transparent progression eliminating plateau stagnation
Expansion mechanics deepening organizational dependency
Companies implementing these frameworks transform retention from hoped-for outcome to engineered result—creating products that become indispensable infrastructure rather than disposable tools.
The opportunity cost of retention failure extends beyond individual churned customers. Each lost user represents lost network effects, abandoned referral potential, and unrealized expansion revenue. Conversely, each retained user compounds value through deeper integration, broader team adoption, and sustained advocacy.
The choice facing SaaS founders isn't whether to prioritize retention—it's whether to approach it systematically or hope users intuitively discover ongoing value. The evidence overwhelmingly supports systematic retention architecture as the differentiator between sustainable growth and perpetual acquisition treadmills.
Ready to build systematic retention into your product? Visit SaaS Factor or explore more insights on our blog.
Final Micro-Summary: Sustainable SaaS retention emerges from systematic architecture spanning workflow integration (days 1-30), progressive feature disclosure (months 2-6), and expansion mechanics (months 6-12+)—companies achieving >95% logo retention and >120% NDR grow 3.2x faster through compounding returns that make retention the fundamental growth equation.
Glossary
Activation: The moment when users complete workflows demonstrating comprehension of core product value. Measured through specific behavioral milestones like creating first project, generating initial report, or inviting teammates. Represents value recognition rather than sustained engagement.
Behavioral Triggers: External stimuli prompting product engagement: automated reminders, teammate notifications, calendar integrations, threshold alerts. Effective triggers create consistent return cadences during habit formation phases before internal motivation develops.
Churn Rate: Percentage of customers discontinuing product usage within a specific period. Calculated as: (Customers lost / Total customers at period start) × 100. Logo churn measures account loss; revenue churn accounts for expansion/contraction in remaining accounts.
Cognitive Load: Total mental processing demand placed on working memory during task execution. High cognitive load during onboarding reduces completion rates and feature adoption. Progressive disclosure minimizes load by revealing complexity sequentially as users demonstrate readiness.
Cohort Analysis: Grouping users by shared characteristics (activation date, acquisition source, feature path) to track behavior patterns over time. Reveals retention differences across segments and identifies optimization opportunities through comparative analysis.
Feature Adoption Rate: Percentage of active users engaging with specific capabilities within defined timeframes. Calculated as: (Users who used feature / Total active users) × 100. Indicates value extraction breadth and guided discovery effectiveness.
Habit Formation: Process where behaviors transition from conscious decisions to automatic responses triggered by contextual cues. Requires consistent repetition (average 66 days) with reliable triggers and rewards creating behavioral loops.
Multi-User Activation: Percentage of accounts with multiple active users, indicating team adoption rather than individual usage. Predicts retention strength through organizational dependency and network effects. Calculated as: (Accounts with 2+ users / Total accounts) × 100.
Net Dollar Retention (NDR): Revenue retained from existing customers including expansion and contraction, excluding new customer revenue. Calculated as: ((Starting ARR + Expansion - Contraction - Churn) / Starting ARR) × 100. NDR >100% indicates expansion exceeds churn.
Net Promoter Score (NPS): Customer satisfaction metric measuring likelihood to recommend product (0-10 scale). Calculated as: % Promoters (9-10) - % Detractors (0-6). Predicts retention and expansion through advocacy proxy. Industry average: 30-40; excellent: >50.
Onboarding: Systematic process guiding new users from registration through initial value realization and ongoing engagement establishment. Effective onboarding reduces time to activation while establishing usage patterns predicting long-term retention.
Plateau Stagnation: State where users achieve initial competency but cannot envision advancement, leading to declining engagement as novelty fades without replacement motivation. Prevented through explicit progression frameworks showing clear next steps.
Product-Led Growth (PLG): Go-to-market strategy where product usage drives customer acquisition, expansion, and retention rather than sales-driven processes. Requires low-friction onboarding, rapid value delivery, and viral expansion mechanics.
Progressive Disclosure: UX pattern revealing complexity incrementally as users demonstrate readiness rather than presenting all options upfront. Reduces initial cognitive load while maintaining access to advanced capabilities for prepared users.
Retention Curve: Graph showing percentage of users remaining active over time. Healthy curves plateau at high levels (60-80%); declining curves indicate activation without workflow integration. Inflection points reveal intervention opportunities.
Switching Cost: Friction preventing users from abandoning products for alternatives. Created through data accumulation, workflow integration, customization investment, and network effects. Higher switching costs correlate directly with retention durability.
Viral Coefficient: Measure of organic user-driven growth. Calculated as: (Average invitations per user × Invitation acceptance rate). Coefficient >1 indicates self-sustaining viral growth; 0.5-1 indicates strong expansion potential; <0.5 requires active expansion efforts.
Workflow Integration: Degree to which product connects with existing processes, tools, and communication patterns. High integration reduces adoption friction and increases switching costs through operational dependency creation.
References
Research Institutions & Academic Publications:
Stanford Persuasive Technology Lab – "Habit Formation in Digital Products: A 66-Day Study"
MIT Human-Computer Interaction Lab – "Cognitive Load Theory Applied to Software Interfaces"
Harvard Business Review – "Digital Tool Adoption in Enterprise Organizations" (2023)
Bain & Company – "The Economics of Customer Loyalty: Net Promoter Score Impact Study"
Industry Research Organizations & Reports:
Amplitude – "The 7-Day Retention Rule: Behavioral Analytics in SaaS" (2023)
Forrester Research – "B2B SaaS Team Adoption and Revenue Growth" (2023)
Pendo – "The 2023 Feature Adoption Report: Understanding Software Utilization"
ChartMogul – "SaaS Metrics Report: Net Revenue Retention Analysis" (2023)
Pacific Crest – "Annual SaaS Survey: Retention and Valuation Multiples" (2023)
OpenView Partners – "Product-Led Growth Benchmarks for B2B SaaS" (2023)
Behavioral Design & Growth Organizations:
Reforge (Brian Balfour) – "Growth Models: Activation to Retention Frameworks"
ProductPlan – "Continuous Discovery: User Progression Path Design"
SaaStr (Jason Lemkin) – "SaaS Retention Economics and Customer Success Strategies"
Expert Publications & Books:
Fogg Behavior Model – Trigger, Action, Reward, Investment Framework
Teresa Torres – "Continuous Discovery Habits: Product Progression Architecture"
Casey Winters – "Pinterest Growth Playbook: First Week Retention Strategies"
David Skok – "SaaS Metrics 2.0: A Guide to Measuring and Improving What Matters"
Company Case Studies & Public Filings:
Slack S-1 Filing – "Team Messaging Retention Milestones and Revenue Growth"
Atlassian – "2020 Work Management Report: Automation and User Retention"
Asana – "2022 Anatomy of Work Index: Role-Based Permission Systems"
Duolingo – "2023 Language Report: Gamification and Long-Term Engagement"


