


Last Update:
Table of Contents
No headings found in Blog Content.
Share

Engagement Fundamentals:
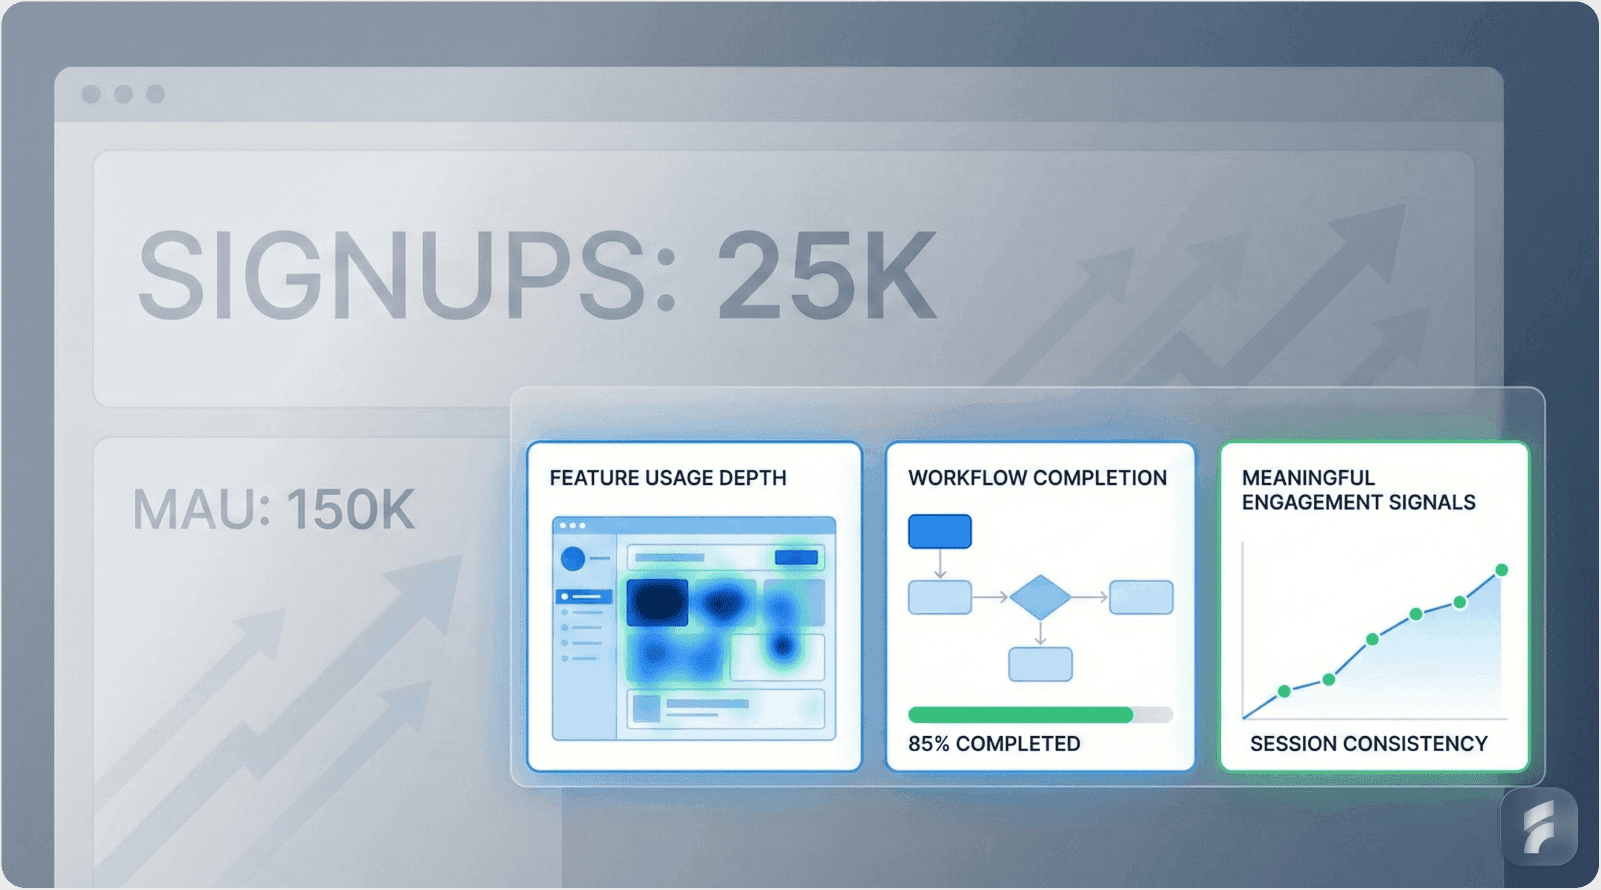
Product engagement tracks user interaction through metrics like logins, feature usage, and time spent—not vanity metrics like signups.
Engaged users are significantly more likely to pay continuously and generate more expansion revenue
Early-Stage Focus Areas:
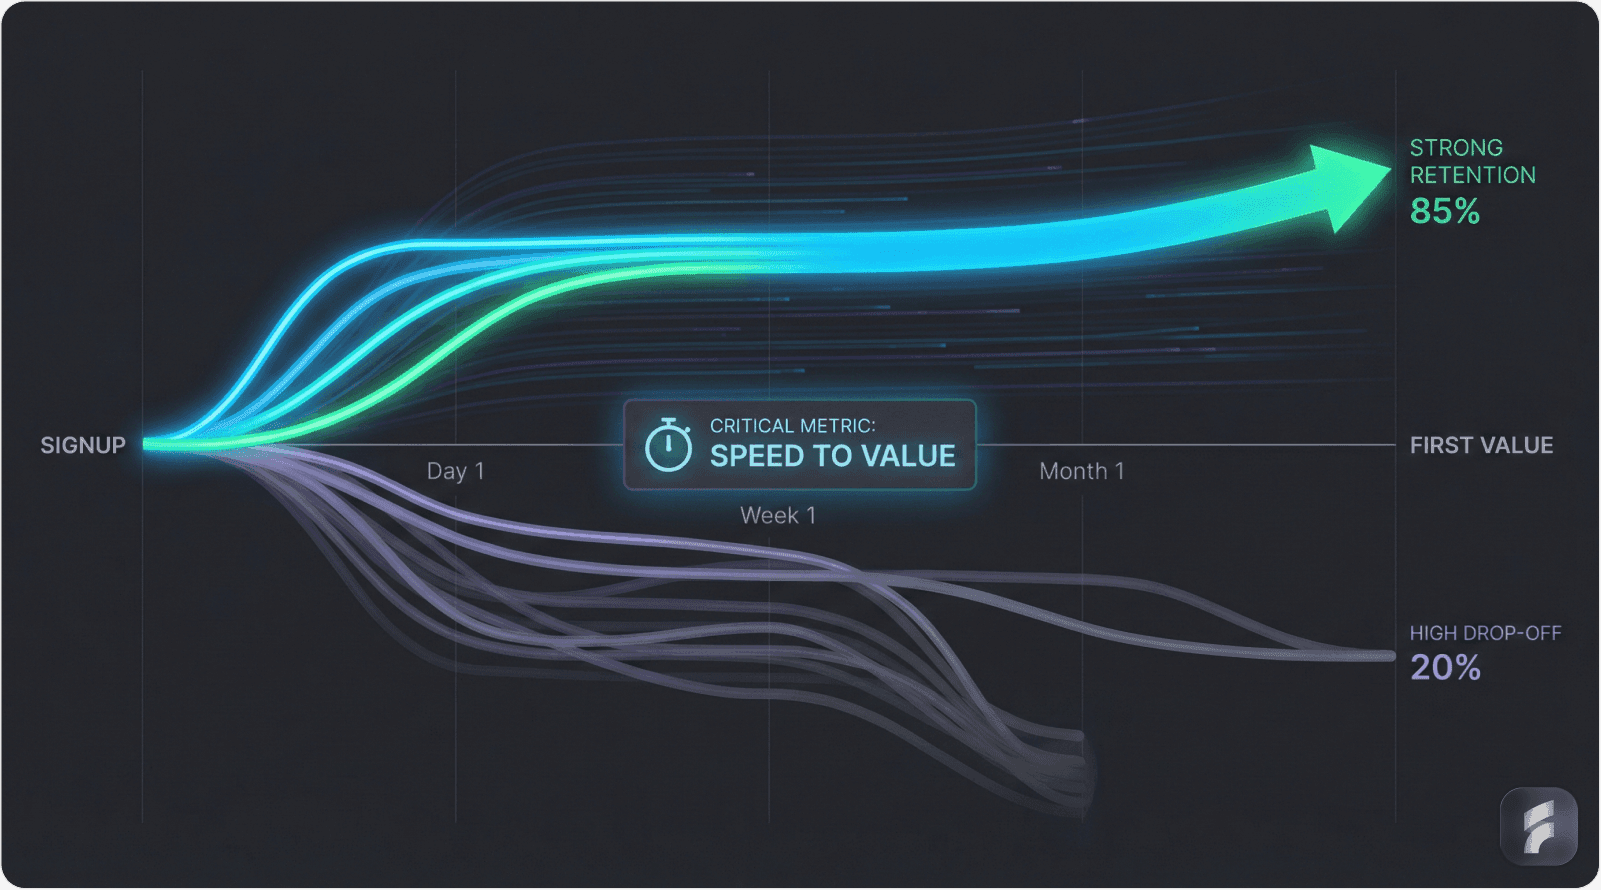
Focus on reducing Time to First Value (TTFV) by 50%, which can improve 90-day retention by 30%.
Prioritize meaningful metrics like activation rate and feature adoption over basic engagement metrics.
Use tools like Mixpanel, Amplitude, and Heap for early-stage analytics.
Growth-Stage Priorities:
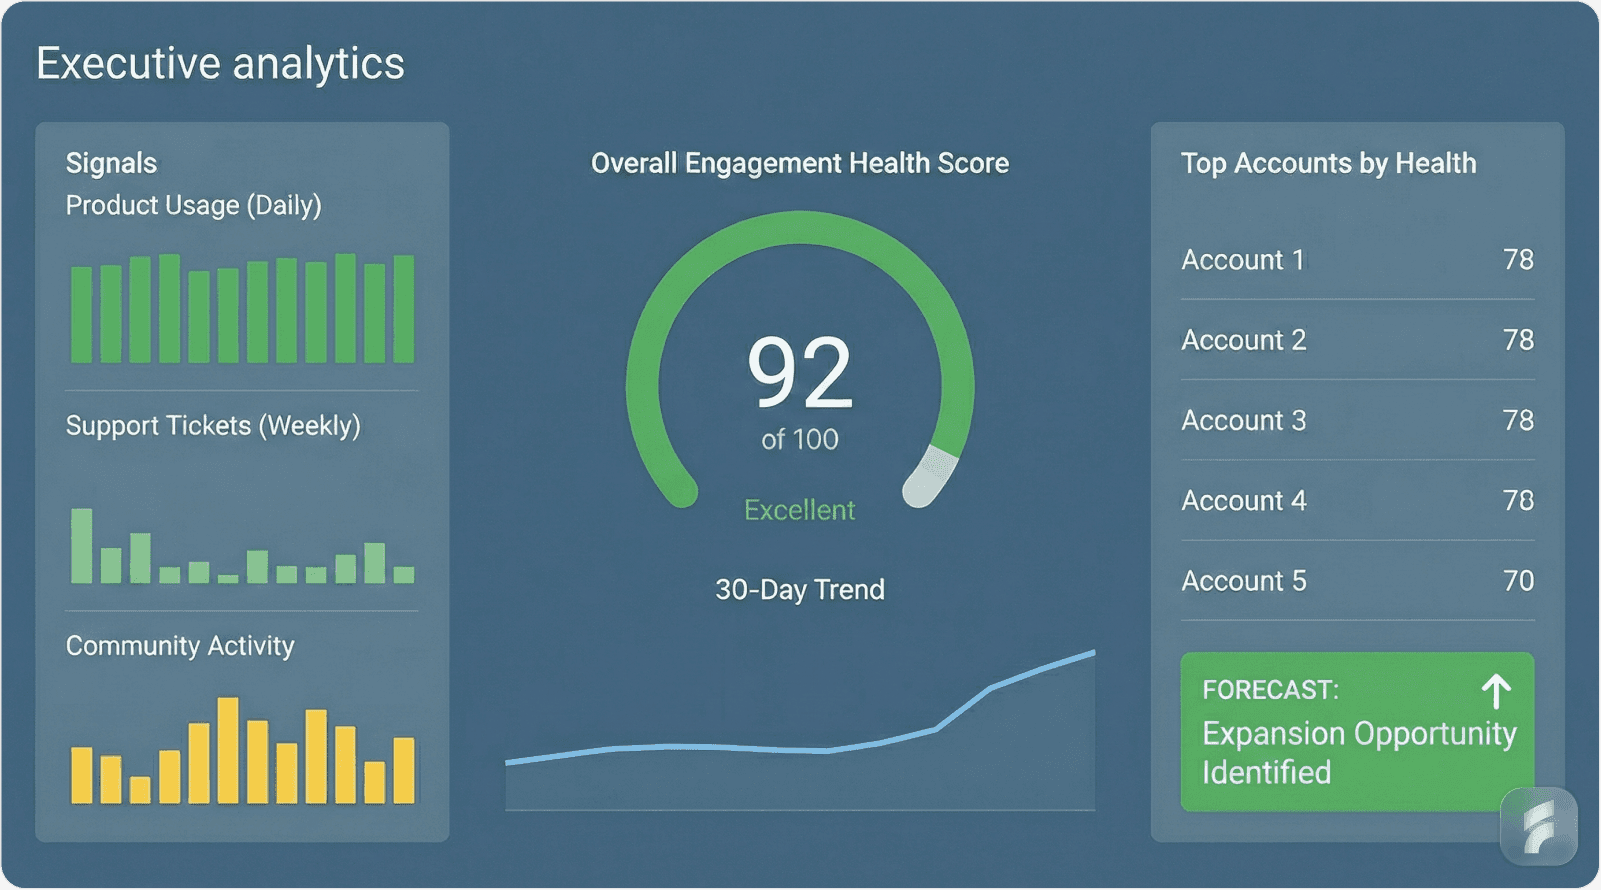
Shift to tracking Customer Lifetime Value (LTV), Net Revenue Retention (NRR), and engagement health scores.
Companies with better engagement tracking see significantly higher NRR.
Implement tools like Segment, Looker, and Tableau for advanced analytics.
Critical Success Metrics:
For high-performing SaaS, an activation rate of 40-60% within the first week is ideal.
Aim for an LTV/CAC ratio of 3:1 or higher for sustainable economics.
Achieve 30-50% retention by Week 4 to indicate product-market fit.
Behavioral Insights and Tools:
Early-stage companies should focus on tools like Google Analytics 4 and Mixpanel to track core metrics.
Growth-stage companies should use more advanced platforms like Gainsight and Pendo for deeper insights into user behavior and engagement.
Avoiding Pitfalls:
Avoid over-relying on vanity metrics (e.g., MAU, signups) and instead focus on actionable metrics.
Use segmentation to tailor strategies and don’t treat all users the same.
Actionable Principles:
Define clear business outcomes before selecting metrics.
Track actionable metrics—metrics that directly impact decisions and outcomes.
Case Studies:
Slack: Shifted focus from individual metrics to team-based engagement, leading to better retention.
Dropbox: Used behavioral segmentation to identify power users and optimize engagement, reducing churn by 23%.
Introduction: The Power of Product Engagement
In the competitive Software-as-a-Service landscape, engagement metrics represent far more than vanity numbers. They form the foundation of sustainable growth and revenue expansion. According to recent research from Bain & Company, a 5% increase in customer retention can boost profits by 25% to 95%. This statistic underscores why engagement analytics have become mission-critical for SaaS companies at every stage of maturity.
Understanding the Engagement Imperative
Product engagement measures the depth and frequency of user interactions with your platform. These interactions include feature activation, session duration, workflow completion rates, and behavioral sequences that indicate value realization.
For early-stage SaaS startups, engagement insights validate product-market fit (PMF) and guide iteration priorities. For growth-stage companies, sustained engagement drives long-term retention, expansion revenue, and customer lifetime value (LTV).
As Sean Ellis, founder of GrowthHackers, notes: "The companies that win are those that understand not just who their users are, but how deeply those users engage with the core value proposition."
The Data-Driven Engagement Framework
Analytics transform subjective assumptions into objective insights. They reveal behavioral patterns that guide strategic decisions across product development, customer success, and revenue optimization.
This comprehensive guide explores analytics implementation across two critical phases:
Early-Stage SaaS: Optimizing user experience and accelerating initial product adoption through engagement signals
Growth-Stage SaaS: Sustaining retention, measuring longitudinal engagement, and scaling customer base expansion
Understanding how to align your product design with engagement metrics is essential for building products that users love and continue using.
Micro-Summary: Engagement analytics provide the empirical foundation for SaaS success. Understanding how to measure, interpret, and act on engagement data separates thriving companies from those that struggle with retention and growth.
The Importance of Analytics for SaaS Engagement
Defining Product Engagement
Product engagement encompasses the qualitative and quantitative measures of user interaction depth. According to the Product-Led Growth Collective, engagement extends beyond simple usage metrics to include cognitive investment, emotional connection, and habitual behavior formation.
Definition Block:
Product Engagement = (Feature Adoption Rate × Usage Frequency × Session Duration) ÷ Activation Friction
Key engagement indicators include:
Login frequency and session consistency
Feature adoption breadth and depth
Time to value (TTV) achievement
Workflow completion rates
Cross-functional feature usage
Collaboration intensity metrics
The Engagement Gap Challenge
Research from Gartner reveals that 80% of businesses fail to convert initial user engagement into sustained retention. This engagement decay stems primarily from inadequate understanding of the user journey and misalignment between product capabilities and user mental models.
The Stanford Digital Economy Lab found that companies investing in behavioral analytics infrastructure see 3.2x higher retention rates compared to those relying on basic usage metrics alone.
Conducting a thorough UX audit can help identify these engagement gaps and reveal opportunities for improvement in your user journey.
Why Track Engagement?
Customer Retention and Revenue Stability
Engaged users demonstrate significantly higher retention propensity. HubSpot's 2024 SaaS Benchmark Report shows that highly engaged customers exhibit 3x greater retention likelihood than minimally engaged users.
As Lincoln Murphy, customer success strategist, observes: "Retention isn't about preventing cancellations. It's about continuously delivering value that makes cancellation unthinkable."
The retention-revenue correlation is substantial. Companies tracking engagement health scores report 67% lower churn rates according to Totango's Customer Success Benchmark Study.
Revenue Growth and Expansion Opportunities
Engagement analytics unlock upsell and cross-sell pathways. Pendo's Product Benchmarks Report indicates that companies with sophisticated engagement tracking achieve 2.1x more expansion revenue than those monitoring only basic metrics.
The correlation between engagement depth and revenue expansion is direct. Users who adopt three or more features generate 4x the lifetime value of single-feature users, according to Gainsight research.
Product Development Prioritization
Engagement data provides empirical validation for product roadmap decisions. The Nielsen Norman Group emphasizes that feature usage analytics reduce development waste by identifying high-impact improvements versus low-value additions.
According to MIT Sloan Management Review, data-driven product teams ship features with 40% higher adoption rates by leveraging engagement analytics during the design phase.
Micro-Summary: Analytics-driven engagement tracking delivers three critical benefits: improved customer retention through behavioral insights, expanded revenue via targeted upsell opportunities, and optimized product development through evidence-based prioritization.
Challenges in Product Engagement Tracking
Early-Stage SaaS: Getting the Data Right
Early-stage companies face unique analytical challenges. Limited user bases create statistical noise. Resource constraints restrict analytics infrastructure sophistication. Product iteration velocity complicates metric consistency.
The Vanity Metrics Trap
Many startups fixate on superficial indicators like monthly active users (MAU) or registration counts without examining behavioral quality. These metrics inflate perceived success while masking engagement deficiencies.
Problem Definition: Surface-level activity tracking without meaningful interaction depth analysis leads to misaligned optimization efforts and missed retention opportunities.
The Solution: Deep Engagement Signals
Effective early-stage analytics focus on activation quality over quantity. According to the Reforge Product Strategy Program, successful startups prioritize:
Time to First Value (TTFV): Duration between signup and initial value realization
Activation Rate: Percentage of users completing core workflow
Feature Adoption Depth: Number of distinct features used within first 30 days
Engagement Momentum: Week-over-week usage growth patterns
Research from OpenView Partners shows that reducing TTFV by 50% correlates with 30% higher 90-day retention rates.
Implementing UX optimization strategies can significantly reduce friction and accelerate time to first value for your users.
Real-World Case Study: Slack's Early Engagement Evolution
Slack faced initial challenges measuring meaningful engagement. Simple signup metrics provided insufficient insight into team adoption dynamics and collaborative value delivery.
Their analytics transformation focused on team-level engagement depth. Key metrics included:
Messages exchanged per team per day
Channel creation and participation rates
Integration activation frequency
Cross-team communication patterns
According to Stewart Butterfield, Slack's co-founder: "We realized that individual usage was meaningless. Team engagement was everything."
By shifting from individual to collective engagement metrics, Slack identified that teams sending 2,000+ messages demonstrated 93% retention likelihood. This insight drove targeted onboarding optimization and retention strategies.
The results were substantial. Slack's focus on engagement depth contributed to achieving 8 million daily active users within three years of launch, with best-in-class retention metrics.
Market Statistics and Industry Benchmarks
Current SaaS engagement tracking reveals significant trends:
48% of SaaS companies prioritize feature adoption and engagement depth as their primary analytics focus (Totango 2023 SaaS Benchmark Report)
73% of SaaS leaders report that user engagement data directly informs customer retention strategies (Forrester Research)
Companies tracking engagement health scores experience 2.5x faster time-to-value for new users (ChurnZero Analytics Study)
62% of early-stage SaaS companies struggle with distinguishing signal from noise in engagement data (SaaS Capital Index)
Essential Tools for Early-Stage SaaS
Google Analytics 4
Event-based tracking architecture for custom interaction monitoring
User journey visualization across touchpoints
Integration with product analytics platforms
Best for: Basic behavioral tracking and funnel analysis
Mixpanel
Advanced event tracking with property-level granularity
Cohort analysis for retention pattern identification
Time-to-event metrics for activation monitoring
Best for: Feature adoption tracking and user segmentation
Amplitude
Behavioral cohorts with predictive analytics capabilities
Retention curve analysis across user segments
Funnel optimization with conversion driver identification
Best for: Product-market fit validation and iteration guidance
Heap
Automatic event capture eliminating manual instrumentation
Retroactive analysis of historical user behavior
Session replay for qualitative understanding
Best for: Resource-constrained teams needing comprehensive tracking
Micro-Summary: Early-stage companies must transcend vanity metrics and implement behavioral analytics that reveal activation quality, feature adoption patterns, and engagement momentum. The right tooling combined with focused metric selection enables data-driven product iteration even with limited resources.
Growth-Stage SaaS: Refining Engagement and Expanding User Value
The Engagement Maturity Transition
Growth-stage companies operate with validated product-market fit and established customer bases. The analytical focus shifts from survival to optimization, from activation to expansion, and from basic tracking to sophisticated behavioral prediction.
According to Boston Consulting Group, companies transitioning from early to growth stage that maintain analytical rigor achieve 2.8x faster revenue growth than those that plateau on basic metrics.
The Sophistication Gap Challenge
Many growth-stage teams continue using early-stage analytics frameworks despite fundamentally different business requirements. This creates blind spots around expansion opportunities, churn predictors, and segment-specific engagement patterns.
Problem Definition: Teams struggle to evolve from basic engagement metrics to strategic insights that drive expansion revenue, reduce churn, and optimize customer lifetime value across diverse user segments.
The Solution: Advanced Engagement Architecture
Growth-stage analytics require multidimensional frameworks. As Julie Zhuo, former VP of Product Design at Facebook, states: "At scale, you're not optimizing for the average user. You're optimizing for the right behavioral patterns across distinct cohorts."
Key growth-stage metrics include:
Customer Lifetime Value (LTV): Predicted revenue per customer accounting for expansion and retention probability
Retention Cohorts: Time-series analysis of engagement persistence across acquisition periods
Feature Expansion Rate: Progression from initial to advanced capability adoption
Conversion Velocity: Time and touchpoints required for upgrade decisions
Engagement Health Score: Composite metric predicting churn risk and expansion readiness
Research from Pacific Crest Securities shows that SaaS companies tracking LTV/CAC ratios above 3:1 with detailed cohort analysis achieve 40% higher valuations than metrics-poor competitors.
For SaaS companies looking to scale their analytics capabilities, partnering with experienced product design teams can accelerate the implementation of sophisticated engagement frameworks.
Real-World Case Study: Dropbox's Retention and Expansion Strategy
Dropbox exemplifies growth-stage analytics sophistication. Moving beyond simple storage metrics, they implemented behavioral segmentation to identify high-value user patterns and expansion opportunities.
Their analytics transformation included:
Behavioral Segmentation
Power users identified through sharing frequency and collaboration depth
Viral coefficient tracking across referral patterns
Feature adoption sequences predicting upgrade likelihood
Usage intensity correlation with retention probability
Targeted Engagement Interventions
Personalized feature discovery based on usage patterns
Referral incentives aligned with viral user behaviors
Upgrade prompts timed to expansion readiness signals
Retention campaigns targeting at-risk user segments
Drew Houston, Dropbox CEO, emphasized: "Understanding not just what users do, but why they do it and what they might do next—that's where the value lies."
The results demonstrated analytics' strategic impact. Dropbox reduced annual churn by 23% while increasing expansion revenue by 35% through targeted engagement optimization.
Market Statistics and Growth Benchmarks
Current growth-stage engagement trends reveal:
77% of SaaS companies identify retention improvement as their top growth-stage analytics priority (ProfitWell SaaS Metrics Report)
36% of SaaS businesses achieved 20%+ revenue growth by leveraging engagement analytics for onboarding and retention optimization (McKinsey Digital)
Companies with sophisticated engagement health scoring reduce churn by 31% on average (Gainsight Customer Success Index)
Growth-stage companies tracking expansion engagement see 2.4x higher net revenue retention (NRR) than those monitoring only core usage (KeyBanc Capital Markets)
58% of SaaS executives cite engagement analytics as critical for achieving Rule of 40 benchmarks (SaaS Capital)
Essential Tools for Growth-Stage SaaS
Segment
Customer data platform consolidating cross-tool analytics
Identity resolution across devices and touchpoints
Real-time audience segmentation for personalization
Best for: Unified behavioral tracking across complex user journeys
Tableau
Advanced data visualization for executive-level insights
LTV modeling with cohort performance analysis
Expansion revenue attribution tracking
Best for: Strategic analytics and board-level reporting
Looker
SQL-based exploration for custom metric creation
Feature usage correlation analysis
Conversion trend identification across segments
Best for: Data-driven product and growth teams
Pendo
In-app analytics combined with user feedback collection
Feature adoption tracking with NPS correlation
Product analytics roadmap alignment
Best for: Product-led growth organizations
Gainsight
Customer health scoring with churn prediction
Engagement trending across customer lifecycle stages
Success plan alignment with usage patterns
Best for: Customer success-driven retention strategies
Micro-Summary: Growth-stage companies require sophisticated analytics architectures that track LTV, retention cohorts, feature expansion patterns, and engagement health scores. Advanced tooling enables the segmentation, prediction, and personalization necessary for scaling sustainable revenue growth.
Framework for Effective Product Engagement Analytics
Building a Data-Driven Engagement Strategy
Effective engagement analytics align measurement with business objectives, regardless of company stage. The Lean Analytics framework emphasizes finding the "one metric that matters" while maintaining visibility into supporting indicators.
According to Harvard Business Review, companies with clearly defined engagement frameworks achieve KPIs 3.5x faster than those with ad-hoc measurement approaches.
Step 1: Set Clear Engagement Goals
Objective Definition
Success requires concrete, measurable engagement targets aligned with business outcomes. Vague aspirations like "improve engagement" lack the specificity needed for analytical focus and optimization prioritization.
Goal Framework:
Specific: Define exact metrics and target values
Measurable: Ensure quantitative tracking capability
Achievable: Set realistic targets based on baseline performance
Relevant: Align with revenue and retention objectives
Time-bound: Establish clear deadline constraints
Example Goal Structures:
Early-Stage: Increase 7-day activation rate from 35% to 50% within 90 days by optimizing onboarding workflow and reducing time-to-first-value
Growth-Stage: Improve 12-month retention from 78% to 85% in the next two quarters by increasing feature adoption breadth among single-feature users
Research from the Product-Led Alliance shows that companies with quantified engagement goals achieve them 67% more frequently than those with qualitative aspirations.
Step 2: Measure Early Indicators of Engagement
Activation Metrics That Predict Retention
Early engagement signals provide predictive power for long-term user behavior. According to research from Reforge, users achieving core value within their first session demonstrate 4x higher 90-day retention.
Critical Early Indicators:
Time to First Value (TTFV): Duration from signup to initial value realization
Industry benchmark: Under 5 minutes for horizontal SaaS, under 15 minutes for vertical SaaS (OpenView Partners)
Activation Rate: Percentage completing essential workflow setup
High-performing SaaS: 40-60% activation within first week (Mixpanel Benchmarks)
Feature Adoption Velocity: Speed of secondary feature discovery
Engaged users adopt second feature within 72 hours (Amplitude Product Intelligence)
Engagement Frequency: Return visit consistency within first 30 days
3+ sessions weekly correlates with 80%+ retention (Pendo Product Benchmarks)
Real-World Application: Trello's Activation Focus
Trello identified that users creating their first board and inviting a collaborator within 24 hours achieved 75% higher long-term retention. This insight drove onboarding optimization prioritizing collaborative activation over individual task management.
Michael Pryor, Trello co-founder, explains: "We learned that collaboration, not organization, was the real activation moment. That shifted everything about our onboarding."
Step 3: Focus on User Segmentation and Cohorts
Behavioral Clustering for Targeted Optimization
User segmentation reveals distinct engagement patterns invisible in aggregate metrics. According to McKinsey, companies implementing behavioral segmentation achieve 10-20% revenue growth through targeted experience optimization.
Segmentation Dimensions:
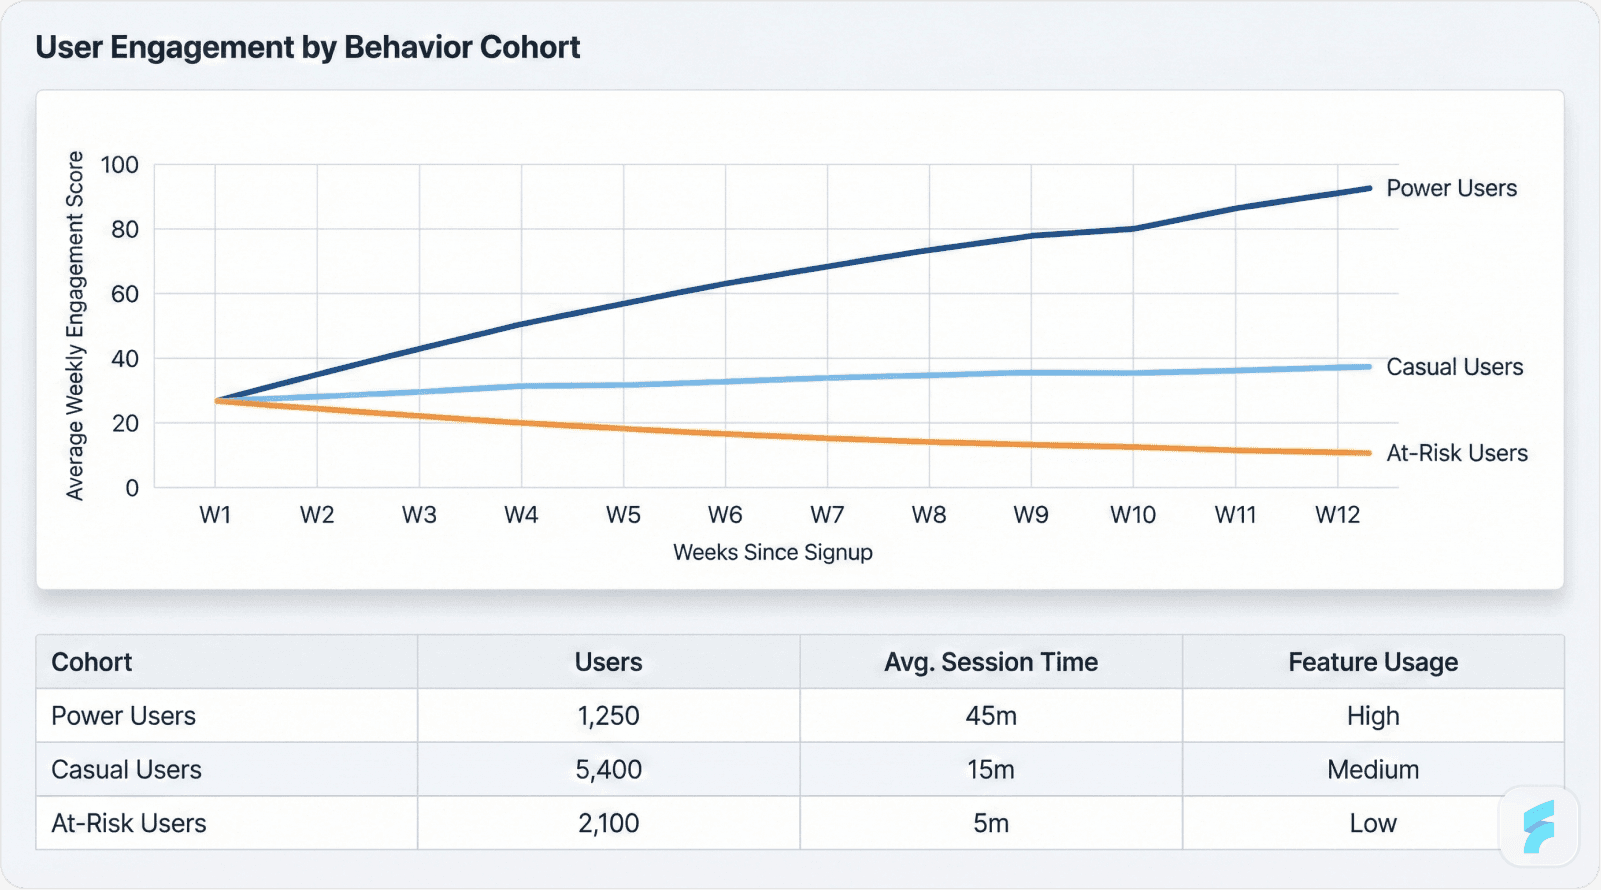
Behavioral Cohorts: Groups defined by action patterns (power users, casual users, at-risk users)
Acquisition Cohorts: Users grouped by signup period for retention trending
Feature Cohorts: Segments based on capability adoption patterns
Value Cohorts: Groups stratified by revenue contribution or expansion potential
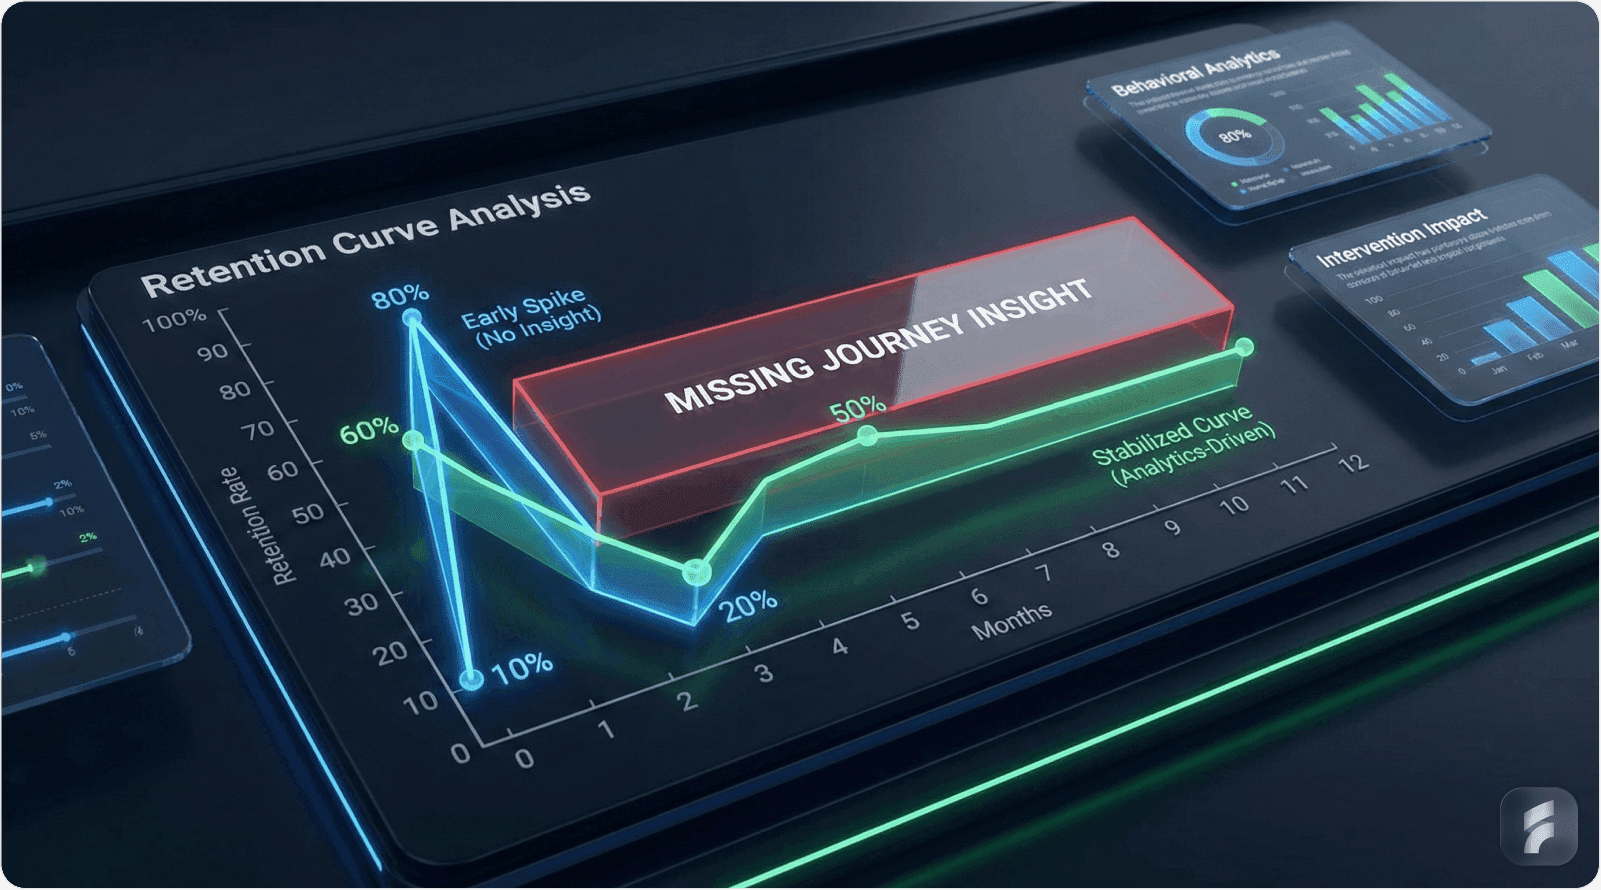
Cohort Analysis Framework
Cohort retention analysis reveals how engagement patterns evolve over time. According to Lenny Rachitsky's research on retention curves, products with strong product-market fit demonstrate flattening retention curves after initial drop-off.
Week 1 Retention: 40-60% for healthy SaaS products
Week 4 Retention: 30-50% retention floor indicates PMF
Week 12+ Retention: Curve flattening signals sustainable engagement
Real-World Application: Notion's Template Engagement Strategy
Notion's analytics revealed that users engaging with templates during their first month demonstrated 2.3x higher retention rates. This insight drove template discoverability optimization and personalized template recommendations.
Ivan Zhao, Notion CEO, notes: "Templates weren't just features—they were engagement catalysts that transformed how users experienced the product's potential."
By creating behavioral segments around template usage, Notion developed targeted retention campaigns and onboarding variations that significantly improved long-term engagement metrics.
Explore how Saasfactor helps companies implement data-driven design strategies that improve user engagement and retention.
Step 4: Leverage Retention Metrics
Longitudinal Engagement Analysis
Retention metrics provide the clearest signal of product value delivery. According to Andreessen Horowitz, retention is the single best predictor of product-market fit and sustainable growth potential.
Key Retention Frameworks:
Cohort Retention: Time-series tracking of engagement persistence across acquisition groups
Best practice: Weekly cohort analysis for SaaS products (Lenny's Newsletter)
Feature-Specific Retention: Adoption persistence for individual capabilities
High-value features: 60%+ 30-day retention (Mixpanel)
Resurrection Metrics: Re-engagement rates for churned or dormant users
Industry average: 15-25% resurrection within 90 days (ProfitWell)
Formula Block:
Net Retention Rate = [(Customers at Period End - New Customers) / Customers at Period Start] × 100
Real-World Application: Shopify's Advanced Feature Adoption
Shopify's analytics identified that merchants adopting Shopify Payments within their first 60 days demonstrated 45% lower churn and 3x higher GMV growth compared to third-party payment users.
This insight drove personalized onboarding sequences emphasizing Payments adoption. The team implemented behavioral triggers prompting Payments setup when merchants reached specific GMV thresholds, optimizing timing for maximum conversion likelihood.
Tobi Lütke, Shopify CEO, emphasized: "Every feature adoption decision is an engagement decision. We optimize for the adoption moments that predict long-term merchant success."
The results included 27% increase in Payments adoption and measurable improvement in merchant retention and expansion revenue.
Step 5: Use A/B Testing for Feature Engagement
Experimental Optimization of Engagement Drivers
Controlled experimentation eliminates subjective decision-making from engagement optimization. According to the Harvard Business Review, companies with strong experimentation cultures achieve 30% higher profit margins through systematic optimization.
A/B Testing Framework for Engagement:
Onboarding Flow Variations: Test sequence, length, and content density
Shopify found 3-step onboarding outperformed 7-step by 23% (First Round Review)
Feature Placement Testing: Optimize discoverability and interaction cost
50ms reduction in interaction latency improves conversion by 1-2% (Google Research)
Messaging and Copy Variations: Test value proposition clarity and calls-to-action
Personalized messaging increases engagement 20-40% (Optimizely Benchmarks)
Timing and Trigger Testing: Optimize when engagement prompts appear
Contextual triggers outperform time-based by 3x (Intercom Product Research)
Real-World Application: Slack's Onboarding Experimentation
Slack conducted extensive A/B testing on onboarding flows, testing variations including:
Channel creation prompts at different user journey stages
Team invitation timing and messaging
Feature discovery tour length and interactivity
Bot-guided versus self-directed setup experiences
Critical finding: Users engaging with team communication channels within their first session demonstrated 3.1x higher Week 4 retention compared to users completing other onboarding activities first.
Stewart Butterfield explains: "We learned that getting people into conversations, not showing them features, was the activation unlock. Testing proved what intuition couldn't."
This data-driven insight fundamentally reshaped Slack's onboarding strategy, prioritizing social engagement over feature education—a decision contributing to their exceptional retention metrics.
Micro-Summary: Effective engagement analytics require clear goals, early indicator tracking, behavioral segmentation, retention analysis, and experimental optimization. This five-step framework enables systematic improvement regardless of company stage, product type, or market vertical.
Conclusion
The Analytics-Driven Engagement Imperative
Product engagement represents the fundamental health metric for SaaS businesses. In an increasingly competitive landscape where switching costs continue declining and user expectations continuously rising, sustained engagement determines survival and success.
Analytics transform engagement from aspirational concept to operational reality. They provide the empirical foundation for product decisions, growth strategies, and resource allocation across the customer lifecycle.
From Measurement to Action
The true value of engagement analytics emerges not from data collection but from insight application. According to Bain & Company, companies translating analytics insights into systematic action achieve 5-6% higher profitability than analytics-rich but action-poor competitors.
Effective engagement optimization requires:
Measurement Discipline: Consistent tracking of validated engagement indicators
Analytical Rigor: Proper statistical interpretation avoiding correlation-causation errors
Strategic Alignment: Clear connections between engagement metrics and business outcomes
Organizational Commitment: Cross-functional adoption of data-driven decision-making
Iterative Improvement: Continuous refinement of measurement and optimization approaches
The Sustainable Growth Equation
By implementing the frameworks, tools, and strategies outlined in this guide, SaaS companies position themselves for sustainable growth. The equation is straightforward:
Formula Block:
Sustainable SaaS Growth = (Product Value × Engagement Depth × Retention Excellence) ÷ Acquisition Cost
Each component depends on analytics for optimization. Product value requires usage data to identify high-impact features. Engagement depth demands behavioral tracking to reveal interaction patterns. Retention excellence necessitates cohort analysis to predict and prevent churn.
As Tomasz Tunguz, venture capitalist at Theory Ventures, observes:
"The best SaaS companies don't just track engagement—they engineer it systematically using data as their primary design tool."
Looking Forward
The engagement analytics landscape continues evolving. Machine learning enables predictive modeling of churn risk and expansion opportunity. Product-led growth strategies increase dependency on granular behavioral insights. Customer expectations for personalization demand segmentation sophistication.
Companies investing in engagement analytics infrastructure today build competitive advantages that compound over time. The insights gained inform not just immediate optimizations but strategic positioning and long-term differentiation.
Whether you're an early-stage startup validating product-market fit or a growth-stage company scaling sustainable revenue, engagement analytics provide the compass guiding decision-making in an uncertain environment.
The path to SaaS success is paved with data. Those who measure engagement effectively, interpret signals accurately, and act decisively will thrive in an increasingly competitive landscape.
Discover how SaaS Factor's blog offers additional insights on product strategy, UX design, and growth optimization for SaaS companies at every stage.
Final Thought: Engagement is not a static achievement but a continuous commitment. The companies that win are those that treat engagement analytics not as a reporting exercise but as a strategic capability—systematically measuring, relentlessly optimizing, and constantly delivering value that makes users choose to stay, expand, and advocate.
References
Andreessen Horowitz - Product-market fit and retention frameworks
Atlassian - Cross-functional analytics and team performance research
Bain & Company - Customer retention and profitability research
Bessemer Venture Partners - Cloud software metrics and valuations
Boston Consulting Group - Growth-stage analytics and scaling strategies
ChurnZero - Engagement and churn prevention analytics
Forrester Research - Customer success and retention strategy insights
Gainsight - Customer health scoring and success metrics
Gartner - Enterprise SaaS engagement and adoption research
Google Research - User experience and performance impact studies
Harvard Business Review - Product management and engagement optimization
HubSpot - SaaS customer engagement benchmarks
KeyBanc Capital Markets - SaaS survey and performance metrics
Lean Analytics Framework - Startup metrics and measurement methodology
McKinsey Digital - Data-driven decision-making and analytics frameworks
MIT Sloan Management Review - Product development and analytics effectiveness
Mixpanel - Behavioral analytics benchmarks and best practices
Nielsen Norman Group - User experience and interaction cost research
OpenView Partners - SaaS benchmarks and expansion metrics
Optimizely - A/B testing and experimentation data
Pacific Crest Securities - SaaS Capital Efficiency research
Pendo - Product benchmarks and feature adoption data
Product-Led Growth Collective - PLG metrics and best practices
ProfitWell - Subscription analytics and retention research
Reforge - Product-led growth frameworks
SaaS Capital - Private SaaS company benchmarking
Stanford Digital Economy Lab - Behavioral analytics and retention studies
Totango - SaaS benchmark reports and engagement metrics
Y Combinator - Startup metrics and early-stage guidance


