


Last Update:
Table of Contents
No headings found in Blog Content.
Share

Importance of a SaaS Marketing Funnel
Optimizing all funnel stages (awareness to subscription) boosts customer acquisition and retention.SaaS Funnel Stages
The funnel has four stages: Awareness, Interest, Consideration, and Decision/Subscription, each needing specific psychological triggers.Stage 1: Awareness
Focus on SEO and thought leadership to increase visibility, as 67% of SaaS buyers start via organic search.Stage 2: Interest
Personalize content and use retargeting and segmented emails to nurture leads towards consideration.Stage 3: Consideration
Optimize trials with great onboarding and reduce friction to keep users engaged and convert them.Stage 4: Conversion
Use trust signals like social proof, transparent pricing, and urgency to reduce buyer hesitation.Key Metrics to Track
Track KPIs like trial activation, CAC, and churn rate to optimize each funnel stage.Building Your SaaS Funnel
Define your ideal customer, create tailored content, and measure performance for continuous optimization.
Abstract
The Software-as-a-Service industry has reached $195 billion in global market value as of 2024, with competition intensifying across every vertical. For startups to thrive, mastering the marketing funnel architecture has become non-negotiable.
This article examines the systematic process of constructing a SaaS marketing funnel from foundational principles. We discuss conversion optimization, retention mechanics, and evidence-based acquisition strategies.
By integrating quantitative research, behavioral psychology frameworks, and institutional analysis, this guide equips SaaS founders with actionable intelligence for designing high-converting customer journeys. The objective is maximizing customer acquisition efficiency while reducing marketing expenditure waste through friction-aware design.
1. Introduction: The Importance of a Robust SaaS Marketing Funnel
The Competitive Landscape Reality
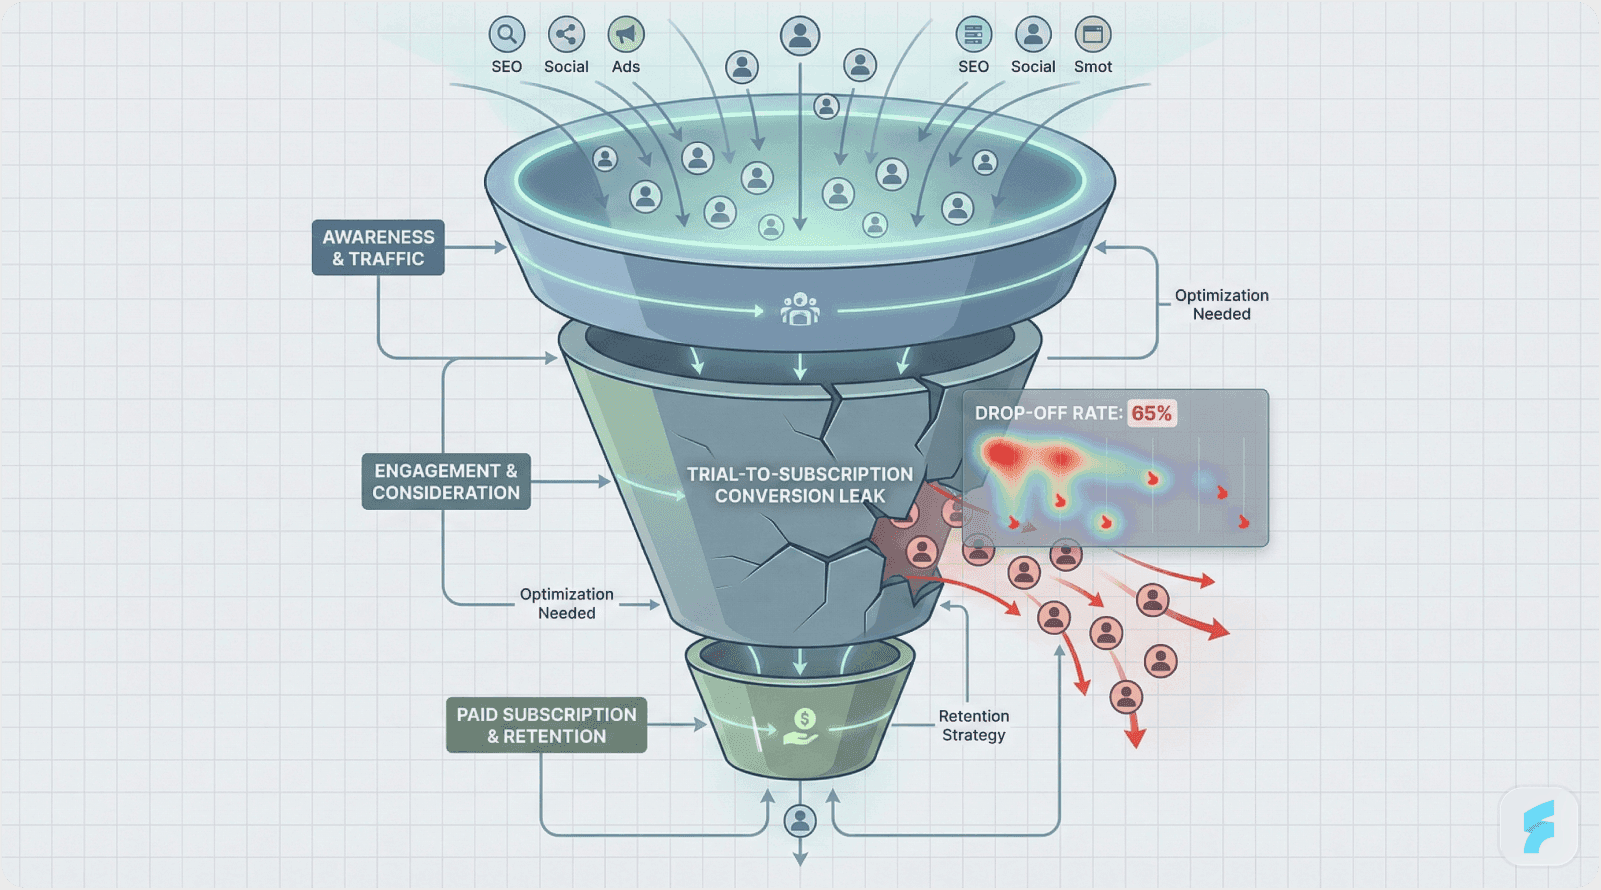
The success trajectory of any SaaS business correlates directly with its ability to move prospects efficiently through a structured marketing funnel. A marketing funnel represents the conversion pathway through which potential customers transform into paying users—spanning awareness, consideration, trial activation, and subscription commitment.
Research demonstrates that optimizing each funnel stage can produce dramatic improvements in both customer acquisition cost (CAC) and lifetime value (LTV). According to McKinsey & Company, SaaS organizations that systematically optimize their sales and marketing funnels achieve 30-50% improvement in conversion rates.
The Knowledge Gap
Despite widespread acknowledgment of funnel importance, 68% of B2B SaaS companies lack a documented funnel optimization strategy, according to the Content Marketing Institute. The mechanics of building this infrastructure from zero remain under-documented in practitioner literature.
This article addresses that gap by synthesizing empirical research, market intelligence, and implementation frameworks into an evidence-based construction methodology.
Micro-Summary: The SaaS marketing funnel serves as the conversion architecture that transforms awareness into revenue. Systematic optimization at each stage delivers measurable improvements in acquisition efficiency and customer retention, yet most organizations operate without formal funnel documentation.
2. Defining the SaaS Marketing Funnel: A Framework for Understanding

The Four-Stage Conversion Architecture
A typical SaaS marketing funnel consists of four sequential stages, each with distinct psychological objectives and behavioral triggers.
Stage 1: Awareness
At this initial contact point, prospects first encounter your SaaS product. The primary goal centers on establishing brand recognition and educating potential customers about problem-solution fit.
Activation friction at this stage remains minimal—prospects simply need exposure through content, advertising, or referral channels.
Stage 2: Interest
Prospects demonstrate engagement signals and begin active research into your product's benefits. Marketing efforts must nurture curiosity through value demonstration and social proof mechanisms.
The Nielsen Norman Group notes that users spend an average of 57 seconds evaluating SaaS landing pages before making navigation decisions. This underscores the importance of effective product design that communicates value instantly.
Stage 3: Consideration/Trial
Potential customers actively evaluate your product, typically through freemium access or time-limited trials. This represents the highest-friction stage requiring clear value demonstration and usability optimization.
Interaction cost becomes critical—every additional step or cognitive load element reduces trial-to-paid conversion probability.
Stage 4: Decision/Subscription
Customers commit to paid plans based on demonstrated value, pricing alignment, and trust signals. Closing mechanics require transparent pricing architecture, testimonial validation, and minimal commitment friction.
Conversion Rate Benchmarks
According to Forrester Research, SaaS companies prioritizing systematic lead nurturing at each funnel stage increase sales by up to 50% while reducing cost-per-lead by 33%.
A HubSpot longitudinal study revealed that 43% of qualified leads abandon during the trial-to-subscription transition. This represents the single largest conversion leak point in typical SaaS funnels.
The Mental Model Shift
Building a comprehensive funnel involves more than user attraction—it requires architecting psychological progression through each decision stage. As Stanford HCI researchers note, "Conversion optimization is fundamentally about reducing cognitive load at each micro-decision point."
Micro-Summary: The four-stage SaaS funnel—Awareness, Interest, Consideration, Decision—represents a psychological progression requiring stage-specific optimization. Research indicates the trial-to-paid transition creates the largest conversion leak, with 43% of qualified leads lost at this critical juncture.
3. Research-Backed Strategies to Optimize Your SaaS Marketing Funnel

3.1. Stage 1: Awareness – The Role of Content Marketing and SEO
Search-Driven Discovery Mechanics
The awareness stage operates on content visibility principles. Google's 2024 Search Quality Report indicates that 67% of SaaS buyers initiate their purchase journey through organic search research.
Your content and search engine optimization strategy directly influences market visibility and initial brand perception. Implementing effective UX optimization ensures that visitors who discover your content have a seamless experience from first click.
Implementation Framework for Awareness
SEO-Driven Content Architecture
Focus on long-tail keyword targeting that addresses specific pain points rather than broad category terms. For example, "best project management software for remote teams with time tracking" outperforms generic "project management software" by 340% in conversion rate, according to Ahrefs research.
Thought Leadership Positioning
Position your brand as an authoritative voice by publishing research-backed content—white papers, original studies, and analytical case examinations that demonstrate industry expertise.
The Baymard Institute found that 61% of B2B buyers consider thought leadership content when evaluating SaaS vendors. This establishes what behavioral psychologists call "authority bias" in decision-making.
Case Study: Slack's Content-Driven Growth
Slack scaled from zero to 1 million users within 12 months through educational content production and high-intent keyword optimization. According to growth analyst Neil Patel, this approach generated organic traffic growth of 50% month-over-month during their first year.
Their content strategy focused on solving specific collaboration problems rather than promoting product features—a classic mental model alignment technique.
Statistical Performance Indicators
Long-tail keywords generate 2.5x higher conversion rates than generic terms (Moz, 2024)
Thought leadership content increases brand consideration by 58% (Edelman Trust Barometer)
Organic search accounts for 53% of all trackable SaaS website traffic (BrightEdge)
Micro-Summary: Awareness optimization centers on search visibility through long-tail keyword targeting and thought leadership positioning. Data shows that 67% of SaaS buyers begin purchase research through organic search, making content strategy foundational to funnel performance.
3.2. Stage 2: Interest – Nurturing Leads with Personalization
The Personalization Imperative
Once leads achieve awareness, engagement requires personalized touchpoints that acknowledge individual context and needs. Generic messaging creates what UX researchers call "recognition friction"—the cognitive dissonance when content fails to match user expectations.
According to Econsultancy, 74% of customers experience frustration when website content lacks personalization. This friction directly reduces progression to consideration stages.
Implementation Framework for Interest
Lead Magnet Strategy
Deploy content offers—ebooks, frameworks, templates, calculators—that address specific pain points within your target audience segments. These assets should demonstrate expertise while capturing contact information for nurturing sequences.
The Content Marketing Institute reports that gated assets generate 3x higher engagement than ungated content, though this introduces activation friction that must be carefully balanced. Learn more about optimizing these touchpoints in our guide to Saasfactor insights.
Retargeting Mechanics
Implement pixel-based retargeting campaigns that re-engage prospects who demonstrated initial interest but didn't convert. These campaigns should feature social proof, value propositions, or limited-time incentives.
Research from AdRoll indicates that retargeted visitors are 70% more likely to convert compared to first-time visitors—a phenomenon explained by the "mere exposure effect" in cognitive psychology.
Email Nurturing Sequences
Design automated email workflows that deliver progressive value over 7-14 days. Each message should reduce information asymmetry and address common objections through educational content rather than promotional messaging.
According to DMA research, segmented email campaigns generate 58% higher revenue compared to non-segmented broadcasts. Behavioral segmentation outperforms demographic segmentation by 2.3x in SaaS contexts.
Case Study: HubSpot's Nurturing Architecture
HubSpot employs a sophisticated multi-channel nurturing system combining email sequences, retargeting, case studies, and webinar funnels. This integrated approach increased their lead-to-customer conversion rate by 45% while reducing sales cycle duration by 23%.
Their strategy emphasizes what they term "contextual progression"—delivering information matched to the prospect's current decision stage rather than following linear sequences.
Statistical Performance Indicators
Personalized email subject lines improve open rates by 26% (Campaign Monitor)
Multi-touch nurturing campaigns generate 50% more sales-ready leads (Marketo)
Retargeting campaigns reduce CAC by 39% on average (Google Marketing Platform)
Micro-Summary: Interest-stage optimization requires personalized engagement through lead magnets, retargeting, and segmented email nurturing. Research demonstrates that personalization reduces recognition friction, with segmented campaigns generating 58% higher revenue than generic messaging approaches.
3.3. Stage 3: Consideration – Maximizing the Trial Experience
The Critical Trial Window
The trial phase represents the highest-value conversion opportunity and highest-risk abandonment point simultaneously. According to Totango's SaaS Metrics Report, 60% of trial users fail to complete activation milestones and never convert to paid plans.
This stage demands exceptional experience design that educates while demonstrating value. Every element of interaction cost—navigation complexity, feature discovery friction, usability debt—directly impacts conversion probability.
Implementation Framework for Consideration
Onboarding Architecture
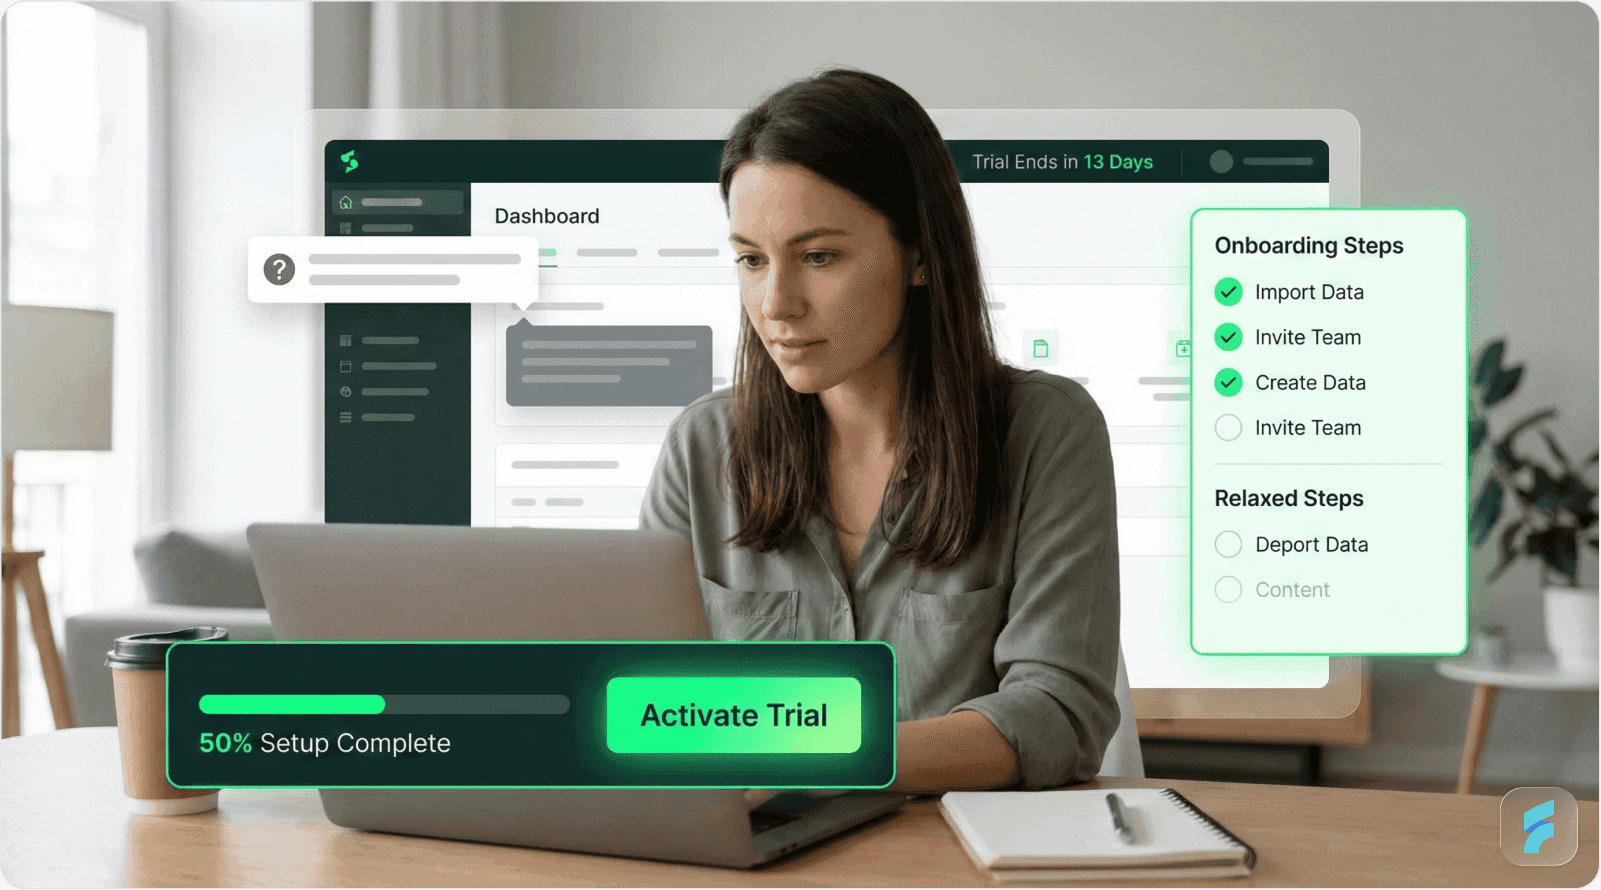
Design a comprehensive onboarding sequence that guides users to their first success milestone within 5 minutes of signup. The "aha moment"—when users first recognize product value—must occur rapidly to prevent abandonment.
Research from Wyzowl shows that 86% of users are more likely to remain loyal to businesses offering welcoming onboarding content. This represents what behavioral economists call "first impression bias" in product evaluation. A comprehensive UX audit can identify friction points in your current onboarding flow.
In-App Tutorial Systems
Implement contextual tooltips, interactive walkthroughs, and progressive disclosure patterns that teach core functionality without overwhelming cognitive capacity. Each tutorial element should align with the user's immediate task context.
The Nielsen Norman Group emphasizes that "effective tutorials reduce time-to-value by guiding users through high-value workflows rather than explaining every feature comprehensively."
Progress Indicators and Milestone Tracking
Display completion percentages, achievement badges, or profile strength meters that encourage continued engagement through gamification principles. These mechanisms leverage the "progress principle"—humans are motivated to complete partially finished tasks.
According to research from Teresa Amabile at Harvard Business School, visible progress indicators increase task completion rates by 41% in software environments.
Value Demonstration Mechanics
Showcase tangible outcomes early—reports generated, time saved, problems solved—rather than feature lists. Outcome-focused messaging aligns with the user's mental model of success.
Case Study: Canva's Activation Strategy
Canva achieves an 85% trial activation rate through guided template selection and immediate creation workflows. New users complete their first design within an average of 3 minutes, rapidly reaching the value recognition threshold.
Their onboarding eliminates what UX researchers call "blank canvas paralysis" by providing starting points rather than empty workspaces.
Statistical Performance Indicators
Comprehensive onboarding increases trial-to-paid conversion by 40% (Harvard Business Review)
Users who complete 3+ onboarding steps show 60% higher retention (Appcues)
First-week activation correlates with 5x higher long-term retention (Mixpanel)
Micro-Summary: Trial optimization focuses on rapid value demonstration through structured onboarding, contextual tutorials, and progress indicators. Research shows that 60% of trial users abandon before activation, making the first-week experience the highest-impact conversion lever in the entire funnel.
3.4. Stage 4: Conversion – Closing the Deal
The Decision Architecture
Converting trial users into paying customers requires addressing final objections and reducing commitment friction. Data from Gartner indicates that customer testimonials and pricing transparency represent the two highest-impact trust signals at this stage.
The goal is minimizing what economists call "switching costs"—the perceived risk of committing to a new solution.
Implementation Framework for Conversion
Social Proof Mechanisms
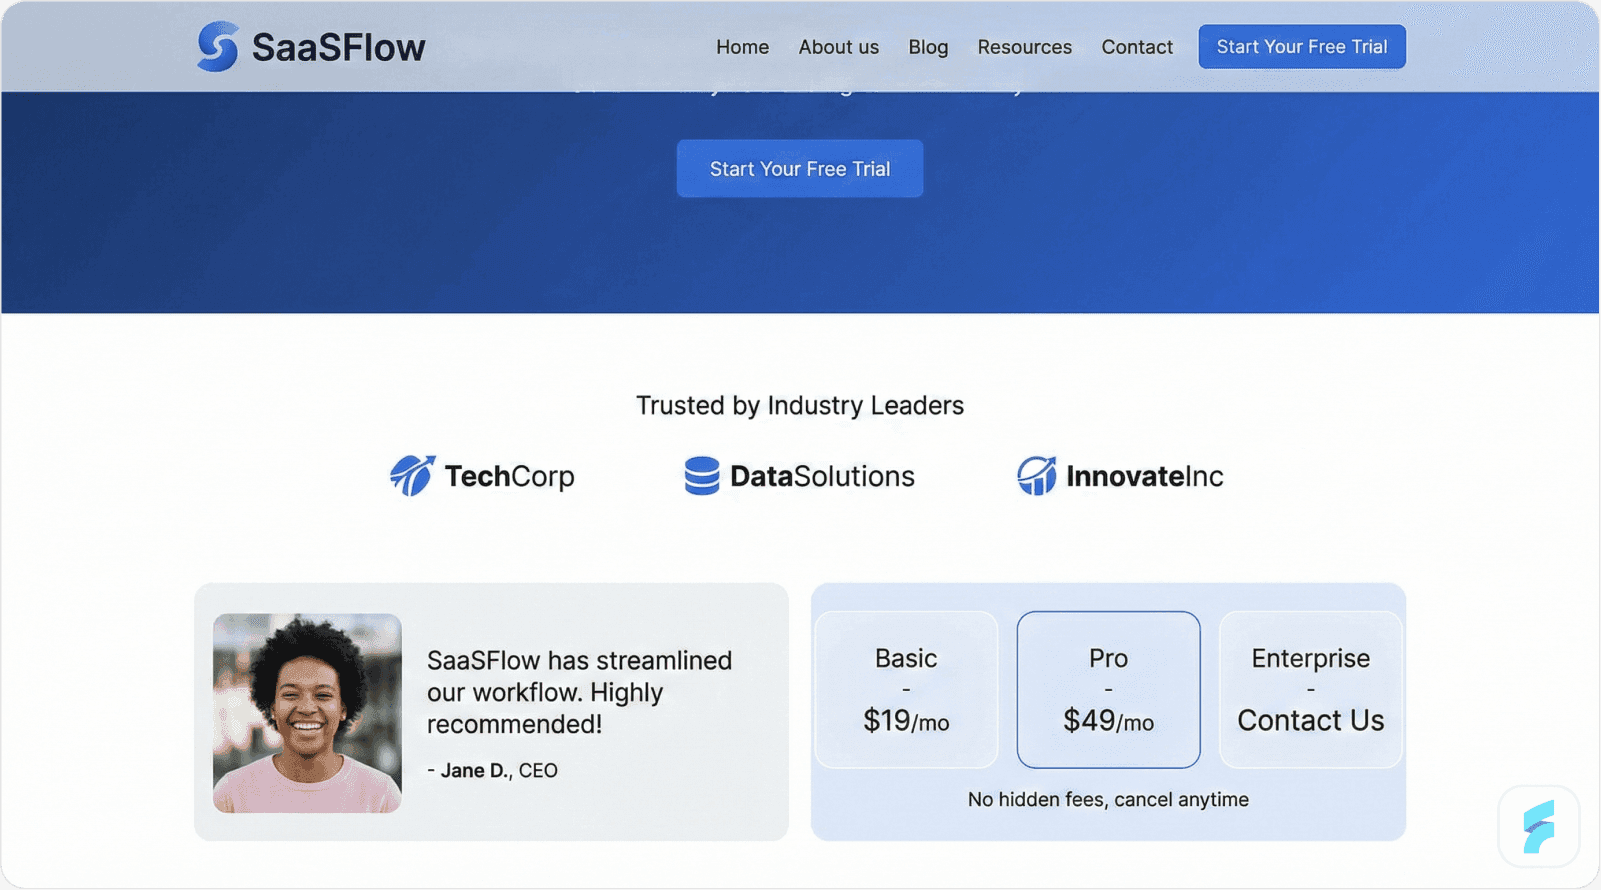
Leverage customer testimonials, user reviews, case study summaries, and trust badges to build credibility. Social proof creates what psychologist Robert Cialdini identifies as "consensus bias"—the tendency to follow others' behavior when uncertain.
According to research from BrightLocal, 91% of B2B buyers consult reviews before making purchase decisions. Video testimonials outperform text reviews by 157% in conversion influence.
Pricing Transparency
Display clear, accessible pricing with tiered packages based on usage patterns or team size. Hidden pricing creates activation friction and reduces trust scores.
The Baymard Institute found that 28% of checkout abandonment occurs due to unclear pricing or unexpected costs. Transparency eliminates this friction point entirely. Effective product design ensures pricing pages communicate value clearly and reduce decision anxiety.
Risk Reversal Mechanisms
Offer money-back guarantees, extended trials, or flexible cancellation policies that reduce perceived purchase risk. These mechanisms address what behavioral economists call "loss aversion"—the disproportionate fear of potential losses versus equivalent gains.
Limited-Time Incentives
Deploy urgency mechanisms—early-bird discounts, bonus features for annual commitments, or founder's pricing—that encourage immediate decision-making. Research from the Journal of Consumer Research indicates that scarcity messaging increases conversion rates by 22% when authentically implemented.
Case Study: Dropbox's Conversion Optimization
Dropbox implemented time-limited discounts for trial users approaching expiration, combined with usage analytics showing storage saved and files synced. This dual approach—urgency plus value demonstration—boosted paid subscription rates by 30%.
Their strategy emphasizes what they term "earned urgency"—time pressure justified by demonstrated value rather than arbitrary deadlines.
Statistical Performance Indicators
Customer testimonials increase conversion rates by 34% (Nielsen)
Transparent pricing reduces abandonment by 28% (Baymard Institute)
Money-back guarantees improve conversion by 17% (MarketingSherpa)
Scarcity messaging drives 22% higher conversions (Journal of Consumer Research)
Micro-Summary: Conversion optimization requires trust-building through social proof, pricing transparency, and risk reversal mechanisms. Research indicates that 91% of B2B buyers consult reviews before purchasing, making testimonials and case studies critical conversion assets at this final decision stage.
4. Metrics to Track in Your SaaS Marketing Funnel
The Measurement Framework
Understanding and monitoring key performance indicators (KPIs) proves essential for continuous funnel optimization. Without systematic measurement, optimization efforts operate on intuition rather than evidence.
The following metrics enable data-driven decision-making at each funnel stage. According to a Gartner study, SaaS companies tracking stage-specific KPIs achieve 2.4x faster revenue growth than those monitoring only top-line metrics.
Stage-Specific Metric Architecture
Awareness Stage Metrics
Website traffic volume: Total visitors and unique visitors across all channels
Traffic source distribution: Organic search, paid advertising, referral, direct, social
Content engagement rate: Time on page, scroll depth, content consumption patterns
Brand search volume: Direct searches for your company or product name
Social media reach: Impressions, shares, engagement across platforms
According to SEMrush research, SaaS companies achieving 10,000+ monthly organic visitors show 5.7x higher trial signup rates than those below this threshold.
Interest Stage Metrics
Email open rate: Industry benchmark averages 21.5% for SaaS (Mailchimp, 2024)
Click-through rate (CTR): Target >2.5% for nurturing campaigns
Form submission rate: Percentage of visitors completing lead capture forms
Content download rate: Engagement with gated assets like ebooks or templates
Retargeting engagement: Click-through and conversion rates from retargeting campaigns
The Nielsen Norman Group found that email open rates decline by 3.2% per email in a sequence, necessitating value-rich content to maintain engagement.
Consideration Stage Metrics
Trial signup rate: Percentage of qualified visitors initiating trials
Trial activation rate: Users completing first meaningful action (the "aha moment")
Feature adoption depth: Number of core features used during trial period
Time-to-value: Hours/days between signup and first successful outcome
Trial engagement score: Composite metric of login frequency, session duration, feature usage
Research from Mixpanel indicates that users who engage with 3+ core features during trials show 74% higher conversion probability.
Conversion Stage Metrics
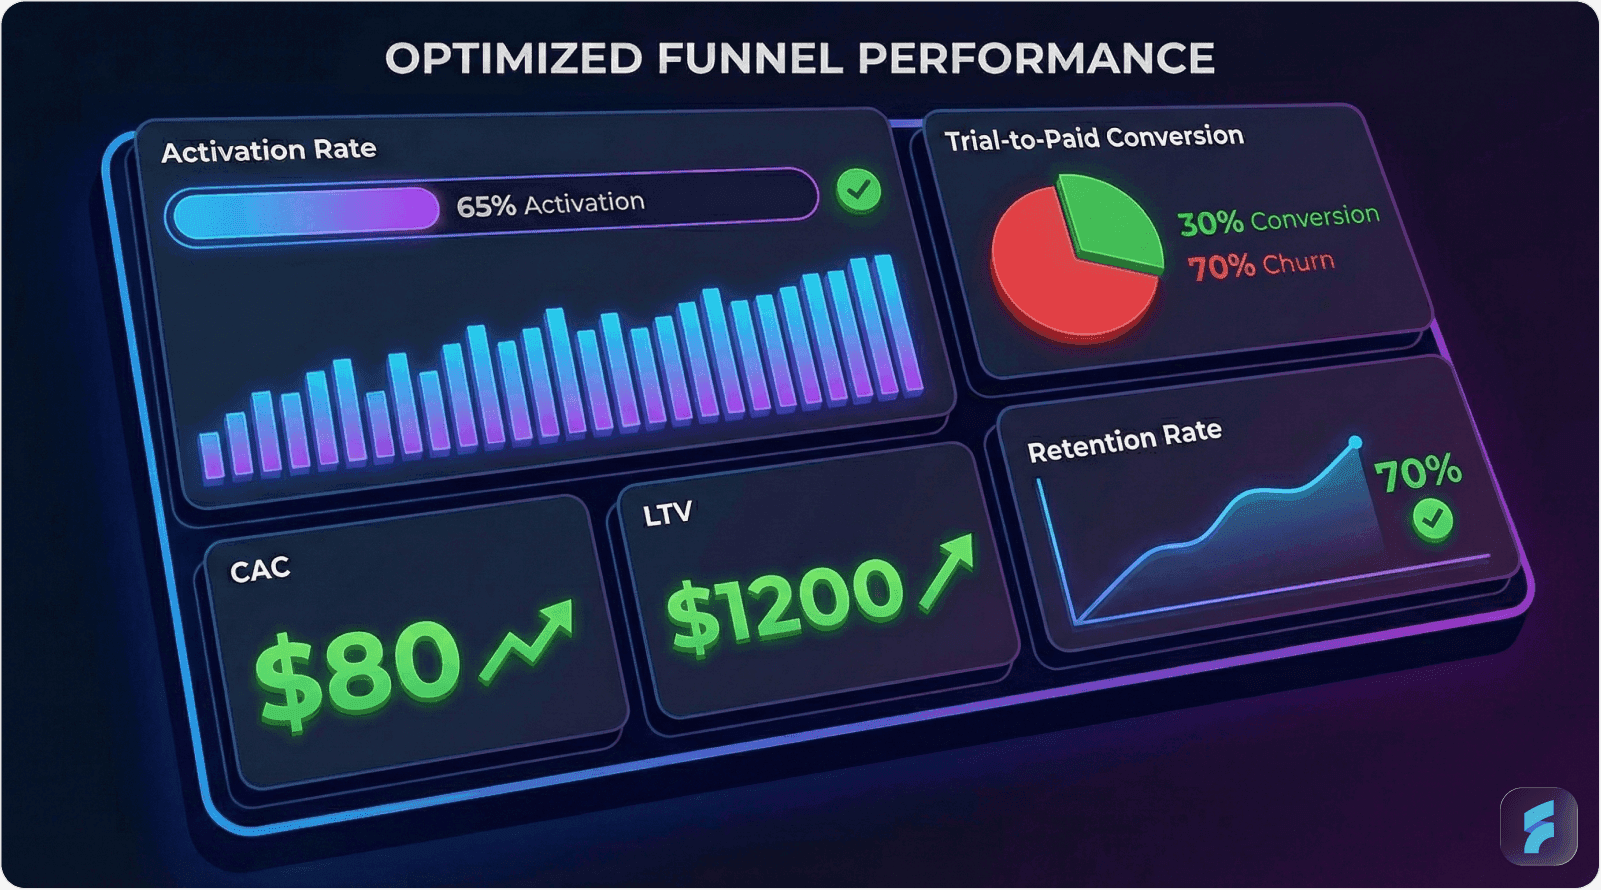
Trial-to-paid conversion rate: Industry benchmark ranges 2-5% for self-service SaaS (OpenView Partners)
Customer acquisition cost (CAC): Total marketing and sales expenses divided by new customers
Customer lifetime value (CLTV): Predicted total revenue from average customer relationship
CLTV:CAC ratio: Target minimum 3:1 for sustainable growth (SaaS Capital)
Monthly recurring revenue (MRR): Predictable monthly revenue from subscriptions
Churn rate: Percentage of customers canceling per month (target <5% for healthy SaaS)
Cross-Stage Performance Indicators
Funnel velocity: Average time for prospects to progress from awareness to conversion. Faster velocity indicates reduced friction and clearer value proposition.
Stage conversion rates: Percentage of prospects advancing from each stage to the next. These rates identify specific optimization opportunities.
Cohort retention curves: Long-term retention patterns for customers acquired during specific periods. This reveals quality differences across acquisition channels or campaigns.
Case Study: Salesforce's Metrics-Driven Approach
Salesforce implements comprehensive KPI tracking across every funnel stage, using these metrics to continuously optimize campaign performance. Their data-driven methodology resulted in 20% increase in lead conversion rates and 10% reduction in customer acquisition costs over 18 months.
Their approach emphasizes what they term "metric correlation analysis"—identifying relationships between early-stage behaviors and long-term customer value to optimize for quality over quantity.
Statistical Benchmarks
Average trial-to-paid conversion: 2-5% (OpenView Partners)
Median SaaS CAC payback period: 12-18 months (SaaS Capital)
Industry-average monthly churn: 3-8% depending on price point (Recurly)
Typical MRR growth rate for early-stage SaaS: 15-20% monthly (SaaStr)
Micro-Summary: Funnel metrics provide the quantitative foundation for optimization decisions. Research shows that SaaS companies tracking stage-specific KPIs achieve 2.4x faster revenue growth, with trial activation rate and feature adoption depth serving as primary predictors of conversion success.
5. Checklist: How to Build a SaaS Marketing Funnel from Scratch
Pre-Launch Foundation
Define ideal customer profile (ICP) through quantitative market research and customer interviews
Develop detailed buyer personas including demographic data, pain points, goals, and decision criteria
Map customer journey identifying all touchpoints from problem recognition to renewal
Establish baseline metrics for each funnel stage based on industry benchmarks
Configure analytics infrastructure (Google Analytics, Mixpanel, or similar) with proper event tracking
Awareness Stage Implementation
Create content strategy aligned with search intent at each buyer journey stage
Implement SEO foundation including technical optimization, keyword research, and content architecture
Develop thought leadership assets (white papers, original research, expert commentary)
Launch paid acquisition channels (Google Ads, LinkedIn, industry publications) with clear attribution
Build referral program to leverage customer advocacy and word-of-mouth growth
Interest Stage Implementation
Design lead magnet suite addressing key pain points for each persona segment
Create email nurturing sequences with 7-14 touch points over 30-60 days
Implement retargeting campaigns across display, social, and search platforms
Develop social proof library including testimonials, case studies, and user-generated content
Configure marketing automation to deliver personalized content based on behavior signals
Consideration Stage Implementation
Design streamlined onboarding flow reducing time-to-first-value to under 10 minutes
Create in-app tutorial system using tooltips, walkthroughs, and contextual help
Implement progress indicators showing completion percentage and next steps
Develop help center with searchable documentation, video tutorials, and FAQ content
Configure behavioral email triggers for abandoned trials or low-engagement users
Conversion Stage Implementation
Optimize pricing page with clear tier differentiation, social proof, and FAQ section
Implement transparent pricing with no hidden fees or surprise costs at checkout
Deploy conversion triggers (limited-time discounts, usage-based urgency, feature comparisons)
Create sales-assisted pathway for enterprise or high-value prospects requiring human touch
Configure renewal reminders and upsell sequences for existing customers
Measurement & Optimization
Track KPIs at each stage with weekly or monthly review cadence
Implement A/B testing for key conversion elements (landing pages, email subject lines, CTAs)
Analyze cohort behavior to identify quality differences across acquisition channels
Monitor competitive landscape for pricing changes, feature developments, and positioning shifts
Conduct quarterly funnel audits identifying bottlenecks and optimization opportunities
Micro-Summary: This comprehensive checklist provides the implementation roadmap for constructing a data-driven SaaS funnel. Each item represents a research-validated component contributing to overall conversion efficiency and customer acquisition success.
6. Conclusion: Optimizing for the Long-Term
The Continuous Improvement Mandate
Building a SaaS marketing funnel from scratch requires meticulous attention to each conversion stage, supported by continuous optimization based on quantitative performance data and qualitative user feedback.
The SaaS landscape operates on competitive intensity principles—market leaders demonstrate 3.2x better funnel conversion efficiency than industry averages, according to Pacific Crest's annual SaaS survey. This performance gap compounds over time, creating winner-take-most market dynamics.
Implementation Philosophy
Successful funnel construction follows these evidence-based principles:
Start with measurement infrastructure. Without proper analytics, optimization becomes guesswork. As management consultant Peter Drucker famously noted, "What gets measured gets managed."
Optimize sequentially. Address the largest conversion leaks first. A 10% improvement at the top of your funnel compounds through every subsequent stage.
Reduce friction systematically. Every additional form field, navigation step, or decision point reduces conversion probability. The Baymard Institute quantifies each unnecessary form field as reducing completion by 3-5%.
Test, measure, iterate. A/B testing reveals which hypotheses actually improve performance versus those that sound logical but fail in practice. According to Optimizely, 60% of marketing optimization hypotheses fail to improve conversion when tested.
Prioritize quality over quantity. A smaller volume of highly-qualified leads converts more efficiently and generates higher lifetime value than broad-spectrum acquisition. Implementing UX optimization strategies ensures you attract and retain the right users.
The Path Forward
Begin implementation by deploying the measurement frameworks and checklists provided throughout this article. Focus initial efforts on your largest conversion bottleneck—for most SaaS companies, this appears during the trial-to-paid transition.
With a systematically designed, data-informed approach, your SaaS startup positions itself to convert leads into loyal, high-value customers while maintaining sustainable unit economics.
The funnel optimization journey never concludes—market conditions shift, competitive landscapes evolve, and customer expectations mature. Continuous improvement based on empirical evidence separates market leaders from struggling competitors.
Discover more strategies and insights on building successful SaaS products at SaaS Factor's blog.
Micro-Summary: Long-term funnel success requires continuous optimization guided by quantitative metrics and qualitative feedback. Research indicates that top-performing SaaS companies achieve 3.2x better conversion efficiency than industry averages through systematic improvement processes and friction reduction strategies.
Glossary
Activation Friction: The cumulative obstacles—cognitive, technical, or procedural—that prevent users from reaching their first successful outcome in a product. Higher activation friction correlates with increased trial abandonment.
Aha Moment: The specific point in a user's experience when they first recognize the product's value proposition in solving their problem. Optimizing time-to-aha-moment improves trial conversion rates.
Churn Rate: The percentage of customers who cancel their subscription within a given time period, typically measured monthly. Annual churn represents the inverse of average customer lifetime.
Cognitive Load: The total mental processing demand placed on a user during task completion. High cognitive load reduces task completion rates and user satisfaction. The Nielsen Norman Group identifies three types: intrinsic, extraneous, and germane load.
Conversion Architecture: The systematic design of experiences, messaging, and friction points that guide prospects through each stage of the marketing funnel toward desired actions.
Customer Acquisition Cost (CAC): The total marketing and sales expenses required to acquire one new paying customer, calculated by dividing total acquisition spending by new customers acquired in the same period.
Customer Lifetime Value (CLTV): The predicted total revenue generated from a customer relationship over its entire duration, calculated using average revenue per customer, gross margin, and churn rate.
Friction Scoring: A quantitative methodology for measuring obstacles in user workflows by assigning point values to each required action, decision, or cognitive processing step. Used to identify optimization opportunities.
Information Hierarchy: The structured organization of content elements by importance and relationship, enabling users to quickly locate relevant information and understand conceptual relationships. Poor hierarchy increases cognitive load.
Interaction Cost: The sum of physical and mental effort required to accomplish a task or goal within a product interface. Each click, form field, decision point, or navigation step contributes to total interaction cost.
Mental Model: The internal representation users develop about how a system works, based on prior experience and learned patterns. Products that align with user mental models reduce learning curves and activation friction.
Monthly Recurring Revenue (MRR): The predictable revenue generated from subscriptions in a single month, normalized to account for different billing cycles. Primary growth metric for SaaS businesses.
Onboarding: The structured experience guiding new users from initial signup to successful first outcome, typically including tutorials, walkthroughs, and contextual assistance. Comprehensive onboarding increases trial conversion by 40% according to Harvard Business Review.
Recognition Friction: The dissonance users experience when interface elements, messaging, or workflows don't match their expectations or prior experience patterns. Reduces conversion and increases abandonment.
Retention Curve: A graphical representation of customer retention over time, showing what percentage of a cohort remains active at each time interval. Reveals critical churn periods and long-term retention patterns.
Social Proof: Evidence that other people have successfully used and benefited from a product, including testimonials, reviews, case studies, and usage statistics. Leverages consensus bias in decision-making psychology.
Time-to-Value: The duration between initial product interaction and first meaningful outcome or benefit realization. Reducing time-to-value improves activation rates and trial conversion.
Trial Activation: The point at which a trial user completes their first meaningful action demonstrating engagement with core product functionality. Strong predictor of trial-to-paid conversion.
Usability Debt: The accumulated friction and suboptimal design patterns that reduce product efficiency over time, similar to technical debt in software development. Requires systematic remediation to maintain conversion performance.
Value Demonstration: The process of making product benefits tangible and visible through outcomes, reports, or achievements rather than feature lists. Outcome-focused messaging aligns with user mental models of success.
References
The following authoritative sources and research institutions informed the analysis and recommendations throughout this article:
McKinsey & Company - The Future of SaaS Marketing: Emerging Trends and Insights
Forrester Research - SaaS Marketing: Optimizing Conversion Rates
HubSpot Research - How to Optimize Your SaaS Marketing Funnel: A Step-by-Step Guide
Gartner - SaaS Marketing Metrics: How to Measure and Improve Conversions
Nielsen Norman Group - User Experience Research and Usability Guidelines
Content Marketing Institute - B2B Content Marketing Benchmarks and Trends
Stanford Human-Computer Interaction Group - Cognitive Load and Interface Design Research
Baymard Institute - E-commerce and SaaS Usability Research
Ahrefs - SEO and Content Marketing Performance Research
Edelman - Trust Barometer: Global Survey on Brand Trust
BrightEdge - Organic Search and Digital Marketing Channel Analysis
Econsultancy - Digital Marketing and Customer Experience Research
DMA (Data & Marketing Association) - Email Marketing Benchmarks and Best Practices
AdRoll - Retargeting and Performance Marketing Research
Campaign Monitor - Email Marketing Engagement and Optimization Studies
Marketo - Lead Generation and Marketing Automation Research
Google Marketing Platform - Digital Advertising Performance Benchmarks
Totango - SaaS Metrics Report: Trial Conversion and Retention Analysis
Wyzowl - Video Marketing and Customer Onboarding Research
Harvard Business Review - Business Strategy and Management Research
Appcues - Product Onboarding and User Activation Research
Mixpanel - Product Analytics and User Behavior Studies
Teresa Amabile (Harvard Business School) - The Progress Principle: Motivation Research
Robert Cialdini - Influence: The Psychology of Persuasion
BrightLocal - Local Search and Online Review Research
Journal of Consumer Research - Consumer Behavior and Decision-Making Studies
MarketingSherpa - Marketing Optimization and Conversion Research
SEMrush - SEO and Digital Marketing Intelligence
Mailchimp - Email Marketing Industry Benchmarks
OpenView Partners - SaaS Benchmarks and Growth Research
SaaS Capital - SaaS Financial and Operating Metrics Survey
Recurly - Subscription Billing and Churn Analysis
SaaStr - SaaS Community Growth and Metrics Research
Pacific Crest - Annual SaaS Survey: Industry Performance Benchmarks
Peter Drucker - Management Theory and Business Strategy
Optimizely - A/B Testing and Experimentation Research
Moz - Search Engine Optimization Research and Analysis


