


Last Update:
Table of Contents
No headings found in Blog Content.
Share

Feature Adoption vs. Feature Trial: Adoption is when a feature is integrated into regular workflows, not just used once. True adoption means consistent usage driven by perceived value.
Critical Metrics:
Adoption Rate: The percentage of eligible users engaging with a feature within a defined period.
Activation Rate: Measures whether users complete key actions within the feature, which is essential for long-term engagement.
Engagement Frequency: Indicates how often users return to a feature, showing whether it has become habitual.
Retention Rates: Long-term engagement signals whether a feature delivers sustained value over time.
Discoverability vs. Value Problems: Low adoption can stem from either discoverability issues (users can't find the feature) or value misalignment (users don't perceive enough benefit to justify continued usage). Proper diagnostics are crucial to solve the right problem.
Early Adoption Predictors: Early signals like time-to-first-use and first-week engagement intensity are strong predictors of long-term adoption. Users engaging early are more likely to retain the feature and show higher retention rates.
Optimizing Adoption: Measurement-driven optimization involves tracking user behavior, diagnosing barriers (discoverability or value), and implementing targeted interventions such as contextual triggers or value demonstrations to increase feature usage.
Executive Summary
Measuring feature adoption determines whether your development investments translate into actual user value. When features go unadopted, you're hemorrhaging resources building capabilities that fail to impact retention, expansion, or competitive differentiation.
The challenge lies not in collecting data, but in interpreting signals correctly. Many product teams track vanity metrics that mask fundamental adoption barriers, leading to misguided optimization efforts.
The Core Challenge
Product teams frequently conflate usage visibility with adoption success. A feature might achieve high trial rates yet fail to integrate into user workflows. Conversely, low-frequency features might drive critical value for specific segments despite minimal overall usage.
What This Article Delivers
This guide provides systematic frameworks for:
Identifying which metrics actually predict long-term feature value realization
Diagnosing whether low adoption stems from discoverability gaps versus value misalignment
Establishing early adoption benchmarks that forecast retention impact
Implementing measurement architectures used by leading SaaS companies
According to research from Pendo's comprehensive feature adoption analysis, approximately 80% of product features experience low to no regular usage. However, the top-performing SaaS companies achieve 40-65% adoption rates for strategic features through systematic measurement and optimization in their product design.
1. Feature Adoption Metrics: What Actually Matters
Defining Feature Adoption
Feature adoption represents the integration of a capability into users' regular workflow patterns, not merely initial trial or awareness. True adoption requires sustained engagement driven by perceived value realization.
The distinction matters critically. A user who tries a feature once demonstrates curiosity. A user who integrates that feature into weekly workflows demonstrates adoption.
Feature Adoption vs Feature Trial
Feature Trial = Single-use interaction, typically driven by discovery or experimentation
Feature Adoption = Repeated usage integrated into workflow, driven by value realization
Adoption Threshold = Point at which feature becomes habitual user behavior
Measurement Window = Time period for tracking adoption (7-day, 30-day, 90-day cohorts)
The Fundamental Questions
Effective measurement frameworks answer two critical questions:
Are users interacting with the feature consistently? This reveals workflow integration depth.
Are they deriving sufficient value to maintain repeated engagement? This predicts retention impact and expansion potential.
According to behavioral analytics research from Amplitude, features that achieve repeated usage within the first 7 days demonstrate 3.2x higher 90-day retention rates compared to features with delayed repeat engagement.
Essential Metrics Architecture
1. Adoption Rate
Measures the percentage of eligible users who engage with a feature within a defined observation window.
Formula:
Adoption Rate = (Users who used feature / Total eligible users) × 100
Where:
"Used" = Completed meaningful interaction (not just viewed)
"Eligible" = Users with access who could benefit from the feature
Observation window = Typically 7, 30, or 90 days post-launch
Benchmark Context: Research from Pendo indicates that B2B SaaS products achieve 20-30% adoption rates within the first 30 days for newly launched features. However, this varies significantly by feature complexity and user segment.
High-performing products achieve 40-50% adoption for core workflow features through contextual discovery mechanisms and UX optimization.
2. Activation Rate
Measures successful completion of the feature's intended value action, not merely superficial interaction.
Formula:
Activation Rate = (Users completing key action / Users who tried feature) × 100
Example Key Actions:
Document collaboration tool: Share document with collaborator
Analytics feature: Generate and view custom report
Automation builder: Activate working automation
Statistical Benchmark: Well-designed SaaS features achieve 40-60% activation rates, according to product analytics industry data. Activation rates below 30% typically indicate onboarding friction or unclear value proposition.
The gap between trial and activation reveals critical adoption barriers. Large gaps suggest users understand how to access the feature but not how to derive value from it.
3. Engagement Frequency
Measures how often users return to the feature over time, indicating habit formation strength.
Formula:
Engagement Rate = Total feature uses / Total active users
Frequency Segmentation:
Daily use features: Should achieve 60-80% daily active user engagement
Weekly use features: Should achieve 40-60% weekly engagement
Monthly use features: Should achieve 25-40% monthly engagement
Situational features: Frequency varies by use case occurrence
Features integrated into core workflows should demonstrate 50-75% engagement rates within their expected usage frequency band. Lower rates signal the feature hasn't become habitual behavior.
Teresa Torres, product discovery expert, emphasizes: "Engagement frequency reveals whether features solve real problems or merely satisfy perceived needs. Real problem-solving creates habitual usage patterns."
4. Retention Curves
Tracks what percentage of users continue engaging with a feature over extended periods, revealing long-term value sustainability.
Formula:
Feature Retention Rate = (Users still using feature after N days / Users who initially adopted) × 100
Critical measurement windows:
Day 7: Early value realization
Day 30: Workflow integration
Day 90: Habit formation
Day 180+: Long-term stickiness
Benchmark Data: Products with strong feature adoption maintain 30-50% retention rates at the 90-day mark, according to cohort analysis from leading product analytics platforms.
Retention curves reveal feature staying power. Sharp early drop-off indicates failed value delivery. Gradual decline suggests the feature serves occasional rather than recurring needs.
5. Feature Churn Analysis
Identifies when and why users abandon features after initial adoption, providing diagnostic insight into value delivery failures.
Formula:
Feature Churn Rate = (Users who stopped using feature / Total users who adopted) × 100
Churn Velocity = Average days until feature abandonment
Resurrection Rate = Percentage of churned users who return to feature
Healthy Benchmarks: Feature churn should remain below 20-30% within the first 30 days post-adoption. Higher churn rates indicate value delivery problems or workflow friction.
Real-World Implementation: Intercom
Intercom, a customer messaging platform, implements sophisticated feature adoption tracking across their product suite. When they launched Outbound Campaigns, their measurement architecture included:
Adoption tracking: Percentage of eligible accounts creating their first campaign within 30 days
Activation metrics: Percentage of created campaigns actually sent to customers
Engagement frequency: Average campaigns sent per active user per week
Retention analysis: Cohort retention at 7, 30, and 90 days post-first-campaign
Their data revealed a powerful insight: users who activated Outbound Campaigns demonstrated 2x higher overall platform retention over subsequent quarters. This finding justified significant investment in improving campaign feature discoverability.
Des Traynor, Intercom's co-founder, notes: "We don't just measure if people use features—we measure if features change user behavior in ways that predict retention and expansion."
Implementation Framework
Step 1: Define Success Thresholds
Establish what constitutes meaningful feature adoption for your specific context. A collaboration feature requires different success criteria than a reporting dashboard.
Step 2: Instrument Comprehensive Tracking
Implement analytics using platforms like Mixpanel, Amplitude, or Heap that capture granular interaction data. Track not just clicks but completed actions that represent value realization.
Step 3: Segment by User Context
Analyze adoption patterns across user segments—new versus experienced users, small teams versus enterprises, different industry verticals. Adoption expectations vary significantly by context.
Step 4: Map Adoption Journey Stages
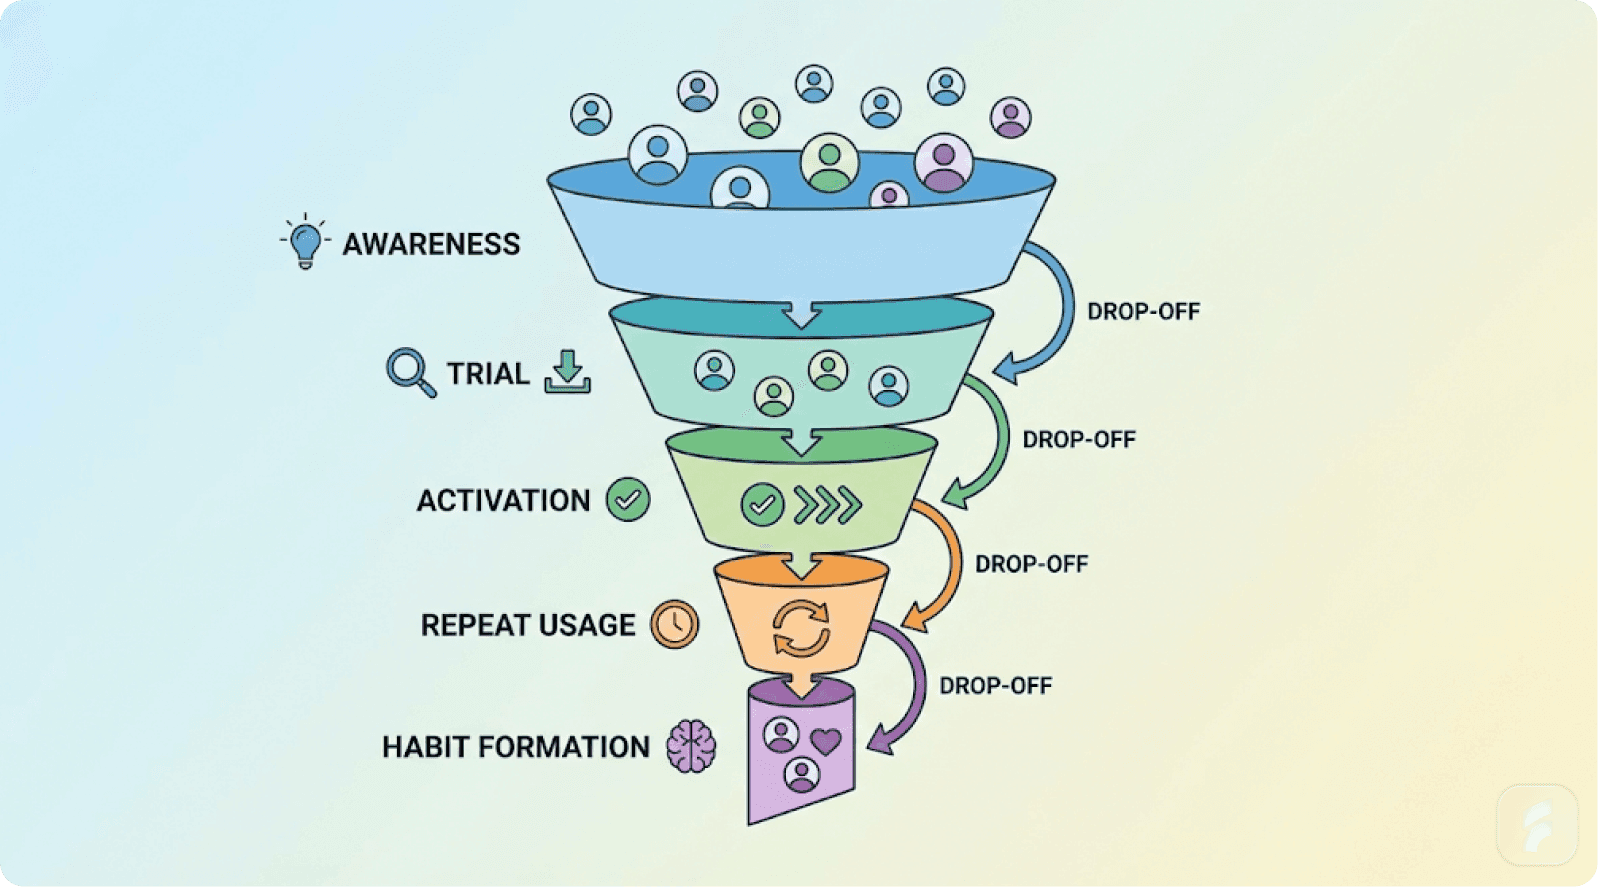
Track progression from awareness → trial → activation → repeated usage → habit formation. Identify where users drop off in this progression for targeted intervention.
Step 5: Correlate with Business Outcomes
Connect feature adoption metrics to retention, expansion, and customer lifetime value. Not all adopted features impact business outcomes equally.
Key Takeaway: Effective feature adoption measurement requires tracking adoption rate, activation rate, engagement frequency, retention curves, and churn patterns across user segments. Leading SaaS companies achieve 40-60% adoption for strategic features through systematic measurement and optimization, with adopted features driving 2-3x higher retention rates.
2. Discoverability vs Value Problems: Diagnostic Framework

The Critical Distinction
Low feature adoption stems from two fundamentally different root causes that require opposite solutions:
Discoverability failures: Users would value the feature but can't find it or don't know it exists
Value misalignment: Users are aware of the feature but don't perceive sufficient value to justify adoption effort
Misdiagnosing the root cause leads to counterproductive interventions. Improving discoverability for a low-value feature wastes resources. Adding more value to an undiscoverable feature helps no one.
According to research from the Baymard Institute, up to 68% of feature adoption failures can be traced to information architecture and discoverability issues rather than inherent value problems.
Discoverability Problem Indicators
Signal 1: Awareness Gap
Users express surprise when shown the feature during support interactions or product tours. They report not knowing the capability existed despite having used the product for months.
Diagnostic Question: "What percentage of eligible users can locate this feature within 30 seconds when prompted?"
If fewer than 60% can find it quickly, discoverability is likely the primary barrier.
Signal 2: Localized Usage Concentration
Usage concentrates among users who discover the feature through specific channels (support tickets, documentation, community discussions) but remains absent among users relying on in-product discovery.
This pattern indicates the feature delivers value when discovered but lacks effective in-product revelation mechanisms.
Signal 3: High Trial, Low Repeat Pattern
Users try the feature once but don't return. This suggests they discovered it incidentally but didn't encounter it again at behaviorally relevant moments.
Statistical Pattern: If trial rate exceeds 40% but 30-day repeat usage falls below 15%, discoverability timing (not awareness) is likely the issue. Users find it once but can't rediscover it when needed.
Signal 4: Support Request Patterns
Users contact support requesting functionality that already exists in the product. This definitively proves discoverability failure.
Track what percentage of support requests could be resolved by directing users to existing features. Rates above 20% indicate systematic discoverability problems.
Real-World Case: Slack's Thread Discovery
Slack initially struggled with message thread adoption despite clear value proposition. Early analysis revealed:
78% of users were aware threads existed
Only 23% used them regularly despite participation in high-volume channels where threads would reduce noise
Primary barrier: threads weren't visible enough during active conversations
Slack's solution focused purely on discoverability:
Contextual surfacing: Thread indicators appeared directly in message flows
Behavioral triggers: Suggested threading when conversations exceeded certain reply counts
Visual affordances: Made thread participation more visually obvious
Results: Thread adoption increased from 23% to 67% among daily active users within 90 days—without changing thread functionality at all. The feature's value remained constant; only discoverability improved through better UX audit practices.
Value Problem Indicators
Signal 1: High Awareness, Low Engagement
Users know the feature exists and can locate it easily, but choose not to use it regularly. This indicates perceived value doesn't justify adoption effort.
Diagnostic Question: "Among users who've tried this feature, what percentage continue using it after 30 days?"
If awareness exceeds 70% but 30-day retention falls below 20%, value delivery is the primary barrier.
Signal 2: Workflow Disruption Resistance
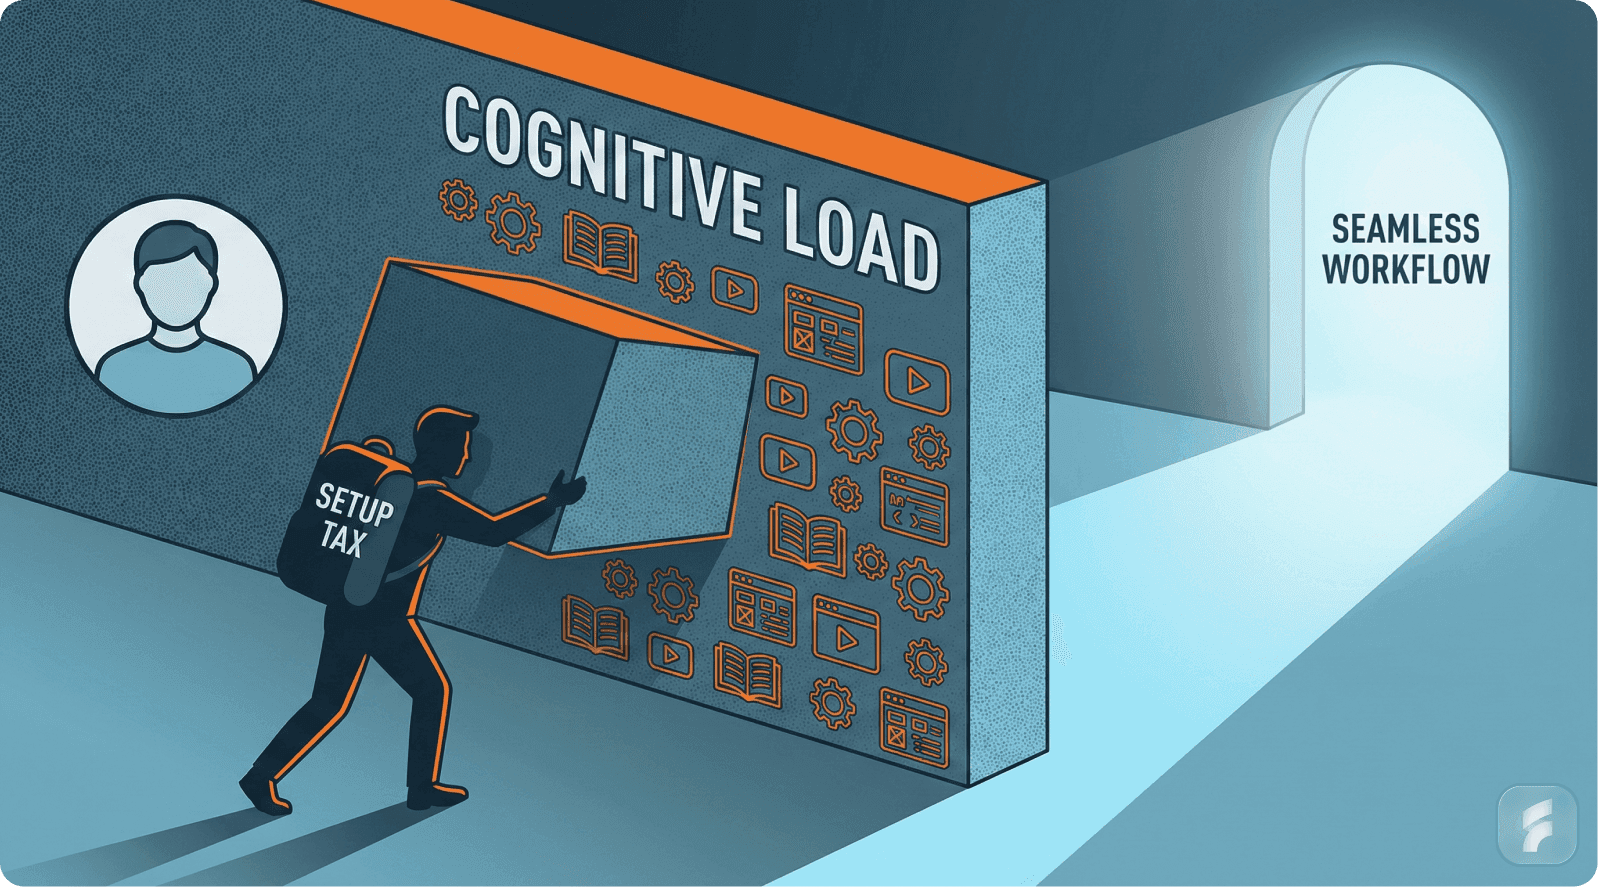
The feature requires users to modify established workflows or learn new concepts without delivering proportional immediate benefits.
According to cognitive load research from the Nielsen Norman Group, users resist workflow changes unless new approaches deliver at least 2x perceived value improvement over existing methods.
Signal 3: Low Activation Despite High Trial
Users access the feature but don't complete meaningful actions. They explore superficially but don't engage deeply enough to experience core value.
Statistical Pattern: If trial rate exceeds 50% but activation rate (completing key actions) remains below 25%, value proposition communication or value delivery speed is insufficient.
Signal 4: Competitive Comparison Weakness
Users report preferring alternative solutions (competitor features, manual workflows, third-party integrations) even after experiencing your feature.
This definitively indicates value gap rather than discoverability gap.
Real-World Case: Google Analytics Advanced Reporting
Google Analytics faced persistent low adoption for advanced reporting features despite high discoverability. Analysis revealed:
82% of users were aware advanced reports existed
89% could locate them within the interface
Only 19% used them regularly despite having complex analytical needs
Primary barrier: reports required too much configuration effort relative to insights gained
Google's solution focused on value delivery acceleration:
Pre-built templates: Eliminated configuration burden for common use cases
Simplified visualizations: Made insights more immediately accessible
Automated insights: Surfaced important patterns without requiring manual report creation
Results: Advanced reporting adoption increased from 19% to 54% among qualified users. The feature became more discoverable through recent usage lists, but the primary driver was reduced time-to-value.
Diagnostic Implementation Framework
Test 1: Awareness Survey
Ask a random sample of users: "Are you aware that [product] can [feature capability]?"
If awareness < 40%: Discoverability problem
If awareness > 70%: Likely value problem
If 40-70%: Mixed factors requiring deeper analysis
Test 2: Prompted Usage Test
Direct users to the feature and ask them to complete a key action. Measure completion rate and time-to-completion.
If completion rate > 70%: Feature is usable once found (discoverability issue)
If completion rate < 40%: Feature is confusing or low-value (value/usability issue)
Test 3: Value Perception Interview
Ask users who tried but abandoned the feature: "What prevented you from continuing to use [feature]?"
Categorize responses:
"Didn't know it existed / couldn't find it again" → Discoverability
"Wasn't worth the effort / didn't solve my problem" → Value
"Too complicated / didn't understand how" → Usability (related to value delivery)
Test 4: Behavioral Cohort Analysis
Compare feature adoption between:
Users who completed onboarding tutorials mentioning the feature
Users who didn't complete tutorials
If the tutorial cohort shows 2x+ higher adoption, discoverability is the primary barrier. If adoption remains similar, value delivery is the issue.
Steve Krug, usability expert, advises: "Users don't read documentation or explore menus. They scan, grab, and go. If they can't find what they need in 30 seconds, they'll use what they already know—even if it's inferior."
Key Takeaway: Diagnosing adoption barriers requires distinguishing between discoverability failures (users can't find the feature when needed) and value misalignment (users don't perceive sufficient benefit). Leading companies use awareness surveys, prompted usage tests, and behavioral cohort analysis to identify root causes, with 68% of adoption failures stemming from discoverability rather than inherent value gaps.
3. Early Adoption Metrics: Predictive Indicators
Why Early Signals Matter
Early adoption patterns predict long-term feature success with remarkable accuracy. Users who integrate features into workflows within the first 7-14 days demonstrate fundamentally different retention trajectories than those who delay adoption.
According to research from Reforge's product analytics database, users who engage with new features within their first week show 3.7x higher 6-month retention compared to users who delay feature discovery beyond 30 days.
This creates strategic urgency around early adoption measurement and optimization.
Critical Early Adoption Metrics
Time-to-First-Use
Measures the duration between user account creation (or feature launch for existing users) and initial feature interaction.
Formula:
Time-to-First-Use = Days from eligibility to first feature interaction
Segmentation:
0-1 days: Immediate discovery (excellent)
2-7 days: Early discovery (good)
8-30 days: Delayed discovery (concerning)
31+ days: Failed early discovery (critical issue)
Benchmark Data: High-performing SaaS products achieve median time-to-first-use of 2-5 days for strategic features. Products relying on menu-based discovery see median times of 14-21 days.
Shorter time-to-first-use correlates strongly with higher lifetime feature adoption rates. Each additional day of delay reduces the probability of eventual adoption by approximately 3-5%.
First-Week Engagement Intensity
Measures how many times users interact with a feature during their first seven days of exposure.
Formula:
First-Week Engagement = Number of feature interactions in days 0-7
Segmentation:
5+ interactions: Power user trajectory (excellent retention predictor)
2-4 interactions: Moderate engagement (good)
1 interaction: Trial only (high abandonment risk)
0 interactions: Non-discovery (adoption failure)
Users with 3+ first-week interactions demonstrate 2.4x higher 90-day retention rates according to analysis from Mixpanel's product engagement research.
Activation Completion Timeframe
Measures how quickly users complete the feature's core value action after first interaction.
Formula:
Activation Speed = Time from first interaction to completing key action
Fast activation: < 5 minutes (immediate value realization)
Moderate activation: 5-30 minutes (guided value realization)
Slow activation: 30+ minutes (friction-laden value realization)
Abandoned activation: Never completed (value delivery failure)
Statistical Impact: Users who activate within 5 minutes show 67% higher repeat usage rates compared to users requiring 30+ minutes to activate, according to behavioral analytics research.
Casey Winters, former Chief Product Officer at Eventbrite, notes: "The faster users experience core value, the more likely they are to return. Every friction point between trial and value realization is a compounding adoption tax."
Early Success Indicators
Measures whether users achieve successful outcomes during initial feature usage attempts.
Success rate varies by feature type:
Collaborative features: Successfully involving another user
Creation features: Completing and saving/publishing created content
Analytical features: Generating insights that inform decisions
Automation features: Activating automation that performs intended action
Benchmark: Users experiencing successful outcomes during first use demonstrate 3.1x higher adoption rates than users whose initial attempts fail or produce ambiguous results.
Real-World Implementation: HubSpot
HubSpot implements sophisticated early adoption tracking for their marketing automation suite. When launching workflow automation features, they measured:
Time-to-first-workflow-creation: Median time from feature access to creating first automation
First-week workflow count: Number of workflows created in days 0-7
Activation rate: Percentage of created workflows actually activated (not just saved as drafts)
Early success rate: Percentage of activated workflows that successfully triggered within 48 hours
Their analysis revealed critical insights:
Users creating their first workflow within 3 days showed 4.2x higher 6-month retention
Users creating 2+ workflows in week one showed 58% higher expansion revenue
Early workflow success (successful triggering) correlated with 73% higher feature depth adoption
Based on these findings, HubSpot prioritized reducing time-to-first-workflow through:
Template library: Pre-built workflows for common use cases
Simplified workflow builder: Reduced steps required for basic automations
Contextual suggestions: Triggered workflow recommendations based on user behavior
Results: Median time-to-first-workflow decreased from 12 days to 4 days, with corresponding 67% increase in overall automation feature adoption.
Predictive Model Construction
Leading product teams build predictive models connecting early adoption metrics to long-term outcomes:
Step 1: Define Long-Term Success
Identify the ultimate outcome you're predicting (90-day retention, 6-month expansion, annual LTV, etc.)
Step 2: Track Early Behavior Cohorts
Segment users by early adoption patterns:
Days to first use
First-week interaction frequency
Activation completion
Early success achievement
Step 3: Measure Correlation Strength
Calculate which early metrics most strongly predict long-term success. Use correlation analysis or logistic regression to identify the strongest predictors.
Step 4: Establish Early Warning Thresholds
Determine the early metric thresholds that separate high-retention from high-churn cohorts.
Example thresholds:
Users reaching first use within 5 days: 68% 90-day retention
Users reaching first use after 20 days: 23% 90-day retention
Step 5: Implement Intervention Triggers
Create automated interventions when users fail to hit critical early thresholds:
Email prompts at day 3 for non-users
In-app contextual suggestions for single-use trials
Customer success outreach for high-value accounts showing delayed adoption
Measuring Early Cohort Progression
Track how users progress through adoption stages within their first 30 days:
Days 0-3: Awareness and first trial
Target: 40% of eligible users try the feature
Metric: Trial rate
Days 4-7: Activation and initial value
Target: 60% of trial users complete key action
Metric: Activation rate
Days 8-14: Repeat usage and habit formation
Target: 45% of activated users return for second use
Metric: Repeat usage rate
Days 15-30: Workflow integration
Target: 35% of repeat users integrate into regular workflow
Metric: Sustained engagement rate
Nir Eyal, author of Hooked, explains: "The first 30 days determine whether a feature becomes habitual or gets abandoned. Products that design deliberately for this critical window see 3-5x higher long-term adoption rates."
Key Takeaway: Early adoption metrics—particularly time-to-first-use, first-week engagement intensity, and activation completion speed—predict long-term feature success with high accuracy. Users engaging within the first week show 3-4x higher retention rates, making early adoption optimization critical for feature success.
4. Improving Feature Adoption Through Measurement-Driven Optimization
The Measurement-to-Action Framework
Collecting metrics without systematic optimization produces analytics theater—activity that feels productive but drives no outcomes. Leading product teams implement closed-loop systems connecting measurement to intervention.
Progression Funnel Analysis
Map users through the complete adoption journey and identify high-drop-off transition points:
Stage 1: Awareness (Eligible → Aware)
Metric: Percentage of eligible users who know feature exists
Intervention: In-product announcements, contextual prompts, onboarding integration
Stage 2: Trial (Aware → First Use)
Metric: Percentage of aware users who try the feature
Intervention: Reduce access friction, add contextual triggers, demonstrate value upfront
Stage 3: Activation (First Use → Completed Key Action)
Metric: Percentage of trial users completing meaningful action
Intervention: Simplify workflows, add inline guidance, reduce setup requirements
Stage 4: Repeat Usage (Activated → Second Use)
Metric: Percentage returning within 7 days of first use
Intervention: Trigger prompts, email reminders, workflow integration
Stage 5: Habit Formation (Repeat → Regular Usage)
Metric: Percentage maintaining engagement beyond 30 days
Intervention: Value reinforcement, progressive capability revelation, social elements
According to research from the Product-Led Growth Collective, the highest-impact optimization point varies by product:
Consumer products: Stage 2 (awareness to trial) typically shows highest drop-off
SMB SaaS: Stage 3 (trial to activation) most commonly needs optimization
Enterprise products: Stage 5 (repeat to habit) often determines long-term success
Real-World Implementation: Canva
Canva implements systematic progression tracking for design features. Their measurement architecture revealed:
Stage 1-2 (Awareness to Trial): 78% conversion (strong performance)
Stage 2-3 (Trial to Activation): 82% conversion (strong performance)
Stage 3-4 (Activation to Repeat): 34% conversion (critical weakness identified)
Stage 4-5 (Repeat to Habit): 67% conversion (moderate performance)
This analysis pinpointed Stage 3-4 as the primary optimization opportunity. Users successfully created initial designs but didn't return for second creations.
Canva's interventions focused on this specific transition:
Email triggers: Personalized suggestions sent 24-48 hours after first design completion
Contextual prompts: In-product suggestions for next design projects based on first design type
Template suggestions: Curated template recommendations matching user's demonstrated interests
Social hooks: Sharing prompts that created natural reasons to return
Results: Stage 3-4 conversion improved from 34% to 61% over 8 weeks, with overall feature adoption increasing 43%. Learn more about effective product design strategies.
Melanie Perkins, Canva's co-founder, emphasizes: "We don't just measure where users drop off—we systematically test interventions at the highest-impact transition points until we find what works."
Cohort-Based Optimization
Compare adoption patterns across user segments to identify which groups need targeted interventions:
High-performing cohorts: Users exceeding adoption benchmarks Moderate-performing cohorts: Users meeting baseline adoption but not excelling Low-performing cohorts: Users significantly underperforming on adoption metrics
Analyze what differentiates high performers from low performers:
Different onboarding paths?
Different use case contexts?
Different feature discovery methods?
Different organizational characteristics?
Implement successful patterns from high-performing cohorts for low-performing segments.
A/B Testing Framework
Test specific interventions against control groups to measure incremental adoption improvement:
Discoverability tests:
Contextual prompts vs menu placement
Onboarding integration vs post-signup introduction
Behavioral triggers vs time-based reminders
Value delivery tests:
Smart defaults vs manual configuration
Templates vs blank canvas
Progressive complexity vs full capability exposure
Activation tests:
Inline guidance vs separate tutorials
Wizard-based flows vs freeform interaction
Example content vs empty states
Measure impact on:
Trial rate increase
Activation rate improvement
Time-to-second-use reduction
30-day retention lift
According to research from Optimizely's experimentation platform, feature adoption A/B tests typically show larger impact than traditional conversion optimization tests—15-40% improvements are common versus 2-8% for checkout optimization.
Behavioral Trigger Optimization
Test different trigger mechanisms for surfacing features at relevant moments:
Event-based triggers: After specific user actions Pattern-based triggers: When behavioral patterns suggest feature relevance Time-based triggers: At optimal intervals for specific user segments Context-based triggers: Within specific workflows or product areas
Track for each trigger type:
Impression rate (how often trigger fires)
Dismissal rate (how often users ignore)
Conversion rate (how often users engage)
Subsequent adoption rate (how often triggered users adopt long-term)
Julie Zhuo, former VP Product Design at Facebook, advises: "The best feature introductions don't feel like interruptions—they feel like the product reading your mind and offering exactly what you need at the perfect moment."
Value Demonstration Optimization
Test different methods of communicating feature value:
Abstract descriptions: Text explaining what the feature does Concrete examples: Specific use case demonstrations Visual previews: Screenshots or videos showing feature in action Interactive demos: Hands-on trial before full commitment Outcome-focused messaging: Benefits rather than capabilities
Measure which approaches drive highest:
Awareness-to-trial conversion
Trial-to-activation conversion
Early satisfaction scores
Repeat usage rates
Research from the Behavioral Economics Lab at Duke University shows that concrete, outcome-focused demonstrations increase feature adoption by 32-47% compared to abstract capability descriptions.
Key Takeaway: Measurement-driven optimization requires systematic progression funnel analysis, cohort-based comparison, A/B testing of interventions, behavioral trigger refinement, and value demonstration improvement. Leading companies identify the single highest-impact transition point and focus optimization efforts there, typically achieving 40-60% adoption improvements within 8-12 weeks.
Conclusion: Building Measurement Systems That Drive Adoption
Measuring feature adoption properly requires moving beyond surface-level usage metrics to comprehensive frameworks that:
Distinguish between awareness, trial, activation, repeat usage, and habit formation — each stage requires different measurement approaches and optimization strategies.
Diagnose root causes — separating discoverability failures from value misalignment prevents wasted optimization effort on the wrong problems.
Predict long-term outcomes — early adoption metrics like time-to-first-use and first-week engagement intensity forecast retention with high accuracy, enabling proactive intervention.
Drive systematic optimization — measurement without action produces analytics theater; effective teams implement closed-loop systems connecting insights to interventions.
Implementation Priority Framework
Immediate (Week 1): Establish baseline adoption metrics for your top 5 strategic features. Track adoption rate, activation rate, and 30-day retention. Identify which features underperform expectations.
Short-term (Weeks 2-4): Implement diagnostic framework for lowest-performing features. Conduct awareness surveys, prompted usage tests, and behavioral cohort analysis to determine whether discoverability or value drives low adoption.
Medium-term (Months 2-3): Build early adoption tracking systems measuring time-to-first-use, first-week engagement, and activation completion speed. Establish predictive models connecting early metrics to long-term outcomes.
Ongoing: Implement progression funnel analysis identifying highest-impact drop-off points. Run systematic A/B tests on interventions targeting those specific transitions. Iterate based on measured impact.
The Competitive Advantage
Products that implement sophisticated feature adoption measurement gain compounding advantages:
Resource optimization: Development effort focuses on features that drive retention and expansion
Faster iteration: Early metrics enable course correction within weeks rather than quarters
Predictive capability: Leading indicators forecast churn risk before it manifests in revenue
Strategic clarity: Usage data reveals which capabilities drive differentiation versus which create complexity without value
According to analysis from ChartMogul's SaaS metrics database, companies in the top quartile for feature adoption measurement demonstrate 37% higher customer lifetime value and 28% lower logo churn compared to companies with basic usage tracking.
The measurement systems themselves become competitive moats—enabling product velocity and customer insight that competitors can't replicate quickly.
Shreyas Doshi, former product lead at Stripe, Twitter, and Google, observes: "Most companies track feature usage. Elite companies track feature adoption. The difference is understanding not just what users do, but why they do it—and using that understanding to systematically drive the behaviors that predict retention."
Start with your most strategic feature. Implement comprehensive adoption measurement. Diagnose barriers systematically. Optimize the highest-impact friction points. Then scale the approach across your product portfolio.
For more insights on building products users love, explore our blog or learn about our SaaS services.
Glossary
Activation Rate: The percentage of users who complete a feature's intended value action (key outcome) after initial trial. Measures whether users can successfully derive value from the feature, not just access it. Activation represents crossing the threshold from exploration to value realization.
Adoption Rate: The percentage of eligible users who engage with a feature within a defined observation window (typically 7, 30, or 90 days). Differs from usage rate by focusing on integration into regular workflows rather than one-time trial.
Behavioral Trigger: A mechanism that surfaces features contextually based on user actions, patterns, or workflow states rather than relying on menu navigation or static placement. Effective triggers increase feature discovery by 40-65% compared to menu-based approaches.
Cohort Analysis: Segmenting users into groups based on shared characteristics (signup date, user type, adoption patterns) and comparing metrics across cohorts to identify patterns. Essential for understanding which user segments adopt features and why.
Discoverability Problem: A feature adoption barrier where users would find value in a capability but can't locate it or aren't aware it exists. Distinguished from value problems where users know about features but choose not to adopt them.
Early Adoption Metrics: Measurements taken within the first 7-30 days of user exposure to a feature that predict long-term adoption success. Include time-to-first-use, first-week engagement intensity, and activation completion speed.
Engagement Frequency: How often users interact with a feature over time, measured as total uses divided by active users. Indicates whether features have become habitual behaviors versus occasional trials.
Feature Churn: When users who previously adopted a feature stop using it, indicating failed sustained value delivery. Measured as percentage of adopters who abandon the feature within defined timeframes.
Feature Depth: The number of distinct features or capabilities a user regularly engages with. Higher feature depth correlates strongly with retention—users adopting 5+ features show 2.8x higher lifetime value.
Progression Funnel: The sequential stages users move through from awareness to habitual usage: Aware → Trial → Activation → Repeat → Habit. Analyzing drop-off rates between stages identifies highest-impact optimization points.
Retention Curve: A graph showing what percentage of users continue using a feature over time (typically measured at day 7, 30, 60, 90, 180). Reveals whether features deliver sustained value versus one-time appeal.
Time-to-First-Use: The duration between when a user becomes eligible to use a feature (account creation or feature launch) and their first interaction with it. Shorter times predict higher long-term adoption rates.
Time-to-Second-Use: The duration between a user's first and second interaction with a feature. Critical metric because users not reaching second use within 7 days show 85% abandonment probability.
Value Misalignment: A feature adoption barrier where users are aware of a capability but don't perceive sufficient benefit to justify the effort required to adopt it. Requires different interventions than discoverability problems.
Workflow Integration: The degree to which a feature becomes part of users' regular task completion patterns rather than remaining an optional or exploratory capability. True adoption requires workflow integration, not just occasional usage.
Referenced Authorities
Throughout this analysis, research and frameworks from the following authoritative sources informed the measurement approaches and benchmarks:
Product Analytics Platforms
Pendo — Feature adoption research and industry benchmarking across SaaS products
Amplitude — Behavioral analytics and user engagement measurement frameworks
Mixpanel — Product engagement research and retention correlation studies
Heap — Automated event tracking and user journey analysis
Research Institutions
Nielsen Norman Group — Usability research and user behavior patterns
Baymard Institute — Information architecture and feature discoverability studies
MIT Behavioral Economics Lab — Decision-making and adoption psychology
Duke University Behavioral Economics Lab — Value perception and demonstration effectiveness
Stanford Human-Computer Interaction Group — Interface design and interaction patterns
SaaS Metrics & Research Organizations
ChartMogul — SaaS metrics research and lifetime value correlation analysis
Reforge — Product-led growth frameworks and retention research
Product-Led Growth Collective — Adoption measurement and optimization strategies
Optimizely — Experimentation frameworks and A/B testing impact analysis
Industry Experts & Practitioners
Teresa Torres — Product discovery and continuous research methodologies
Casey Winters — Growth strategy and feature adoption optimization
Nir Eyal — Behavioral design and habit formation frameworks
Julie Zhuo — Product design and user experience principles
Shreyas Doshi — Product strategy and feature prioritization
Steve Krug — Usability and user-centered design principles


