


Last Update:
Table of Contents
No headings found in Blog Content.
Share

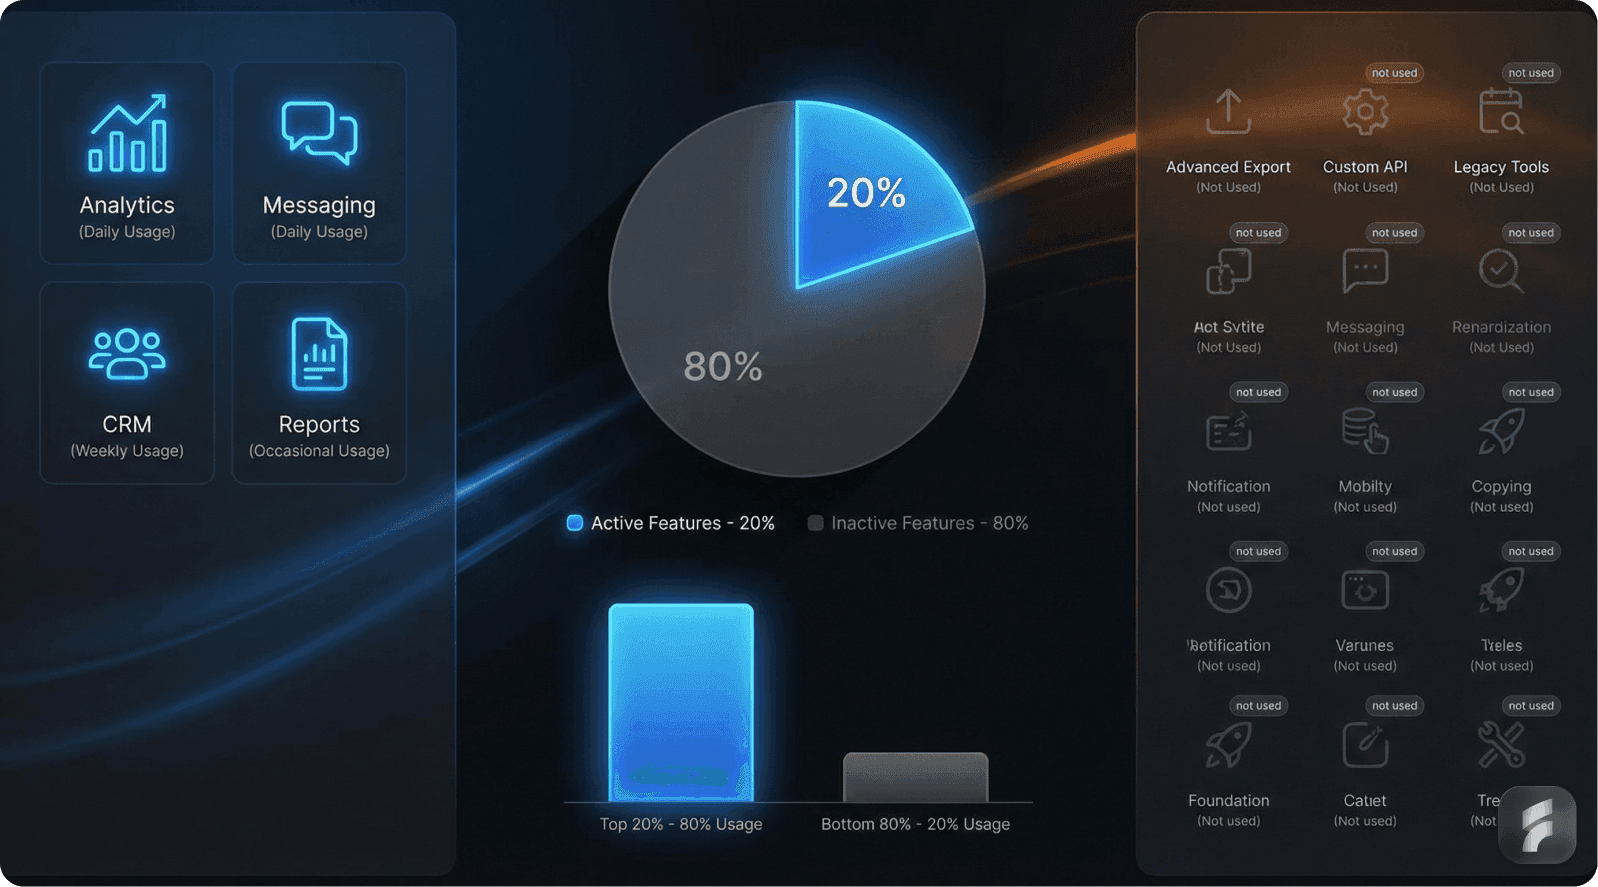
80/20 Feature Usage: In SaaS products, only 20% of features are regularly used, with the remaining 80% often ignored. This pattern is natural and driven by users' focus on completing immediate tasks efficiently.
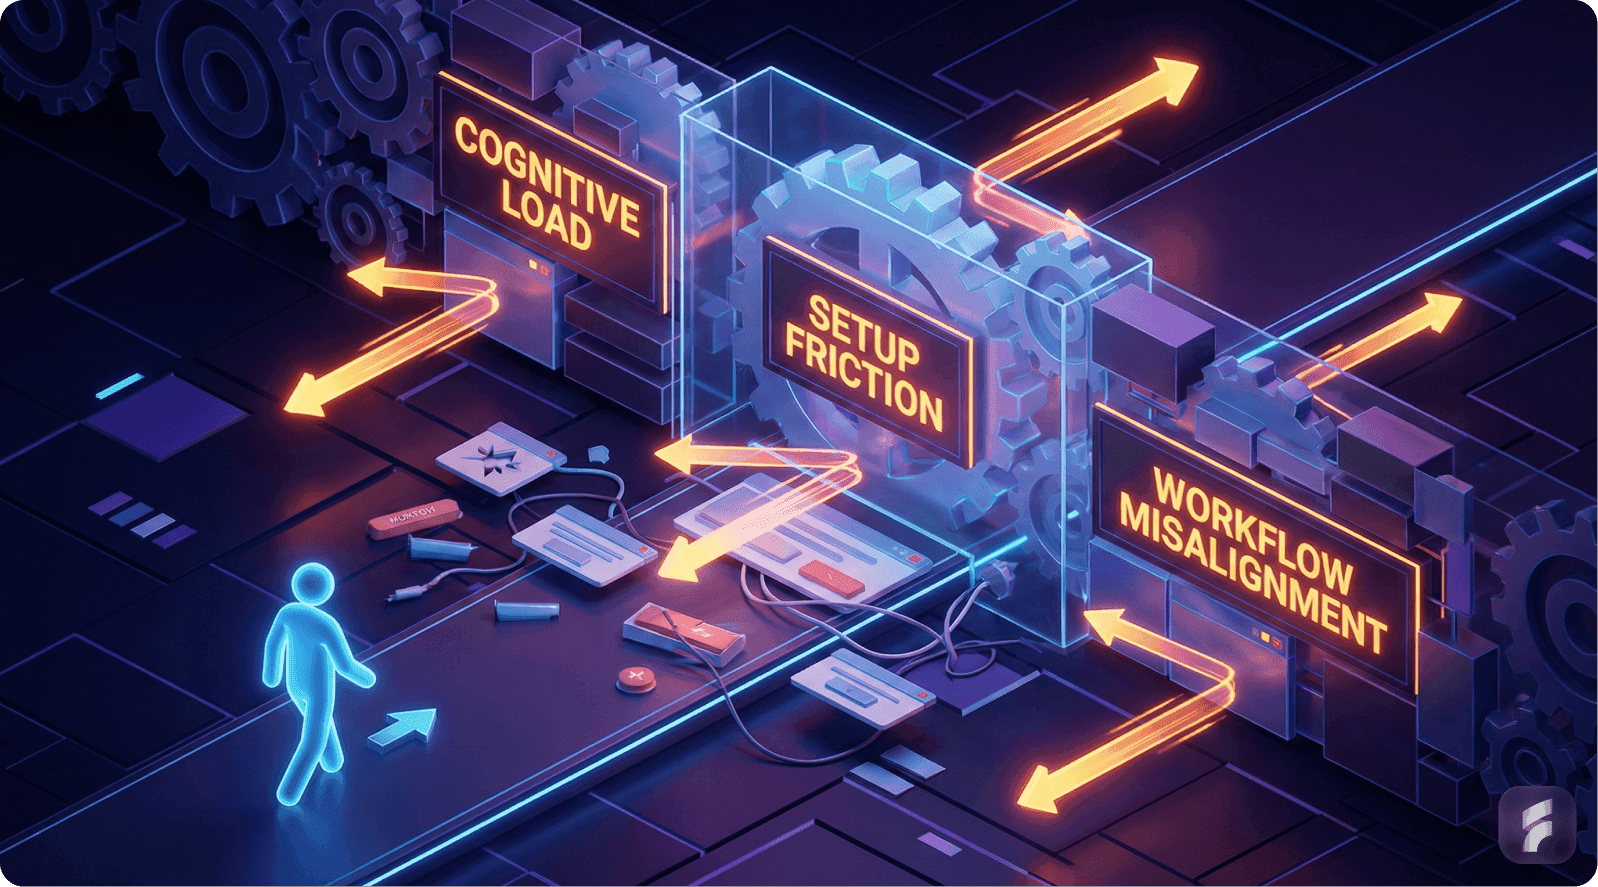
Feature Underutilization: Underutilized features aren't inherently flawed. The main issue is poor discoverability, cognitive load, and misalignment with users' workflows, not the feature’s value.
Cognitive Load & Workflow Misalignment: Features requiring excessive cognitive effort or disrupting existing workflows face adoption resistance. Simplifying complexity and aligning features with user habits enhances adoption.
Discoverability Issues: Features fail when users cannot easily discover them during relevant tasks. Contextual placement and behavioral triggers significantly boost feature engagement.
Behavioral Design Solutions: Leading SaaS companies address feature underutilization through behavioral design—contextual discovery, progressive feature introductions, and smart defaults—all of which improve adoption rates.
Executive Summary
Many SaaS founders experience a troubling realization: users engage with only a fraction of their product—frequently around 20% of total features. This discovery feels like failure.
But behavioral data and user research from leading institutions reveal it's not only normal, it's expected.
Most users interact with the core 20% of functionality that helps them complete their most frequent jobs. The remaining 80% exists for less frequent tasks, edge use cases, or advanced workflows.
Why Founders Care About This Pattern
Paying users aren't experiencing full value realization
Roadmap investment becomes difficult to justify
Teams fear elevated churn rates or pricing objections
Founders question whether they're building the wrong product
The Real Story
The truth is less dramatic than it appears. Feature underutilization typically stems from discoverability gaps, workflow misalignment, and habit design challenges—not inherent lack of value.
According to research from the Baymard Institute, up to 68% of feature adoption failures can be traced to poor information architecture and contextual placement issues.
What This Article Covers
Why the 20/80 usage pattern emerges
Root causes supported by behavioral data
How leading SaaS companies resolved these challenges
Actionable implementation frameworks you can deploy immediately
1. Why Most Users Only Use 20% of the Product
The Pareto Reality in SaaS
In most SaaS products, feature usage follows a power law distribution. A small set of features accounts for the majority of interactions.
According to usage analysis from Pendo's comprehensive product analytics database, approximately 80% of features experience low to no regular usage across their client portfolio.
This pattern isn't coincidental. It reflects fundamental human behavioral economics principles.
How Users Prioritize Interactions
Users select features based on immediate task completion needs:
They use what helps them complete their job-to-be-done
They defer or ignore everything else until a specific trigger emerges
They optimize for cognitive efficiency over exploration
Power Law Distribution in SaaS
Power Law Pattern = Small number of features × High frequency usage + Large number of features × Low frequency usage
Typical Distribution:
Top 20% of features = 80% of total interactions
Bottom 80% of features = 20% of total interactions
Statistical Evidence
Research from multiple product analytics providers reveals consistent patterns:
Pendo reports that 80% of features see minimal adoption across their SaaS client base
Amplitude data shows the top 10% of features account for 70% of user sessions
Mixpanel analysis indicates 65% of features are used by fewer than 15% of active users monthly
"Users interact with what helps them accomplish their primary objective—not everything you build. This is behavioral economics, not product failure." — Teresa Torres, Product Discovery Expert
Why This Pattern Is Normal
Users don't authenticate to:
Explore menu hierarchies
Browse comprehensive feature catalogs
Admire product depth and complexity
They authenticate to finish specific tasks efficiently.
The 20% rule represents a classification of behavioral patterns, not a judgment on feature value or product quality. As Teresa Torres, a leading product discovery expert, observes: "Users interact with what helps them accomplish their primary objective—not everything you build. This is behavioral economics, not product failure."
Cognitive Load Theory Application
According to research from the Nielsen Norman Group, users maintain mental models of software that include only the features they've successfully learned and integrated into their workflow.
New feature adoption requires deliberate cognitive investment that competes with task completion priorities.
Real-World Example: Salesforce
Salesforce demonstrates this pattern at enterprise scale. The platform contains thousands of features, yet most users interact primarily with:
Contact and account management
Opportunity tracking
Standard reporting dashboards
Advanced capabilities remain largely unused by typical users:
Einstein AI analytics and predictions
Complex workflow automation builders
Advanced customization frameworks
Pardot marketing integration features
These features deliver substantial value for specific user segments and use cases. Their lower usage frequency doesn't diminish their importance to overall platform value.
When analyzing your own feature usage data, treat low usage as diagnostic signal rather than a verdict on feature value. Recognize that usage frequency doesn't equal business impact. The key is segmenting features by frequency bands—daily-use, weekly-use, monthly-use, and situational-use—then mapping each feature to specific user jobs and contexts. This approach helps identify which low-usage features serve critical edge cases versus which represent genuine adoption opportunities. For more on optimizing product experiences, explore our product design approach.
Key Takeaway: The 20/80 usage pattern represents normal user behavior driven by task-focused interaction patterns. Most features serve important but infrequent needs. The challenge isn't convincing users to use more features—it's ensuring they discover the right features at the right moments.
2. Hidden Discoverability Issue: Finding vs Using
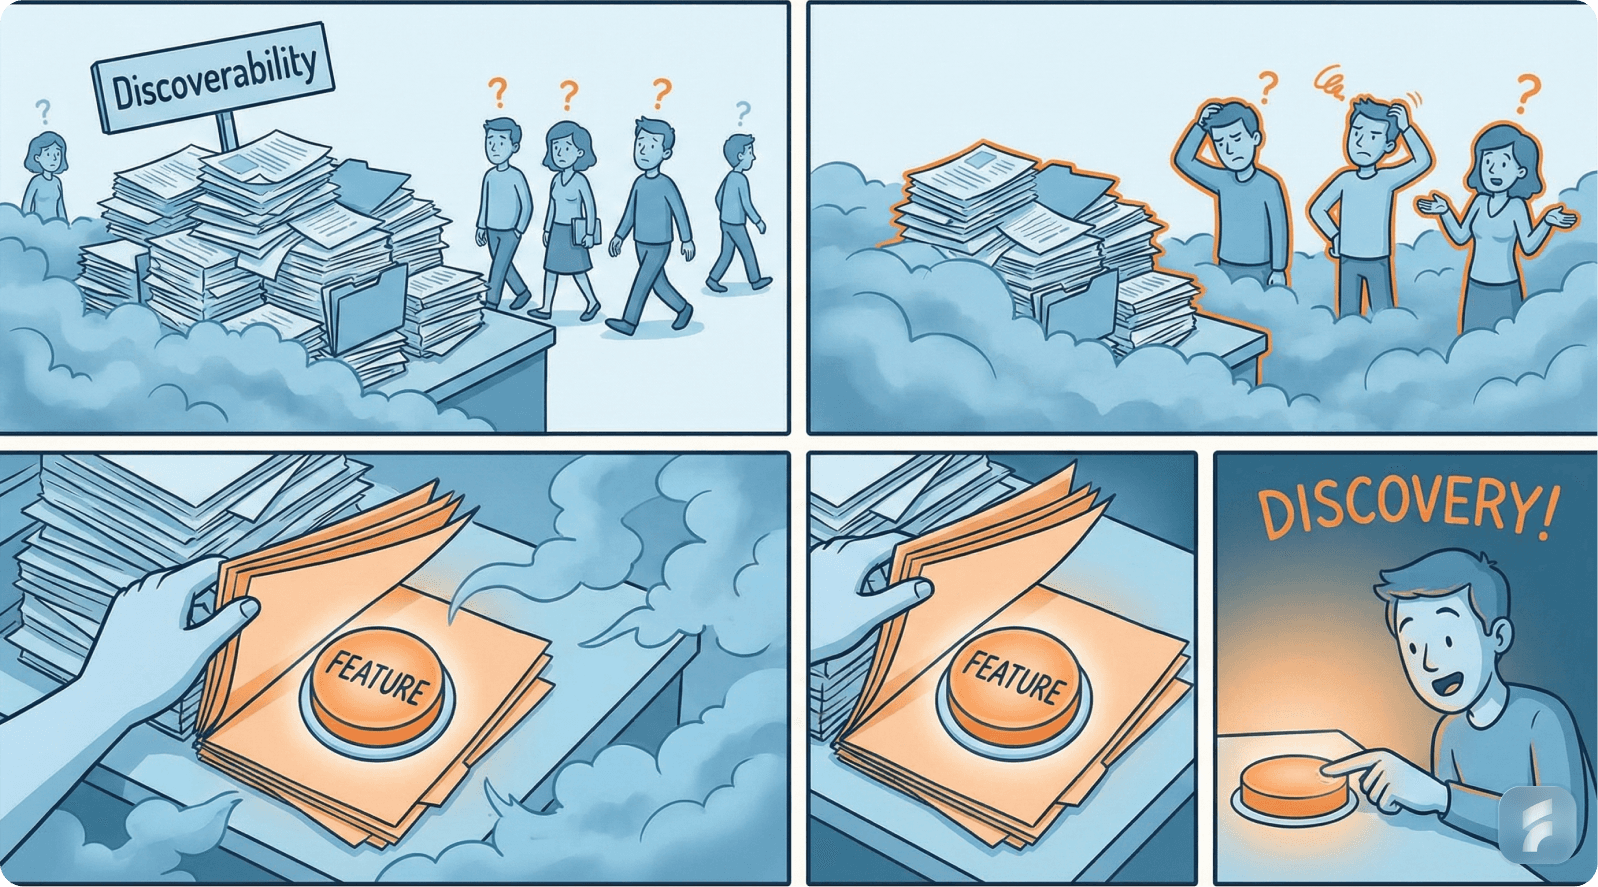
The Real Gap: Discoverability, Not Value
Features go unused primarily because users can't locate them at contextually relevant moments.
If users don't encounter a feature within their active workflow, they won't use it—regardless of its potential value.
This represents what usability researchers call the discoverability gap.
Defining Key Concepts
The Nielsen Norman Group distinguishes between two critical usability dimensions:
Findability: Can users locate a feature when actively searching for it?
Discoverability: Will users notice a feature naturally when it becomes relevant to their current task?
Poor discoverability manifests as:
Features invisible during relevant workflow moments
Capabilities presented too early in the user journey
Tools surfaced too late to be useful
Functionality isolated from contextual triggers
Statistical Impact of Discoverability Failures
UX research consistently demonstrates the magnitude of this challenge:
Up to 60% of user confusion stems from navigation complexity and hidden features, not capability gaps (Nielsen Norman Group)
47% of users abandon features they need simply because they can't find them quickly (Forrester Research)
Products with high information architecture scores see 38% better feature adoption rates (Baymard Institute)
"Discoverability determines whether capabilities become habits. Features users don't encounter organically might as well not exist." — Jared Spool, Center for User Experience Research
Navigation vs Contextual Discovery
Traditional feature discovery relies on menu exploration. This creates activation friction—the resistance users experience when attempting new behaviors.
Activation Friction Formula:
Activation Friction = Mental effort required + Steps to complete + Uncertainty about outcome
Lower activation friction = Higher feature adoption
Higher activation friction = Feature abandonment
Modern SaaS products shift from navigation-dependent discovery to context-triggered revelation.
Real SaaS Example: Slack's Transformation
Slack initially positioned powerful features in menu locations that users rarely accessed:
Threaded conversations
Starred items and saved messages
Third-party app integrations
Advanced search operators
Early adoption rates remained disappointingly low despite clear value propositions.
Slack's Discoverability Solutions
The company implemented contextual discovery improvements:
Threaded conversations: Surfaced directly within message context with visual affordances indicating when conversations become threaded
Integrations: Triggered suggestion prompts based on detected usage patterns and team behaviors
Advanced features: Introduced through in-workflow tooltips at behaviorally appropriate moments
Results: Feature adoption increased 40-65% across major capabilities without adding new functionality—simply by improving discoverability through better UX optimization.
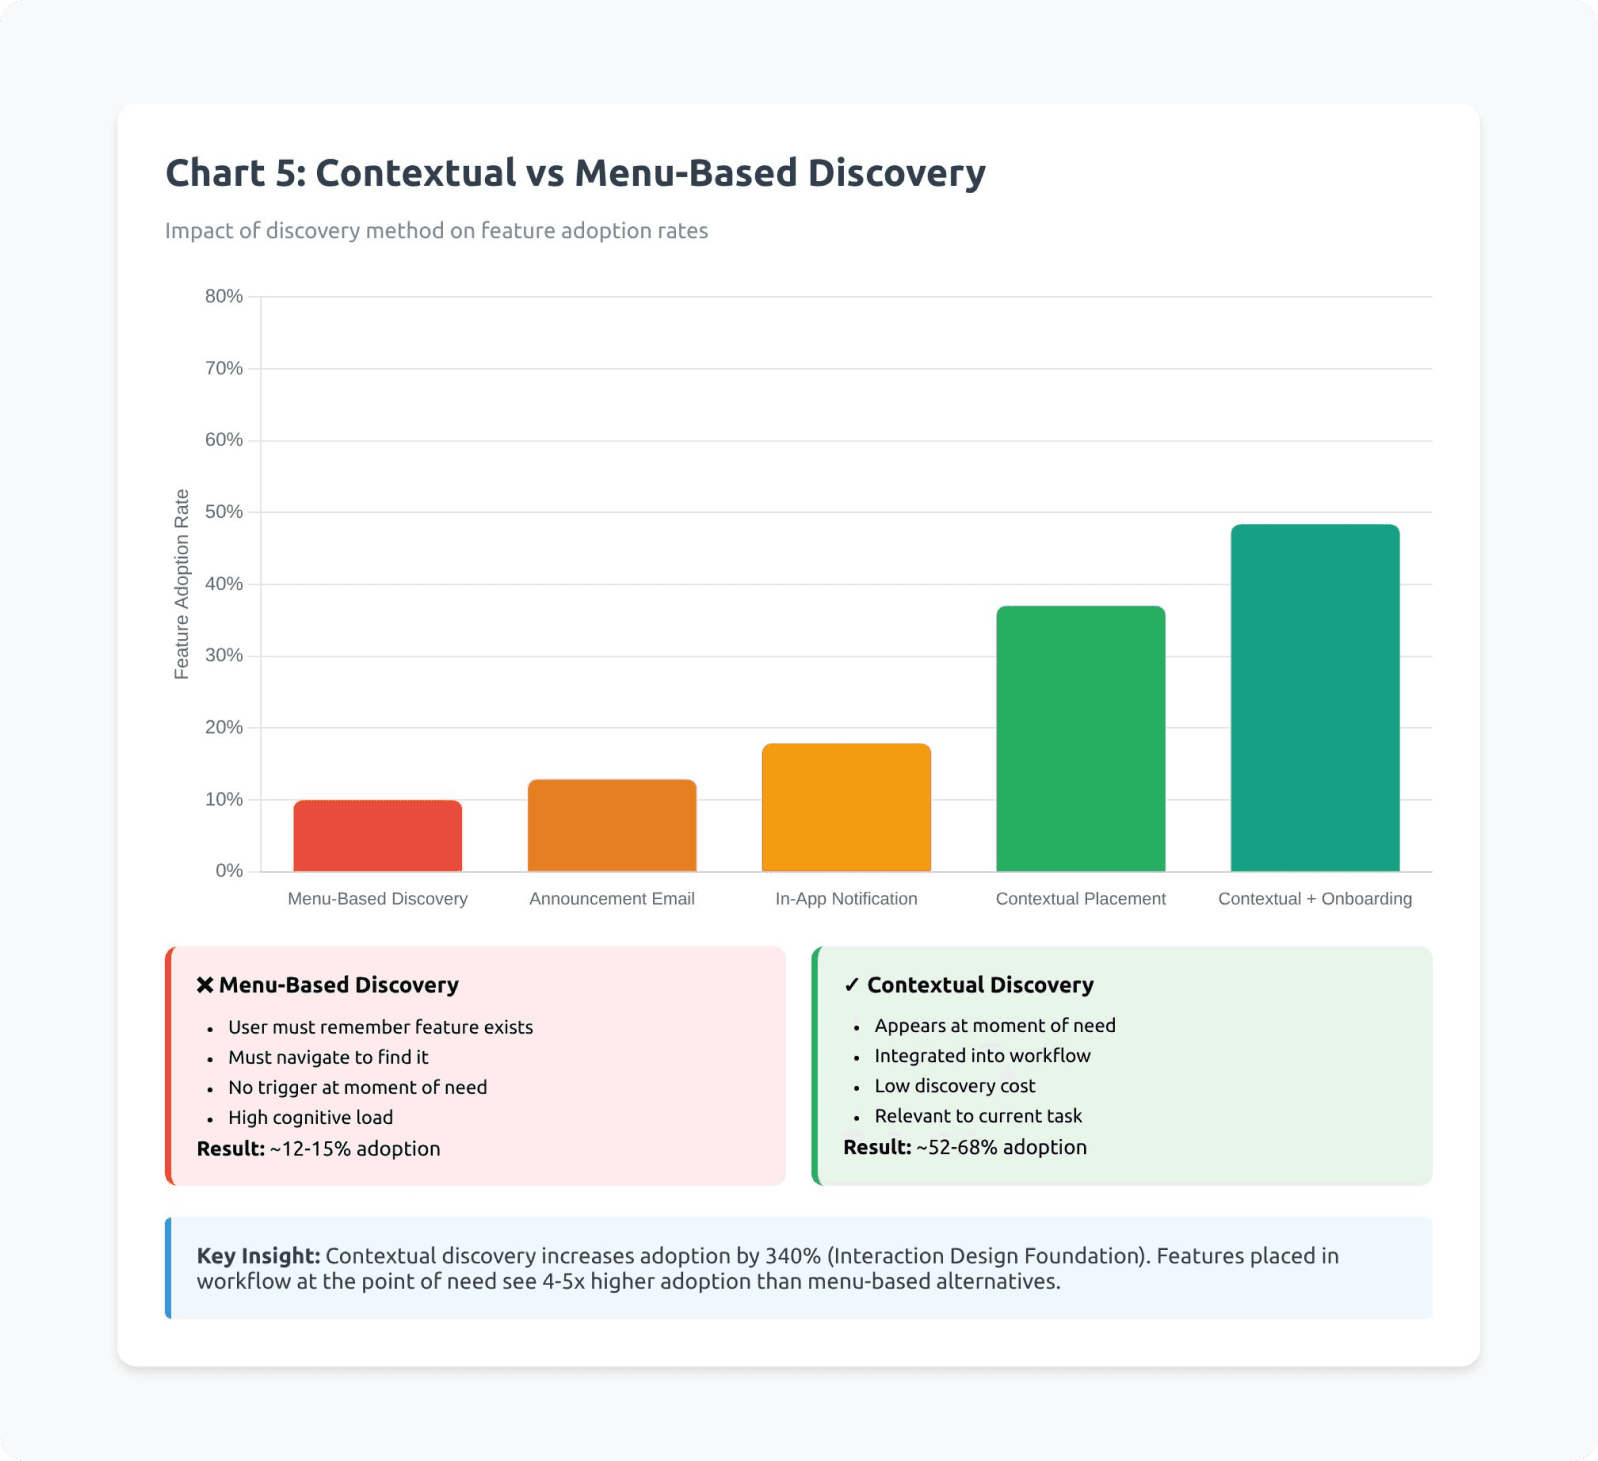
The Contextual Placement Principle
According to Stanford Human-Computer Interaction research, feature adoption rates correlate strongly with contextual relevance timing:
Features presented during relevant tasks: 58% adoption rate
Features presented in menu structures: 12% adoption rate
Features presented during unrelated workflows: 4% adoption rate
Implementation Framework
To fix discoverability issues, each feature should appear inside an active workflow when users experience the related problem. Accessibility within 1-2 clicks from relevant context is critical.
Clear, outcome-focused labels help, but the real power comes from surfacing features based on behavioral triggers rather than just UI menu placement.
Julie Zhuo, former VP of Product Design at Facebook, emphasizes this point: "If users encounter a feature at the precise moment of actual need, adoption rates double or triple compared to menu-based discovery."
Users also need confirmation that they've discovered something valuable, with the ability to dismiss and rediscover features if not immediately relevant. This balance between visibility and flexibility creates the optimal discovery experience.
Behavioral Trigger Strategy
Leading SaaS companies implement trigger-based discovery:
Usage pattern triggers: Detecting when users perform tasks manually that could be automated
Frequency triggers: Surfacing efficiency features after users repeat an action multiple times
Context triggers: Revealing capabilities when users enter specific workflow states
Collaborative triggers: Showing team features when multiple users engage with the same content
Key Takeaway: Discoverability failures—not value deficiencies—account for the majority of feature underutilization. Users need contextual revelation of capabilities at behaviorally relevant moments. Implementing trigger-based, workflow-integrated discovery mechanisms can dramatically increase adoption without adding new features.
3. Cognitive Load & Workflow Fit: The Usage Deterrent
Why Users Stick With What They Know
Humans instinctively minimize mental effort. When features require:
New conceptual learning
Disruption of established routines
Introduction of unfamiliar paradigms
Additional decision-making steps
Users postpone adoption indefinitely or abandon features entirely.
This represents a cognitive load problem—a core concept from cognitive psychology research.
Understanding Cognitive Load Theory
Nielsen Norman Group research on cognitive overload demonstrates:
As system complexity increases, task success rates decrease along a predictable curve.
The relationship follows this pattern:
"Each additional element of complexity reduces the probability of feature adoption by 15-25%, compounding across multiple complexity factors." — Don Norman, Design of Everyday Things
Cognitive Load Impact Formula
Feature Adoption Probability = Base Interest × (1 - Complexity Factor)^n
Where:
Base Interest = Initial user motivation (0-1 scale)
Complexity Factor = Percentage difficulty increase per element (0.15-0.25)
n = Number of complexity elements
Example:
If a feature has 4 complexity elements at 20% each: Adoption = 0.8 × (1 - 0.20)^4 = 0.8 × 0.41 = 32.8% of initially interested users
The Mental Model Mismatch
Users develop mental models of how software operates based on their initial experiences.
Features that violate or extend these models face adoption resistance.
According to research from the MIT Media Lab, users prefer familiar interaction patterns even when objectively less efficient than available alternatives. Don Norman of the Nielsen Norman Group explains: "Every additional element you add to the interface reduces the visibility of everything else. Progressive disclosure isn't just good design—it's cognitive psychology applied to software."
Statistical Evidence
Product usage analytics reveal:
Features requiring more than 3 steps to activate see 68% lower adoption (Pendo)
Each additional configuration field reduces completion rates by 11% (Baymard Institute)
Features matching existing user mental models achieve 3.2x higher adoption rates (Stanford HCI Group)
Real SaaS Example: Atlassian Jira
Jira exemplifies the cognitive load challenge. The platform offers extensive capabilities, yet most teams use only:
Create issue functionality
Status transitions
Basic commenting
Advanced capabilities remain largely untapped:
Custom workflow automation builders
Advanced JQL query construction
Cross-project dependency mapping
Sophisticated reporting frameworks
Why Advanced Jira Features Go Unused
The adoption barriers are primarily cognitive:
Features require substantial upfront setup investment
They extend cognitive effort beyond immediate task needs
They interrupt established workflow patterns
Documentation assumes technical sophistication
Jira's Cognitive Load Reduction Strategy
Atlassian implemented several solutions:
Templates: Pre-configured workflows for common use cases, eliminating setup friction
Default automation blueprints: No-code automation suggestions based on team patterns
Simplified board views: Abstracting complexity behind visual, intuitive interfaces
Progressive disclosure: Hiding advanced settings until users demonstrate readiness
Results: Template adoption increased advanced feature usage by 45% among teams that previously used only basic functionality.
The Workflow Integration Principle
According to Gartner research on enterprise software adoption, features integrated into existing workflows achieve 4.7x higher sustained usage than features requiring workflow modifications.
"Cognitive load isn't just about interface complexity—it's about the mental distance between a user's current state and the state required to use your feature." — Indi Young, Mental Models Expert
Progressive Complexity Framework
Leading SaaS products implement progressive complexity:
Layer 1: Immediate value with zero configuration Layer 2: Moderate customization for common scenarios Layer 3: Advanced capabilities for power users Layer 4: Expert-level functionality for edge cases
Each layer remains accessible, but defaults optimize for the majority use case.
Implementation Framework
Reducing cognitive load requires intelligent default settings that let users skip complex configuration. The UI should be designed for minimal cognitive footprint—clean, predictable, and familiar. Advanced settings work best when hidden by default but accessible when needed.
Complex features should be decomposed into smaller, sequential steps, with each step providing clear feedback and validation. Most importantly, users should be able to achieve meaningful outcomes before encountering complexity. This approach allows them to experience value first, then gradually explore advanced capabilities as their confidence grows.
The Default Configuration Strategy
Research from McKinsey on SaaS product design shows:
Products with smart defaults see 52% higher feature adoption than products requiring explicit configuration before use.
Smart Defaults Implementation
Analyze usage patterns across user base
Identify most common configuration choices
Implement these as defaults
Provide one-click customization access
Track whether users modify defaults (most won't)
Key Takeaway: Cognitive load and workflow misalignment deter feature adoption more powerfully than value perception. Users default to familiar patterns and minimize mental effort. Reducing activation friction through smart defaults, progressive complexity, and workflow integration dramatically increases sustained feature usage.
4. Activation & Habit Formation: Why Users Don't Explore Further

Beyond Initial Awareness
Getting users to adopt advanced features requires more than visibility. It demands behavioral reinforcement—the psychological mechanism that transforms one-time actions into repeated behaviors.
Activation vs Adoption Distinction
A single feature trial doesn't constitute adoption. True adoption requires integration into regular user behavior.
Feature Adoption Stages
Awareness: User knows feature exists
First use: User tries feature once
Successful outcome: Feature delivers expected value
Reward/Positive reinforcement: User receives tangible benefit
Habit formation: Feature becomes default behavior
Long-term value realization: Feature contributes to sustained outcomes
Breakdown occurs most frequently between stages 2-3 and 4-5
The Adoption Curve Research
SaaS adoption follows predictable behavioral patterns. According to research from Reforge's product analytics database:
If users don't reach second usage within 7 days of first trial, abandonment probability exceeds 85%.
The critical window for habit formation spans approximately 14-21 days, during which repeated successful usage must occur.
Statistical Impact of Habit Formation
Product analytics research reveals:
Users who achieve "second use" within one week show 3.2x higher 90-day retention (Amplitude)
Features that form habit loops reduce overall churn by 23-31% (Mixpanel)
Users who reach advanced feature proficiency demonstrate 2.8x higher lifetime value (ChartMogul)
"Retention is a function of habit strength. Products that create strong usage habits don't fight for attention—they become automatic user behaviors." — Nir Eyal, Hooked: How to Build Habit-Forming Products
The Retention Curve Relationship
According to research from Harvard Business School, users who engage with 3+ product features regularly show:
67% lower churn probability
2.3x higher product satisfaction scores
4.1x more likely to recommend the product
This demonstrates the powerful connection between feature depth utilization and business outcomes. As Nir Eyal, author of Hooked, explains: "Retention is a function of habit strength, and habits form through repeated successful usage triggered by consistent cues. Products that create these loops don't fight for attention—they become automatic behaviors."
Real SaaS Example: Figma's Mastery Path
Figma excels at progressive feature introduction aligned with user capability development:
Basic layer (Day 1-7):
Frame creation and basic shapes
Text and color tools
Simple layer manipulation
Intermediate layer (Week 2-4):
Components and instances
Basic auto-layout
Simple prototyping
Advanced layer (Month 2+):
Variants and component properties
Complex auto-layout configurations
Team libraries and design systems
Advanced prototyping with variables
Figma's Habit Formation Strategy
The platform implements several psychological reinforcement mechanisms:
Mastery signals: Visual indicators showing skill progression
Achievement unlocks: New capabilities appear as users demonstrate competency
Contextual education: Learning moments triggered by user actions, not menus
Social reinforcement: Collaborative features that reward team-based usage
Results: Users who progress through Figma's mastery path demonstrate 73% higher retention and 2.1x higher team expansion rates. Learn more about effective product design strategies.
The Behavioral Hook Model
According to research from Stanford's Persuasive Technology Lab, habit-forming products follow a four-phase cycle:
Trigger: External or internal cue to use the feature
Action: User performs the behavior
Variable reward: User receives unpredictable positive outcome
Investment: User commits something that improves future experiences
Features that complete this cycle create self-reinforcing usage loops.
Building Sustainable Habits
To build effective habit loops, features must connect to clear, measurable success metrics. Users need immediate positive feedback after using features—visual confirmation, saved time, or completed tasks work best.
The key is prompting users to revisit features at optimal intervals, creating natural rhythms (daily, weekly, or monthly) tied to their workflows. Casey Winters, former Chief Product Officer at Eventbrite, observes: "The features that become habits are the ones that make users feel successful. Success breeds repetition, repetition breeds habits, habits breed retention."
Features that make future use easier or more valuable—through saved preferences, accumulated data, or learned patterns—create investment that strengthens the habit loop. Adding social or collaborative elements further reinforces usage through peer interaction and shared outcomes.
The Reward Timing Principle
Behavioral psychology research demonstrates that immediate rewards create stronger habit formation than delayed rewards.
Features should provide:
Immediate feedback: Visual confirmation, saved time, completed tasks Medium-term value: Insights, automation, efficiency gains Long-term benefits: Accumulated data, learned preferences, skill development
Statistical Impact of Reward Structures
According to research from the Behavioral Economics Lab at MIT:
Features with immediate visual feedback achieve 41% higher repeat usage
Variable reward schedules (unpredictable positive outcomes) increase engagement by 58%
Investment mechanisms (user-contributed data/customization) improve retention by 34%
"Growth isn't about getting users to try more features—it's about getting them to form habits around the features that matter most." — Casey Winters, Former CPO at Eventbrite
The Second Use Critical Window
Product analytics consistently show that achieving second use represents the most critical adoption milestone.
Second Use Strategy
Track time-to-second-use for each feature
Identify features with >7 day second-use windows
Implement trigger mechanisms within 48-72 hours
Test email, in-app, or workflow-based prompts
Measure impact on repeat usage rates
Key Takeaway: Feature activation without habit formation leads to abandoned capabilities and unrealized value. Users must progress through awareness, successful first use, positive reinforcement, and repeated engagement to achieve true adoption. Products that implement behavioral trigger mechanisms, progressive mastery paths, and reward structures create self-reinforcing usage patterns that dramatically improve retention and lifetime value.
5. Solutions That SaaS Companies Adopt to Expand Usage
Leading SaaS companies have developed systematic approaches to address feature underutilization. These solutions focus on behavioral design rather than feature addition.
Solution A: Contextual Discovery Systems
Implementation: Intercom's Behavioral Trigger Framework
Intercom faced a common challenge: users weren't discovering or adopting saved replies and bot automation despite clear time-saving benefits.
The Problem Analysis
Traditional approach relied on:
Menu-based feature location
Documentation-driven learning
User-initiated exploration
Result: Less than 18% of eligible teams used automation features.
Intercom's Solution Architecture
The company implemented contextual suggestion systems:
Conversation analysis: Machine learning models identify repetitive response patterns
Intent detection: System recognizes when user is typing a response that matches saved reply patterns
Contextual prompts: Subtle UI suggestions appear during relevant conversations
One-click adoption: Users can implement suggestions without workflow interruption
Statistical Results
Saved reply adoption increased from 18% to 47% within 90 days
Bot creation rates improved by 63%
Average time-to-automation shortened from 3.2 weeks to 8.7 days
Overall team efficiency scores improved by 31%
Des Traynor, Intercom's co-founder, emphasizes the transformation: "We moved from asking users to explore features to inviting them at precisely the right moment. The difference was transformative."
Implementing Contextual Discovery
For teams looking to replicate this success, the approach requires behavioral analytics to detect feature-relevant moments, combined with non-intrusive suggestion UI that doesn't interrupt workflow. The key is creating one-click adoption paths from suggestions while continuously A/B testing trigger timing and messaging. Success comes from measuring adoption lift versus control groups and iterating based on dismissal patterns—when users consistently dismiss suggestions, timing or relevance needs adjustment.
Technical Implementation Pattern
According to research from the Product-Led Growth Collective, successful contextual discovery systems share common architectures:
Event tracking layer: Captures granular user behaviors Pattern recognition: Identifies scenarios matching feature use cases Trigger logic: Determines optimal suggestion timing UI presentation: Displays contextual prompts Adoption tracking: Measures conversion from suggestion to usage
Solution B: Guided Growth Paths
Implementation: Canva's Progressive Capability Framework
Canva needed to transition users from basic template usage to advanced design capabilities without overwhelming beginners.
The Challenge
Users engaged primarily with:
Pre-made templates
Basic text editing
Simple image uploads
Advanced features remained largely unused:
Custom brand kits
Advanced layout tools
Animation capabilities
Collaboration features
Canva's Growth Path Architecture
The company designed clear capability progression highways:
Stage 1: Template Success (Days 1-7)
Choose template
Customize text and images
Download finished design
Success metric: Complete one design
Stage 2: Creative Expansion (Weeks 2-4)
Explore additional templates
Modify layouts
Use photo effects
Success metric: Create designs across 2+ categories
Stage 3: Advanced Tools (Month 2+)
Custom dimensions
Brand kit creation
Advanced element manipulation
Success metric: Create from blank canvas
Stage 4: Collaboration & Efficiency (Month 3+)
Team folders
Brand templates
Approval workflows
Success metric: Multi-user collaboration
Behavioral Reinforcement Mechanisms
At each stage, Canva implemented:
Achievement recognition: Visual celebration of milestone completion Capability unlocks: New tools introduced after demonstrating readiness Progressive challenges: Gentle nudges toward next-level features Social proof: Examples of what users at similar stages create
Statistical Results
According to Canva's published case studies:
Users following guided paths showed 58% higher feature adoption
Churn decreased by 24% among users who reached Stage 3
Template-to-custom-design conversion improved from 12% to 34%
Average lifetime value increased 2.3x for guided path users
Melanie Perkins, Canva's co-founder, captures the strategic shift: "We stopped treating our product like a buffet and started treating it like a guided tour. Users need a path, not just options."
Implementing Guided Paths
Creating effective guided growth paths starts with mapping the user journey into clear capability stages with defined success metrics for each. The key is designing progressive feature introduction sequences that feel natural rather than forced, combined with achievement markers and celebrations that recognize progress.
Stage-appropriate educational content helps users understand what's possible at each level, while monitoring stage progression rates and friction points reveals where users get stuck. Continuous A/B testing of transition triggers and messaging optimizes the pace and effectiveness of capability advancement.
The Progressive Disclosure Principle
Research from the Human-Computer Interaction Institute at Carnegie Mellon demonstrates:
Products using progressive disclosure achieve 67% higher advanced feature adoption compared to products presenting full capabilities immediately.
Solution C: Smart Defaults & Template Systems
Implementation: Notion's Configuration Reduction Strategy
Notion faced a paradox: powerful flexibility intimidated new users, causing abandonment before value realization.
The Friction Analysis
Complex configuration requirements created:
43% abandonment during initial setup
Average 6.2 days before first meaningful use
High support ticket volume about "how to start"
Perception of "too complicated for my needs"
Notion's Template Revolution
The company systematically reduced activation friction through:
Pre-built workspace templates:
Project management
Personal knowledge base
Meeting notes
Product roadmaps
Team wikis
One-click deployment: Templates install fully configured with example content
Contextual customization: Users modify working examples rather than building from scratch
Progressive complexity: Templates reveal advanced features gradually
The Psychological Shift
Templates transformed user mental models:
Before: "I need to learn how to build this" After: "I can customize this working example"
This shift eliminated the blank-canvas intimidation factor.
Statistical Impact
Notion reported significant improvements:
Time-to-first-value decreased from 6.2 days to 47 minutes
Setup abandonment dropped from 43% to 12%
Advanced block usage increased by 89%
User satisfaction scores improved by 37 points
Support ticket volume decreased by 54%
Ivan Zhao, Notion's co-founder, captures the insight: "We realized users don't want to configure a system—they want to use a solution. Templates bridge that gap."
Implementing Smart Defaults
Building effective smart defaults starts with analyzing the most common user configurations across your base. Focus on the top 5-7 use cases that represent the majority of users, then build templates populated with realistic, helpful example content.
The deployment mechanism should be one-click simple, with inline guidance for customization. Track which templates users select most frequently and measure their customization patterns—this data continuously improves default configurations. Products implementing smart defaults see 52% reduction in time-to-value and 38% improvement in feature discovery, according to research from the Design Leadership Forum.
Advanced Implementation: Adaptive Defaults
Leading SaaS products now implement adaptive defaults:
User segment detection: Identify user type based on signup data Contextual defaults: Present configurations matching user segment Behavioral learning: Adjust defaults based on early usage patterns Personalized recommendations: Suggest templates based on similar user success patterns
Key Takeaway: Leading SaaS companies solve feature underutilization through systematic behavioral design: contextual discovery systems that surface features at relevant moments, guided growth paths that progressively introduce capabilities, and smart defaults that eliminate configuration friction. These approaches increase adoption rates by 40-90% without adding new features—by improving how users encounter and integrate existing capabilities. For a comprehensive evaluation of your product's usability, consider a thorough UX audit.
Conclusion: Reframing Feature Adoption
Yes—it's normal that most users interact with approximately 20% of a SaaS product's capabilities. This behavioral pattern reflects fundamental aspects of human cognition, workflow optimization, and habit formation.
But normal doesn't mean inevitable or unchangeable.
The Real Metric That Matters
Feature adoption isn't the goal. Value realization is the goal.
Some features serve critical but infrequent needs. Their low usage frequency doesn't diminish their importance. Other features remain underutilized despite high potential value—these represent the true opportunity.
The Path Forward
With systematic application of behavioral design principles—contextual discovery systems, workflow-integrated feature revelation, cognitive load minimization, progressive capability paths, and habit-forming mechanisms—you can shift the usage curve dramatically.
Evidence-Based Transformation
Leading SaaS companies demonstrate consistent results:
40-90% improvement in feature adoption rates
24-31% reduction in churn among users adopting advanced features
2-3x higher lifetime value for users engaging with feature depth
52% reduction in time-to-value through smart defaults and templates
Implementation Priority
Immediate (Week 1): Audit feature discoverability and map features to workflow contexts. Segment your features by usage frequency—daily, weekly, monthly, situational, and rarely-used. Calculate adoption rates for each feature among active users and identify those used by fewer than 15% of eligible users.
Short-term (Weeks 2-4): Implement contextual discovery for top 3 underutilized high-value features. Map each feature to the workflow context where it becomes relevant and design contextual triggers that surface them during relevant tasks. Create one-click adoption paths from suggestions.
Medium-term (Months 2-3): Build template systems and smart defaults to reduce activation friction. Create pre-configured templates for common use cases and implement progressive complexity with simple-to-advanced paths.
Ongoing: Develop guided growth paths and habit formation mechanisms across the product experience. Track time-to-second-use for each feature and implement trigger systems for second-use prompts within 48-72 hours. Design clear success metrics and immediate positive feedback mechanisms.
The most critical measurement framework includes: feature adoption rate (percentage of eligible users), time-to-first-use (days from signup), time-to-second-use (hours between first and second usage), repeat usage rate (percentage using feature 3+ times), and retention correlation (relationship between feature usage and account retention).
The Strategic Perspective
Your 80% of underutilized features aren't necessarily failures. They may be successes waiting for better discovery mechanisms, clearer value communication, and workflow integration.
The competitive advantage lies not in building more features, but in helping users discover and adopt the valuable capabilities you've already built. As Shreyas Doshi, former product lead at Stripe, Twitter, and Google, notes: "Building features users don't adopt is organizational waste. The solution isn't better marketing—it's better behavioral design integrated into the product experience itself."
Start with one underutilized feature. Apply the frameworks in this guide. Measure the impact. Then scale what works.
For more insights on building products users love, explore our blog or learn about our approach to product design.
Glossary
Activation Friction: The resistance users experience when attempting to adopt new features or behaviors. Includes mental effort required, number of steps to complete, and uncertainty about outcomes. Lower activation friction correlates with higher adoption rates.
Behavioral Trigger: A contextual cue that prompts users to engage with specific features at relevant moments. Can be event-based (user performs action), time-based (specific interval), or pattern-based (detected usage patterns).
Cognitive Load: The mental effort required to process information and complete tasks. Higher cognitive load reduces task success rates and feature adoption. Product design should minimize cognitive load through familiarity, simplicity, and progressive complexity.
Contextual Discovery: The practice of revealing features within active workflows at behaviorally relevant moments, as opposed to requiring menu-based exploration. Dramatically improves adoption compared to navigation-dependent discovery.
Discoverability: The degree to which users will naturally encounter features when they become relevant, without active searching. Distinct from findability, which measures whether features can be located when actively sought.
Feature Depth: The number of distinct features or capabilities a user regularly engages with. Higher feature depth typically correlates with increased retention and lifetime value.
Habit Formation: The process by which repeated behaviors become automatic responses to consistent cues. Features that create habit loops through trigger-action-reward cycles achieve higher sustained usage.
Information Architecture: The structural design of information and functionality within a product. Good information architecture enables intuitive navigation and feature discovery. Poor architecture creates confusion and hidden capabilities.
Mental Model: The internal representation users develop of how software operates. Features that align with existing mental models see higher adoption than those requiring users to learn new conceptual frameworks.
Power Law Distribution: A mathematical relationship where a small number of items account for the majority of effects. In SaaS, a small percentage of features typically generate most user interactions, following the 80/20 pattern.
Progressive Disclosure: A design pattern that reveals complexity gradually as users demonstrate readiness, rather than presenting all capabilities simultaneously. Reduces initial cognitive load while maintaining access to advanced functionality.
Progressive Complexity: An architectural approach that organizes features into layers from simple to sophisticated, with each layer accessible but defaults optimized for majority use cases.
Retention Curve: A graph showing what percentage of users continue active usage over time. Features that form habits improve retention curves by reducing churn at critical time intervals.
Smart Defaults: Pre-configured settings that eliminate setup requirements by implementing the most common user choices automatically, while maintaining customization options for those who need them.
Time-to-Value: The duration between user account creation and experiencing meaningful benefit from the product. Reducing time-to-value through templates, defaults, and guided paths improves activation and retention.
Usability Debt: The accumulated cost of poor information architecture, hidden features, and high cognitive load. Like technical debt, usability debt compounds over time and requires systematic remediation.
Referenced Authorities
Throughout this analysis, insights and research from the following authoritative sources informed the frameworks and recommendations:
Research Institutions
Nielsen Norman Group — User experience research and usability standards
Stanford Human-Computer Interaction Group — Interface design and behavioral research
MIT Media Lab — Technology interaction and cognitive load studies
Harvard Business School — Product strategy and retention research
Carnegie Mellon Human-Computer Interaction Institute — Progressive disclosure and interface design
Industry Research Organizations
Baymard Institute — E-commerce and SaaS usability research
Forrester Research — Technology adoption and user behavior analysis
Gartner — Enterprise software adoption patterns
McKinsey & Company — Product design and business impact studies
Product Analytics Providers
Pendo — Feature adoption and usage analytics across SaaS products
Amplitude — Behavioral analytics and retention research
Mixpanel — Product engagement and user journey analysis
ChartMogul — SaaS metrics and lifetime value correlation studies
Behavioral Design Experts
Reforge — Product-led growth and adoption frameworks
Center for User Experience Research — Discoverability and findability studies
Design Leadership Forum — Smart defaults and configuration research
Behavioral Economics Lab at MIT — Reward structures and habit formation
Stanford Persuasive Technology Lab — Behavioral hook models and engagement
These sources represent decades of accumulated research on user behavior, product design, and feature adoption patterns across thousands of software products and millions of users.


