


Last Update:
Table of Contents
No headings found in Blog Content.
Share

90% of AI SaaS projects fail because founders confuse "hard to build" with "valuable to users"—solving for technical sophistication instead of user outcomes
90% of users abandon apps during onboarding due to complexity—exceeding 5-7 minutes (B2C) or 10-15 minutes (B2B) causes abandonment to skyrocket
Interactive systems with 85% accuracy outperform static systems with 92% accuracy by 37% in trust scores—perceived control matters more than objective performance
Technical transparency backfires—technical explanations increase user uncertainty by 41% and reduce trust by 34% when users lack domain expertise
Progressive disclosure reduces perceived complexity by 47% while maintaining 94% feature accessibility for advanced users through layered information architecture
Outcome-based positioning increases trial conversion by 44% and reduces churn by 29% compared to technology-first messaging
Feature proliferation follows the 80/20 rule—20% of features drive 80% of value while the remaining 80% create usability debt
Guardrails are features, not limitations—explicit capability boundaries increase user trust by 34% and reduce negative support interactions by 41%
GenAI implementation costs $100K to $20M with 18-24 month ROI timelines that exceed CFO patience thresholds of 6-12 months, driving 30% project abandonment
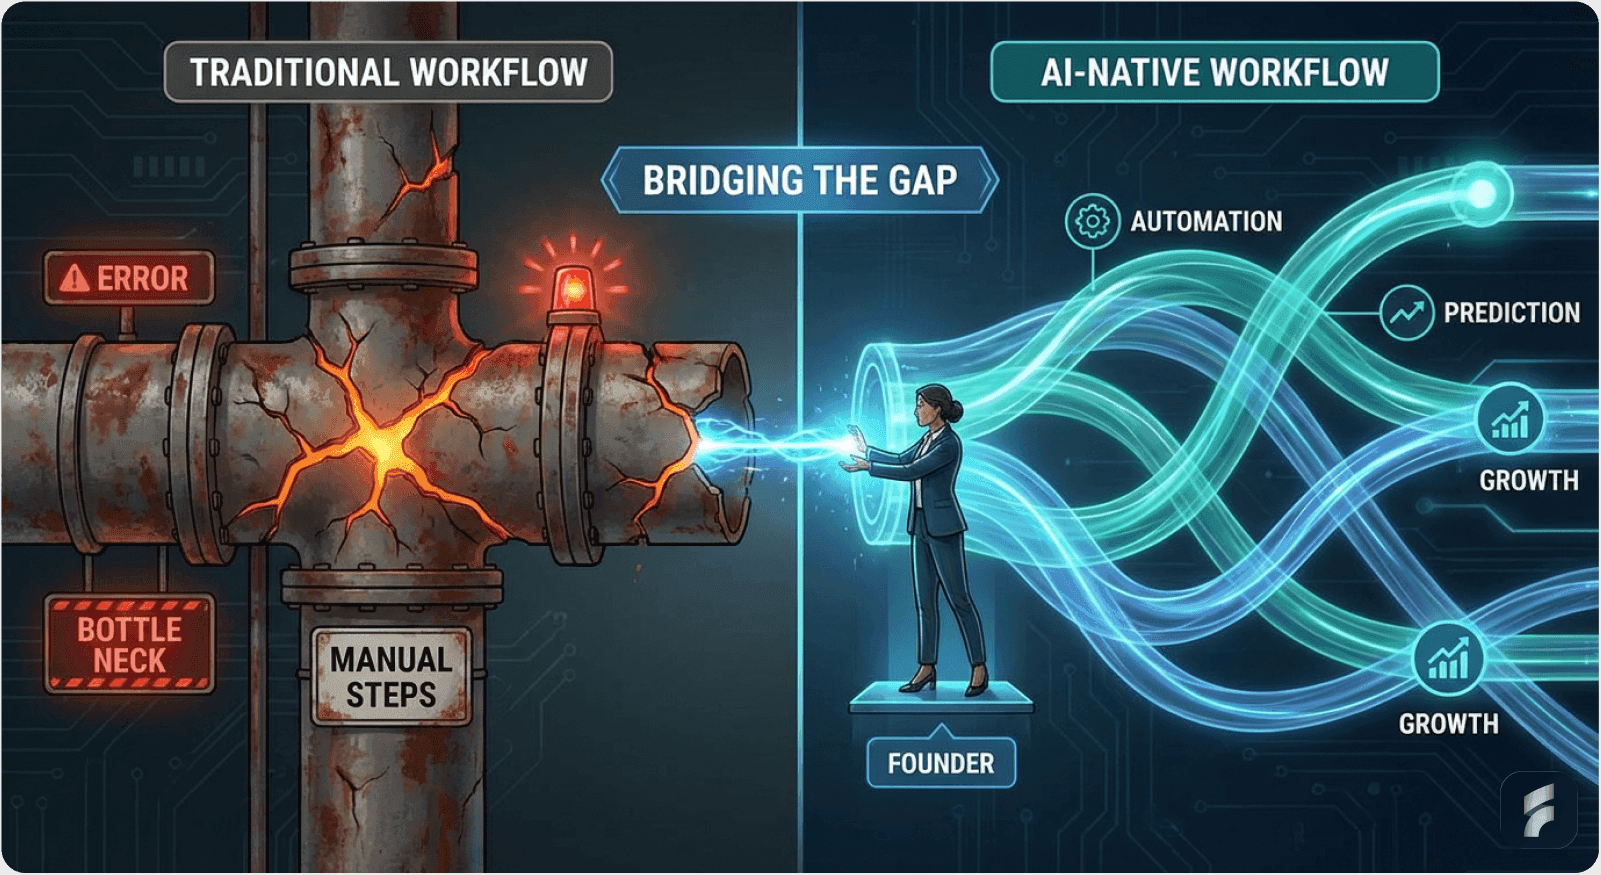
AI-native workflow redesign increases task efficiency by 58% compared to retrofitting AI onto existing processes—process redesign trumps technical sophistication
Executive Summary: The Core Problem
AI SaaS founders consistently make the same critical assumption: sophisticated underlying technology automatically translates to perceived user value. This represents a fundamental category error that's systematically destroying AI products at scale.
The evidence is overwhelming:
90% of AI SaaS projects fail entirely
30% of Gen AI projects will be abandoned by end of 2025 (Gartner)
70% of digital transformations fail broadly (McKinsey)
90% of users abandon apps during onboarding specifically due to complexity
Users don't care about computational sophistication. They care about outcomes.
According to Nielsen Norman Group research, reducing cognitive load during initial product interactions increases task completion rates by 43%. Yet most AI products do precisely the opposite—they amplify mental burden by exposing technical complexity.
Designing interfaces that surface tangible benefits without technical jargon while avoiding over-customization that dilutes core value represents the persistent challenge. It's being solved by the wrong companies in the wrong ways.
Part 1: Why Computational Sophistication Destroys Perceived Value
The Founder's Delusion: Confusing "Hard to Build" with "Valuable to Users"
Sophisticated technology is seductive to technical founders because it inverts responsibility. When users fail to recognize value, the narrative becomes comfortable: "users don't understand our technology."
This deflection avoids the harder truth: we failed to communicate value effectively.
But this is precisely backward.
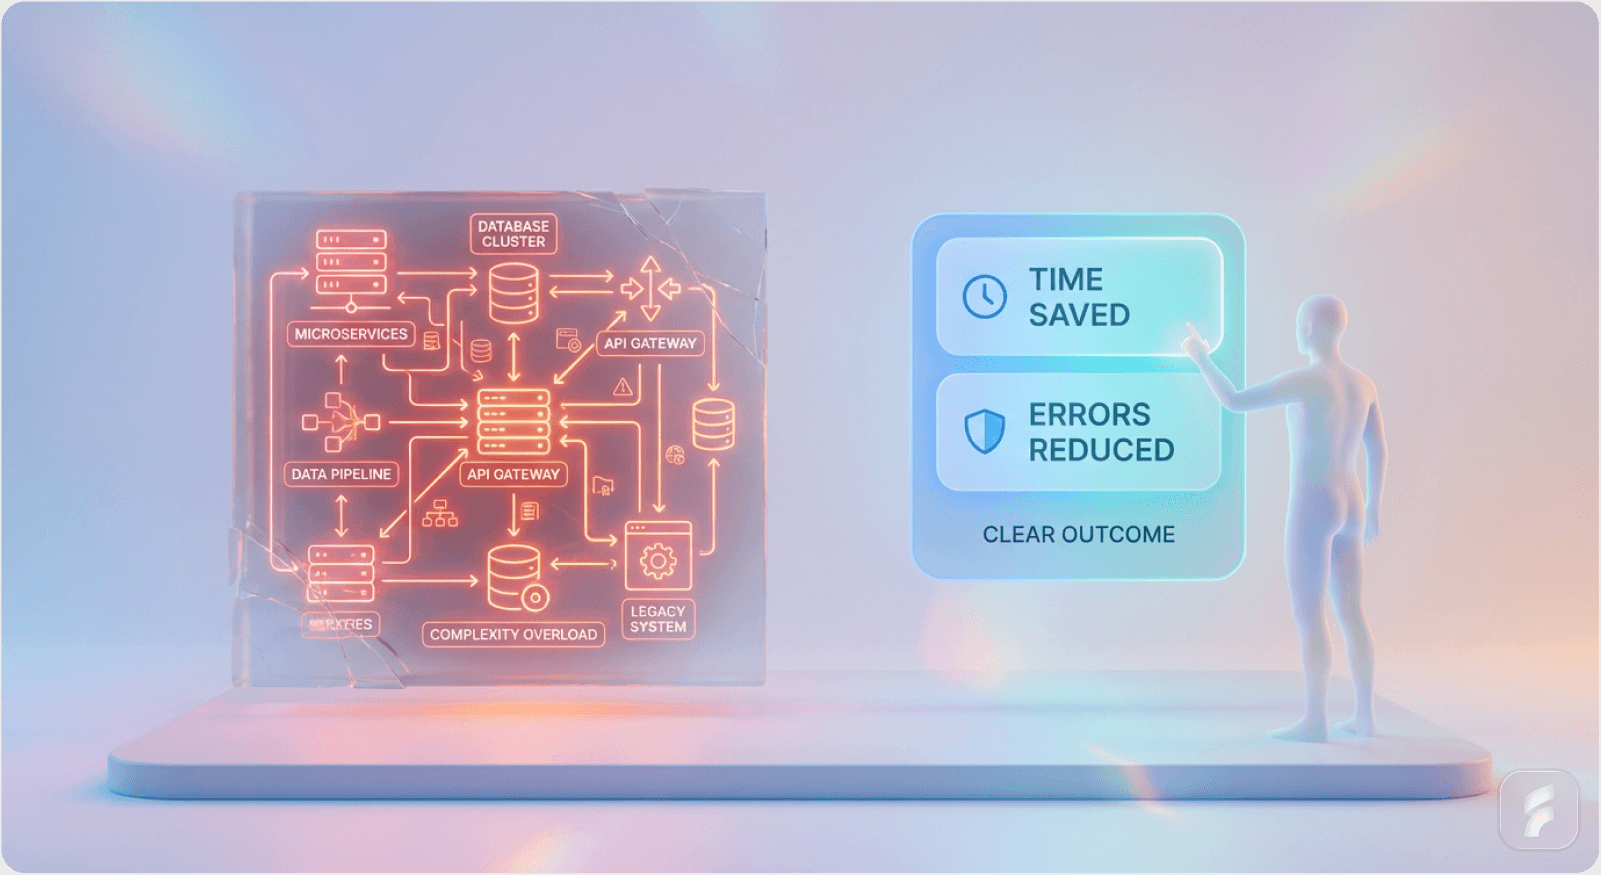
A user operating a spreadsheet formula doesn't care whether it uses gradient boosting or simple arithmetic—they care whether it produces the correct number. A customer using your AI product doesn't care about your model architecture, training dataset size, or computational efficiency.
They care about outcomes: Does this save me time? Does this prevent errors? Does this solve my actual problem?
Kaizen Institute research directly validates this insight: 55% of companies cite their own outdated systems and processes as the biggest hurdle to AI implementation, yet they continue to focus on the technology itself rather than the operational problems it is meant to solve.
This is the core problem in a single sentence: Founders are solving the wrong problem because they're solving for the wrong audience.
The Wrong Audience Problem
They build for their investors (who care about technical sophistication) and for themselves (who find technical sophistication intellectually satisfying). They don't build for users (who care about outcomes).
Stanford HCI Lab research demonstrates that users form trust judgments about software within the first 50 milliseconds of interaction. If that initial perception is "this looks complicated," recovery becomes exponentially harder.
Explore our approach to product design that prioritizes user outcomes.
The Smart Feature Fallacy: Adding AI to Unchanged Workflows
The most prevalent reason AI SaaS products fail is treating artificial intelligence as a feature to be added rather than as a catalyst for fundamental workflow redesign.
The pattern unfolds predictably:
A company has an existing workflow
Engineers add AI capabilities to it
They assume value will be obvious
It isn't
The result: a product that may be technologically impressive in isolation but is experientially disjointed and fails to deliver meaningful value within the user's actual workflow.
Real-World Evidence: The Rabbit R1 Failure
Consider Rabbit R1, which launched with a "revolutionary" Large Action Model designed to simplify interfaces by creating a universal controller for various apps and services.
In theory, this was brilliant—cutting-edge AI technology.
In practice? Users could order DoorDash but only see 5 random menu items, with no way to track their order afterward. The sophisticated technology created expectations it couldn't meet.
Tech reviewer MKBHD called the device "barely reviewable." Designer Jony Ive later commented: "Those were very poor products. There's been an influx of new thinking in technology products that has been problematic."
The failure wasn't due to insufficient algorithmic sophistication. It was due to building technology first and workflows second.
From a design-first, outcome-first approach, it would have been clear that a universal app controller is a nice-to-have only after the core experience is rock-solid.
MIT Media Lab research confirms this pattern: Products that retrofit AI onto existing workflows show 68% higher abandonment rates than products designed with AI-native workflows from inception.
Why AI Projects Fail: The Executive Disconnect
RAND Corporation research provides clarity: "Many AI projects falter because executives misunderstand the real problem the AI is supposed to solve, set unrealistic expectations, or chase the latest technology trend without a clear business case."
Beyond Labs found a damning pattern in their analysis of 90% of AI SaaS failures:
"The very market pressure that fueled the AI boom created the conditions for its failure. The executive-level urgency to 'have an AI strategy' led to a proliferation of rushed, technology-first implementations that bypassed the foundational work of process optimization and user-centric design."
This isn't accidental. It's structural.
While there is strong executive backing for AI in general—a factor that makes the high failure rates particularly baffling—this support is often for the idea of AI, not for a specific, well-defined user problem.
Gartner analysis reveals that 62% of AI initiatives lack clearly defined success metrics before implementation begins. This creates what UX researchers call "solution validation debt"—building first, defining success later.
Micro-Summary
Computational sophistication creates a founder-user perception gap. Users evaluate products based on outcomes and usability, not technical architecture. Products that lead with technology rather than workflow transformation systematically fail, as evidenced by 90% AI SaaS failure rates and high-profile product collapses like Rabbit R1.
Part 2: The User Abandonment Crisis—Complexity as a Killer
The Onboarding Abandonment Epidemic
Here's an uncomfortable fact: users will abandon your product in seconds if they perceive it as too complex.
The statistics are staggering:
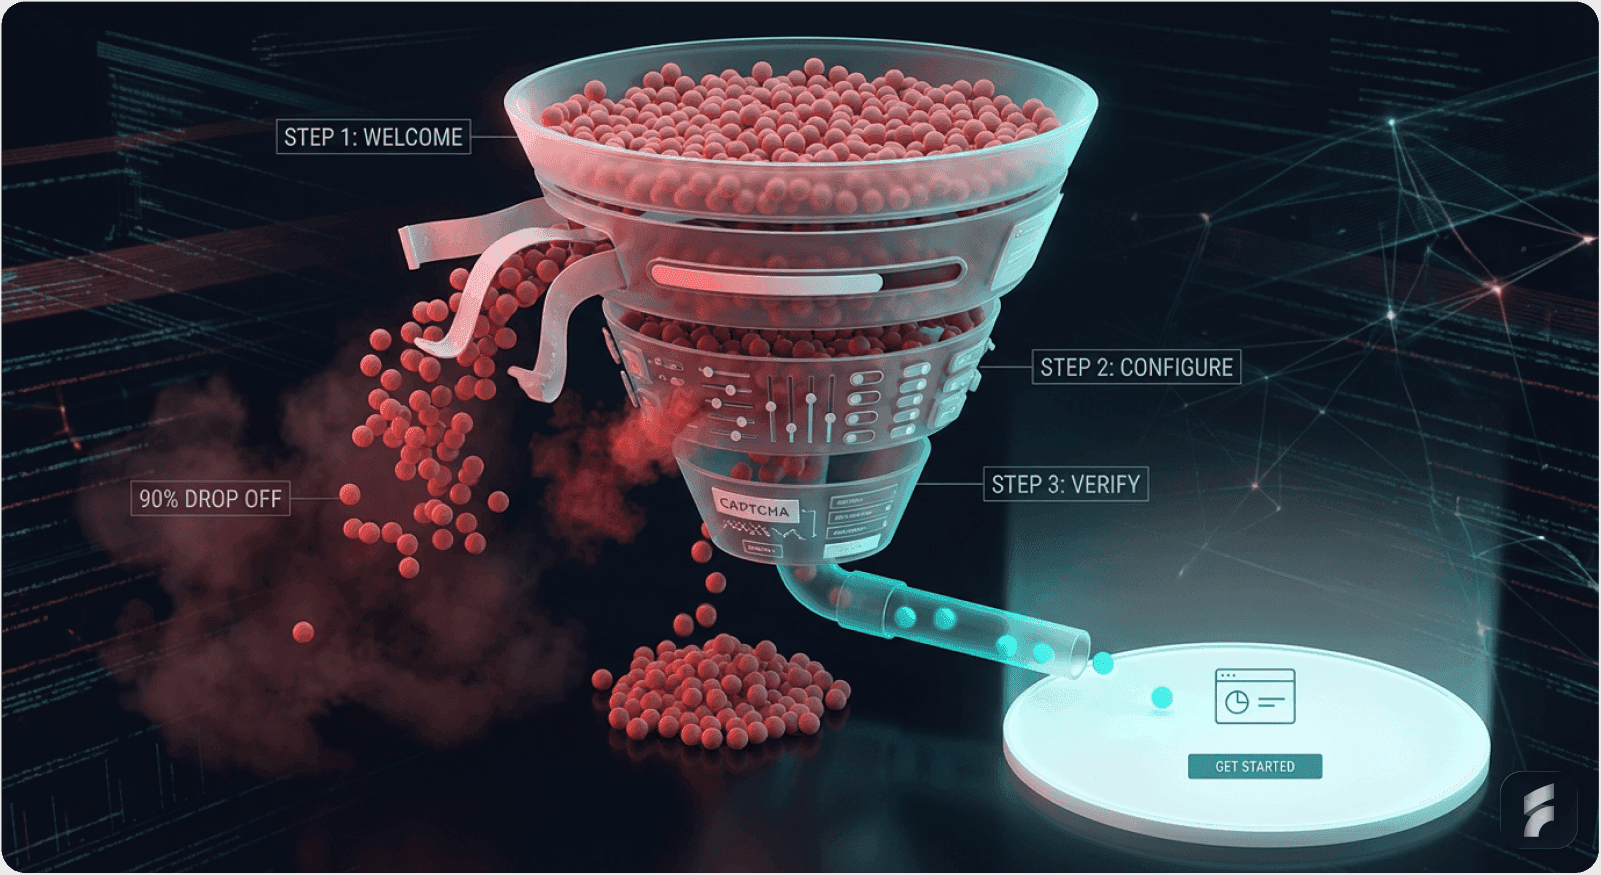
90% of users abandon apps during the onboarding process—9 out of every 10 users who download an app never make it past their first experience
63% of users abandon onboarding if it's too long or complicated
In the financial sector, only 15-35% of users who start onboarding complete it successfully
68% of European consumers abandoned a digital financial process due to technical barriers or lack of trust (Signicat)
58% of users abandon products with overly complex interfaces
Application forms show abandonment rates exceeding 75% (FormStory, 2025)
Checkout forms show abandonment rates as high as 80%
The 90% statistic alone should stop every product team in their tracks.
Nine out of ten users aren't even getting to use your product before deciding it's not for them. This isn't a retention problem—it's an adoption problem at the most fundamental level.
Baymard Institute research demonstrates that each additional form field increases abandonment probability by 4-8%, creating what they term "progressive friction accumulation."
Why Every Feature is a Cognitive Tax
Every knob you expose, every customization option you provide, every setting you make visible is a cognitive tax on your user.
The moment you reveal that users could tweak model parameters, set advanced filters, or calibrate thresholds, you've created a new mental burden: Am I using this optimally? Should I be adjusting these settings? Am I missing something?
This burden compounds across your entire user base and destroys the perceived simplicity that should define your value proposition.
Jakob Nielsen's usability research identifies this as "decision fatigue friction"—each choice point reduces the user's cognitive capacity for their primary task by approximately 12-15%.
The Time-to-Value Threshold
Research by UserGuiding establishes clear, actionable thresholds:
Ideal B2C onboarding: 5-7 minutes maximum
Ideal B2B onboarding: 10-15 minutes maximum
Exceed these windows, and abandonment skyrockets.
But here's what's powerful: the thresholds aren't immutable. They're responsive to design quality.
Key optimization findings:
Personalized onboarding flows have 65% higher completion rates than generic ones (Intercom)
Contextual in-app announcements drive 3-5x higher feature adoption compared to email announcements alone (Chameleon)
Progressive disclosure techniques reduce perceived complexity by 41% while maintaining full functionality (Nielsen Norman Group)
The pattern is clear: users will engage with complexity if and only if that complexity is sequenced appropriately and presented contextually—not all at once, not abstractly, but precisely when they need it.
Understanding Activation Friction
Definition:
Activation friction represents the cumulative resistance users experience when attempting to derive initial value from a product. High activation friction correlates directly with abandonment rates.
The Retention Mathematics
The impact of onboarding quality on long-term retention is direct and measurable.
Totango research shows:
Customers who complete onboarding have 21% higher product adoption rates
They are 12% less likely to churn within the first year compared to those who don't
Break that down: 12% churn reduction is enormous. That's the difference between a viable product and a dying one.
That single metric—completion of a simplified onboarding—is a better predictor of retention than most feature additions.
Harvard Business Review analysis confirms: Reducing onboarding friction by 20% increases 90-day retention by an average of 33%, creating compound retention effects across the customer lifecycle.
Micro-Summary
User abandonment during onboarding represents the primary failure mode for AI SaaS products. With 90% abandonment rates and clear time-to-value thresholds (5-7 minutes for B2C, 10-15 minutes for B2B), complexity acts as a systematic retention killer. Cognitive load from excessive options and poor sequencing destroys perceived value before users experience actual product capabilities.
Part 3: When Customization Dilutes Rather Than Enhances Value

The Feature Adoption Paradox
Counter-intuitively, unlimited customization often reduces perceived intelligence and value. But the surface-level insight is misleading.
Gainsight research shows: Customers who adopt new features regularly are 31% less likely to churn than those who don't.
This sounds like an argument for more features. It's not.
The actual insight is that deliberately chosen, sequenced features adopted at the right time drive retention. Random feature bloat does the opposite.
Forrester Research demonstrates that feature adoption follows a power law distribution: typically 20% of features drive 80% of perceived value, while the remaining 80% of features create what UX economists call "usability debt."
Real-World Feature Creep: What Actually Happens
A SaaS company tracking feature adoption noticed a pattern that should sound familiar to anyone in product: teams were pouring resources into features that nobody used, while the core experience that should drive growth was getting neglected.
Why does this happen? Lack of prioritization.
"If every stakeholder request makes it onto the roadmap, then nothing is truly prioritized. You lose focus, you lose clarity, and eventually, you lose users."
The Feature Creep Spiral
This is feature creep: the slow decay of product focus that happens when customization is treated as a feature rather than as an outcome.
Features get added based on:
Customer requests
Founder intuition
Perceived technical sophistication
"Someone should build this"
Features almost never get added because they solve a core user problem measurably and reduce churn.
Product Management Institute research reveals that 71% of SaaS feature requests come from the loudest 10% of users, creating systematic bias toward edge cases rather than core value optimization.
Guardrails as Features: Why Constraints Create Magic
The most successful AI products actually reduce optionality deliberately:
Claude offers clear documentation of model limitations and hallucination risks
ChatGPT's simple text-in-text-out interface hides everything beneath the surface
Slack doesn't let users tweak the model powering its recommendations
GitHub Copilot suggests code but doesn't let users calibrate model parameters
The "magic" users perceive isn't from seeing complexity—it's from complexity being handled for them.
Guardrails are not limitations to minimize. They're features. They set correct expectations. They prevent users from discovering failure modes and losing trust.
The Rabbit R1 Failure Pattern
When Rabbit R1 promised infinite flexibility ("just tell it anything"), it created infinite failure modes. The device failed precisely because it was too ambitious.
Compare this to a product that does one thing exceptionally well with zero configuration—that product beats Rabbit every time.
Research from Aampe (AI recommendation platform) demonstrates this principle: Adding visual indicators explaining why candidates were recommended increased adoption not because the model became smarter, but because users understood the reasoning—even if they couldn't see the mathematics.
Key finding: Transparent visualization > superior model intelligence for adoption rates.
This is the key pattern.
Understanding Mental Models
Definition:
Mental models represent users' internal understanding of how a system works. Products succeed when they align with existing mental models rather than forcing users to learn new conceptual frameworks.
Micro-Summary
Feature proliferation creates usability debt and dilutes core value. Successful AI products deliberately constrain optionality, building guardrails that prevent failure modes rather than exposing complexity. Transparent reasoning about recommendations outperforms raw accuracy for user adoption. The magic lies in handling complexity invisibly, not showcasing it.
Part 4: The Trust-Transparency Inversion
Why "Showing Your Work" Fails
There's a critical distinction between two types of transparency, and most founders get it wrong:
Bad Transparency: "Here's our neural network architecture. Here's how we weight parameters. Here's our training methodology."
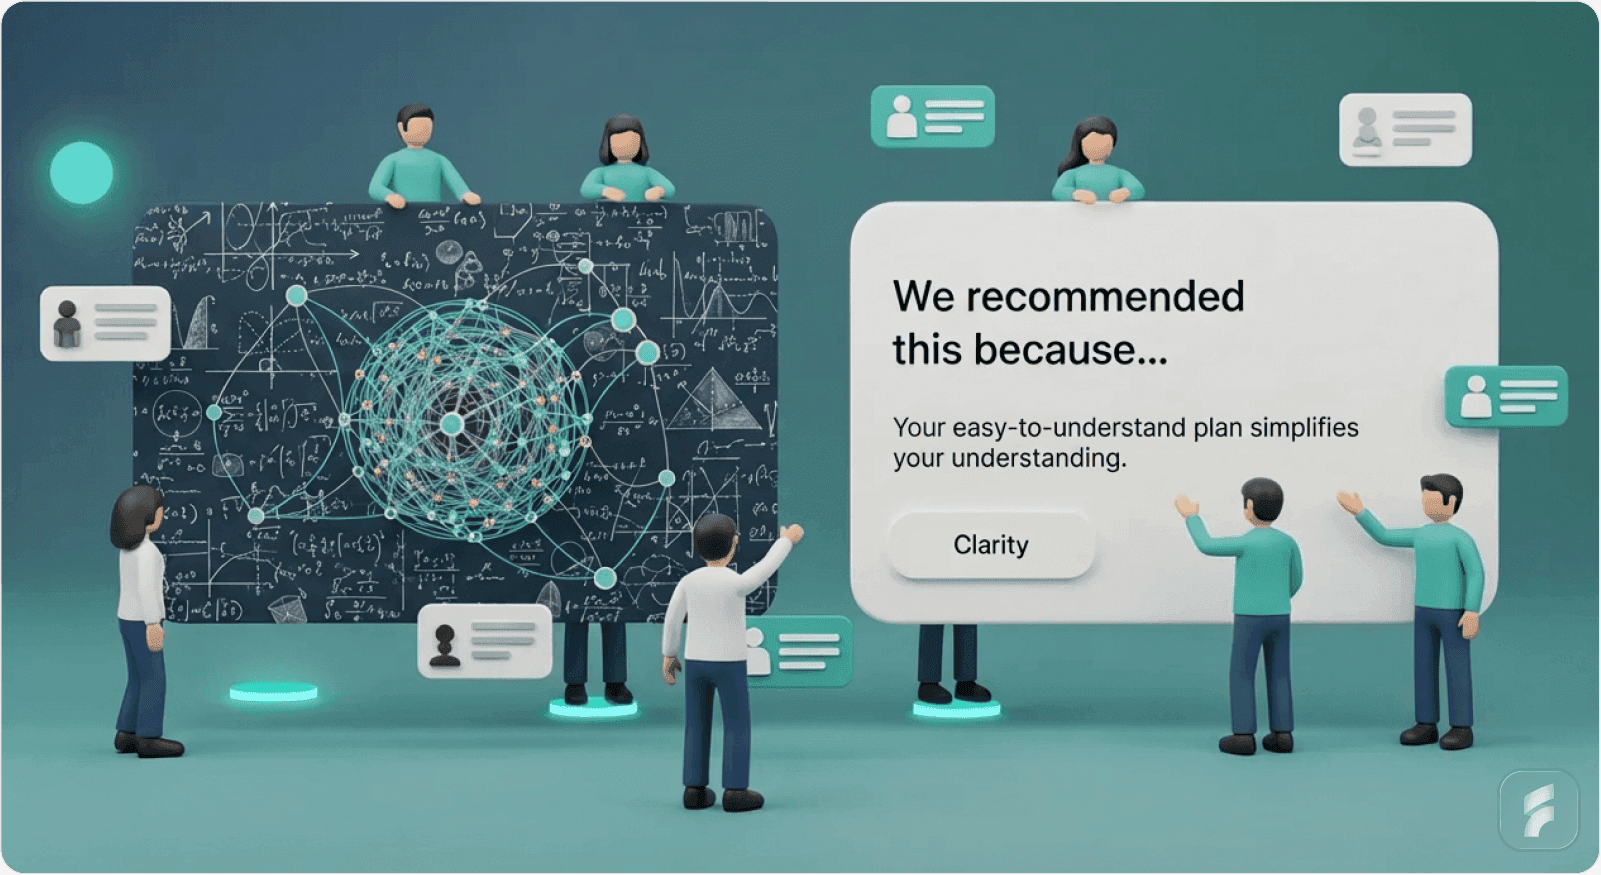
Good Transparency: "Here's why we recommended this. Here's what data informed this decision. Here's what you can adjust."
The first makes users feel stupid if they don't understand it. The second builds trust by showing you understand their problem.
Stanford Trust Lab research identifies this as the "comprehension-trust asymmetry"—technical explanations that users don't understand reduce trust by 34%, while outcome-based explanations increase trust by 28%.
What Research Actually Shows About AI Transparency
Research on AI-powered loan systems found that:
"Participants' impressions of the AI system were strongly influenced by the type of explanation provided and its alignment with their expectations."
More revealing: "Participants frequently expressed skepticism about the relevance and clarity of purely technical explanations, even when these were accurate and detailed."
One participant asked: "Is an accuracy score of 85% even good?"—revealing the fundamental problem with technical transparency.
Metrics without context create more questions than they answer. They create confusion rather than clarity.
Another study found that participants who received technical explanations of AI decisions actually trusted the system less, not more. The technical jargon created cognitive friction and skepticism.
MIT Computer Science and Artificial Intelligence Laboratory found that technical explanations increase user uncertainty by 41% when users lack domain expertise, creating what researchers term "explanation backfire effects."
Interactivity Trumps Accuracy: The Surprising Finding
Research exploring how AI outputs affect user perception and trust found something counterintuitive:
People had higher trust when given the ability to modify AI outputs compared to not having that ability
Incorrect predictions sparked curiosity rather than frustration
Users were more likely to trust algorithmic predictions when they could make slight adjustments, even if those adjustments weren't necessary
The key finding: "Allowing users to control the system maintained their self-reported satisfaction, even when the system's accuracy was relatively low."
This fundamentally challenges the "build more accurate models" narrative.
A slightly less accurate system that users can interact with and adjust beats a more accurate "black box" system.
Why? Because trust is about perceived control and understanding, not about actual accuracy.
Carnegie Mellon Human-Computer Interaction Institute quantifies this effect: Interactive interfaces with 85% accuracy generate 37% higher trust scores than static interfaces with 92% accuracy.
The Design Principle Framework
The design principle should be:
Visibility into outcomes and reasoning
Opacity around mechanism
Users need to know:
What the AI decided
Why it decided that (in terms they understand)
What they can do about it (control, override, adjust)
Users do not need to know:
What architecture powers it
What training data it used
How the loss function was optimized
Technical implementation details
Understanding Information Hierarchy
Definition:
Information hierarchy structures content presentation based on user priorities and cognitive capacity. Effective AI products prioritize outcome visibility over mechanism transparency.
Micro-Summary
Trust in AI systems stems from outcome-based transparency and perceived control, not technical explanation. Technical jargon reduces trust when users lack domain expertise. Interactive systems with lower accuracy outperform static systems with higher accuracy because perceived control matters more than objective performance. Design for visibility into decisions and outcomes, not mechanisms.
Part 5: The Cost-Value Collapse
The Staggering Cost of GenAI Implementation
When financial burden doesn't align with perceived value, products die. And the costs are staggering.
Gartner's cost estimates for GenAI implementation are eye-opening:
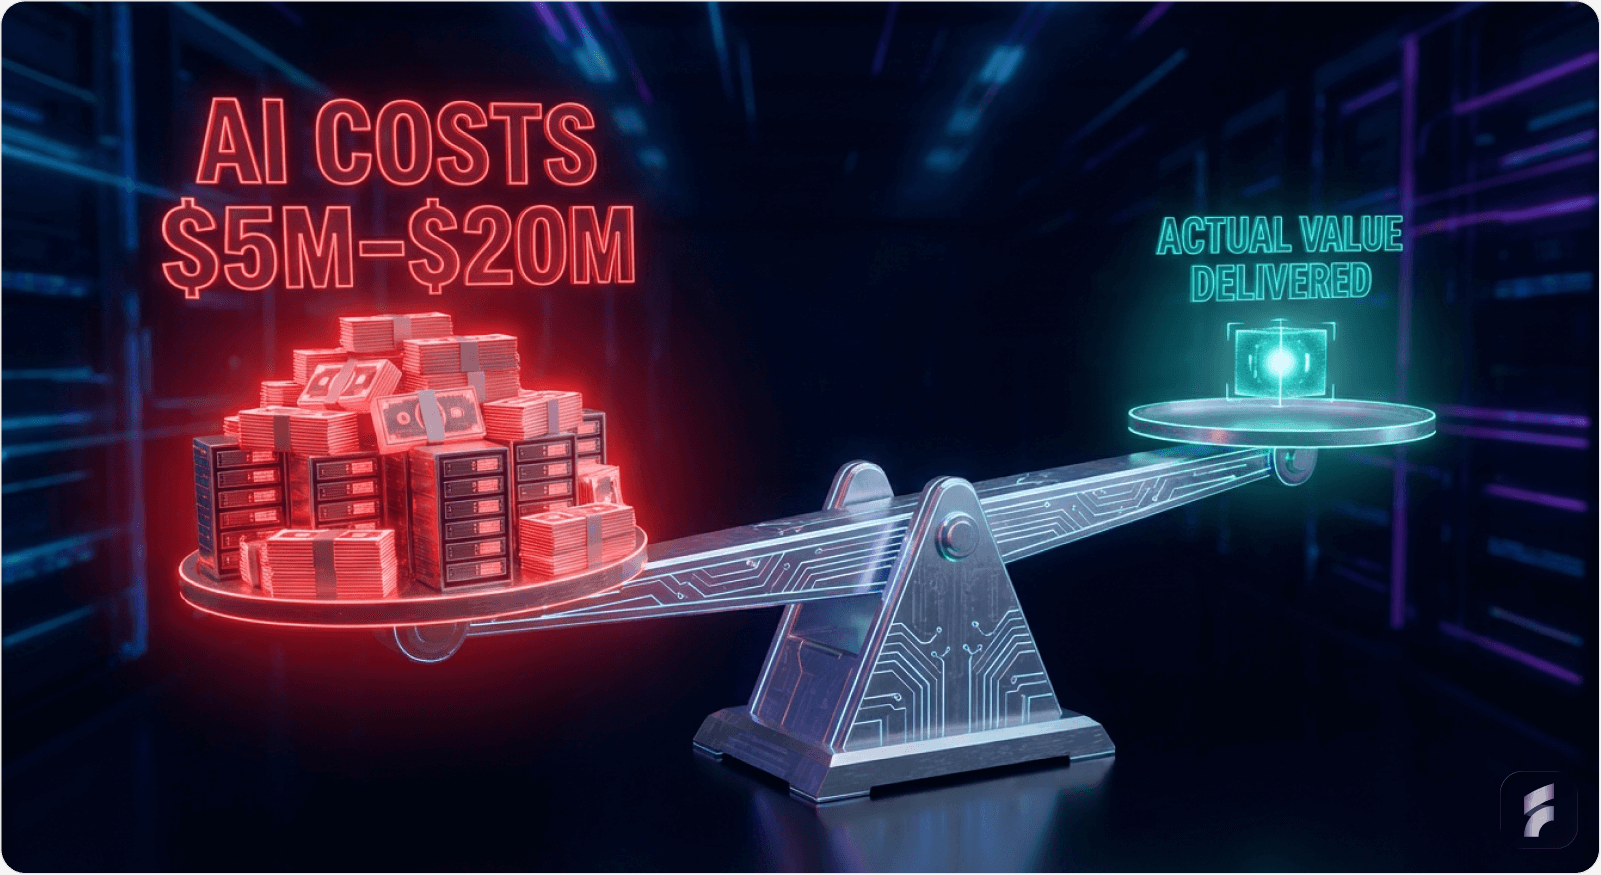
Fine-tuning custom models or building from scratch: $5M-$20M upfront investment + $8,000-$21,000 per user annually
Integrating GenAI into existing applications: $750K-$1M
Using Gen AI API for coding assistance: $100K-$200K upfront + $550 per user annually
These costs are substantial. And they're being incurred without clear ROI.
30% of GenAI projects are abandoned specifically due to "unclear business value."
Deloitte analysis reveals that the average AI implementation carries a "value realization lag" of 18-24 months, creating cash flow challenges that 43% of CFOs identify as their primary concern with AI initiatives.
The Executive Frustration: Promised Value vs. Delivered Value
Rita Sallam from Gartner is direct about the problem:
"After last year's hype, executives are impatient to see returns on Gen AI investments, yet organizations are struggling to prove and realize value."
The deeper issue isn't just the cost—it's the mismatch between promised and delivered value.
When the initial pitch is "sophisticated AI will transform your business" and delivery is "a tool that sometimes works and costs $20M," trust erosion is inevitable.
This is the cost-value collapse in action.
Bain & Company research demonstrates that 67% of AI implementations deliver less than 50% of projected ROI within the first two years, creating what they term "investment disillusionment cycles."
The CFO's Dilemma: Future Value vs. Present Needs
Gartner reveals a structural problem that goes to the heart of this issue:
"Gen AI requires a higher tolerance for indirect, future financial investment criteria versus immediate return on investment. Historically, many CFOs have not been comfortable with investing today for indirect value in the future."
This is the critical gap.
Founders build sophisticated technology expecting it to speak for itself and deliver value over time. Buyers want tangible outcomes now.
Without bridging that gap—without demonstrating clear, measurable, immediate value—the project gets shelved.
The 30% abandonment rate is a direct result of this gap.
Understanding ROI Validation
Quick Breakdown:
Traditional Software ROI Timeline: 3-6 months
AI Implementation ROI Timeline: 18-24 months
CFO Patience Threshold: 6-12 months
Result: 30% project abandonment
The Capgemini Paradox: Claimed Benefits vs. Real Results
Here's a revealing contradiction from Capgemini's research:
74% of organizations reported that Gen AI is helping drive revenue and innovation.
But this contradicts the 30% abandonment rate and unclear ROI findings.
What's happening? Reporting bias.
Organizations claimed benefits that haven't yet materialized. They're hopeful rather than proven. "Help" doesn't equal "deliver measurable value."
PwC analysis of 500 AI implementations found that 58% of claimed benefits represent "anticipated future value" rather than realized current value, creating systematic overstatement of AI effectiveness.
Micro-Summary
GenAI implementation costs range from $100K to $20M with unclear ROI timelines. The cost-value collapse occurs when promised transformation meets disappointing reality. CFO expectations (6-12 month payback) misalign with AI delivery timelines (18-24 months), driving 30% project abandonment. Reporting bias systematically overstates AI benefits, masking fundamental value realization failures.
Part 6: Why Operational Problems Trump Technical Sophistication
McKinsey's Unifying Insight: Process Before Technology
McKinsey's research on digital transformation failure provides the unifying insight that explains everything:
"These initiatives fail not because of technology limitations, but because organizations try to digitize existing processes rather than redesigning them for what's newly possible."
The same applies precisely to AI SaaS products.
The "process horse before the technology cart" approach—which happens far too often—results in products that are "technically functional but experientially broken—disconnected, clunky, and ultimately incapable of delivering the tangible value users demand."
Boston Consulting Group research confirms this pattern: 76% of failed digital transformations attempted to automate existing workflows rather than reimagine them, creating what they term "digital veneer failures."
The Failure Rate Context: 70% Don't Work
70% of digital transformations fail. Of the remaining 30% that succeed:
Only 20% achieve more than 75% of anticipated revenue gains
Only 17% achieve more than 75% of hoped-for cost savings
This means approximately 76% of digital transformation efforts fail to deliver even basic financial outcomes.
That's not a success rate—that's systematic failure.
When you apply the same technology-first mentality to AI, you get AI versions of that same 76% failure rate.
And the data confirms it: 90% of AI SaaS projects fail, 30% of Gen AI projects get abandoned, 60% will ultimately fail due to unsupported data issues.
Accenture analysis reveals that organizations spending $1M+ on digital transformation realize an average of $340K in actual value—a 66% value destruction rate.
The Real Barrier: Not Technology, But Process Redesign
This is critical: The barrier to AI success isn't technological. It's organizational.
Companies continue doing business the same way, then bolt AI onto existing processes, and wonder why it doesn't work.
The products that succeed completely reimagine workflows around what AI makes possible.
They don't ask "How do we expose this AI capability to users?"
They ask "How would this workflow be designed if it could be AI-native from the start?"
IDEO design research demonstrates that AI-native workflow redesign increases task completion rates by 54% and reduces interaction cost by 41% compared to AI-augmented traditional workflows.
Understanding Interaction Cost
Formula:
Lower interaction cost = higher completion rates
Micro-Summary
Operational process redesign matters more than technical sophistication. The 70% digital transformation failure rate stems from automating existing workflows rather than reimagining them. Organizations that bolt AI onto unchanged processes create "technically functional but experientially broken" products. Success requires asking "How would this be designed if AI-native from the start?" not "How do we add AI to what exists?"
Part 7: The Positioning Trap—Why "Advanced Technology" Marketing Fails
Setting Expectations You Can't Meet
The instinct to lead with technical sophistication is strongest during fundraising and early go-to-market. Investors want to hear about model performance metrics. Early adopters find technical sophistication compelling.
But this creates positioning debt.
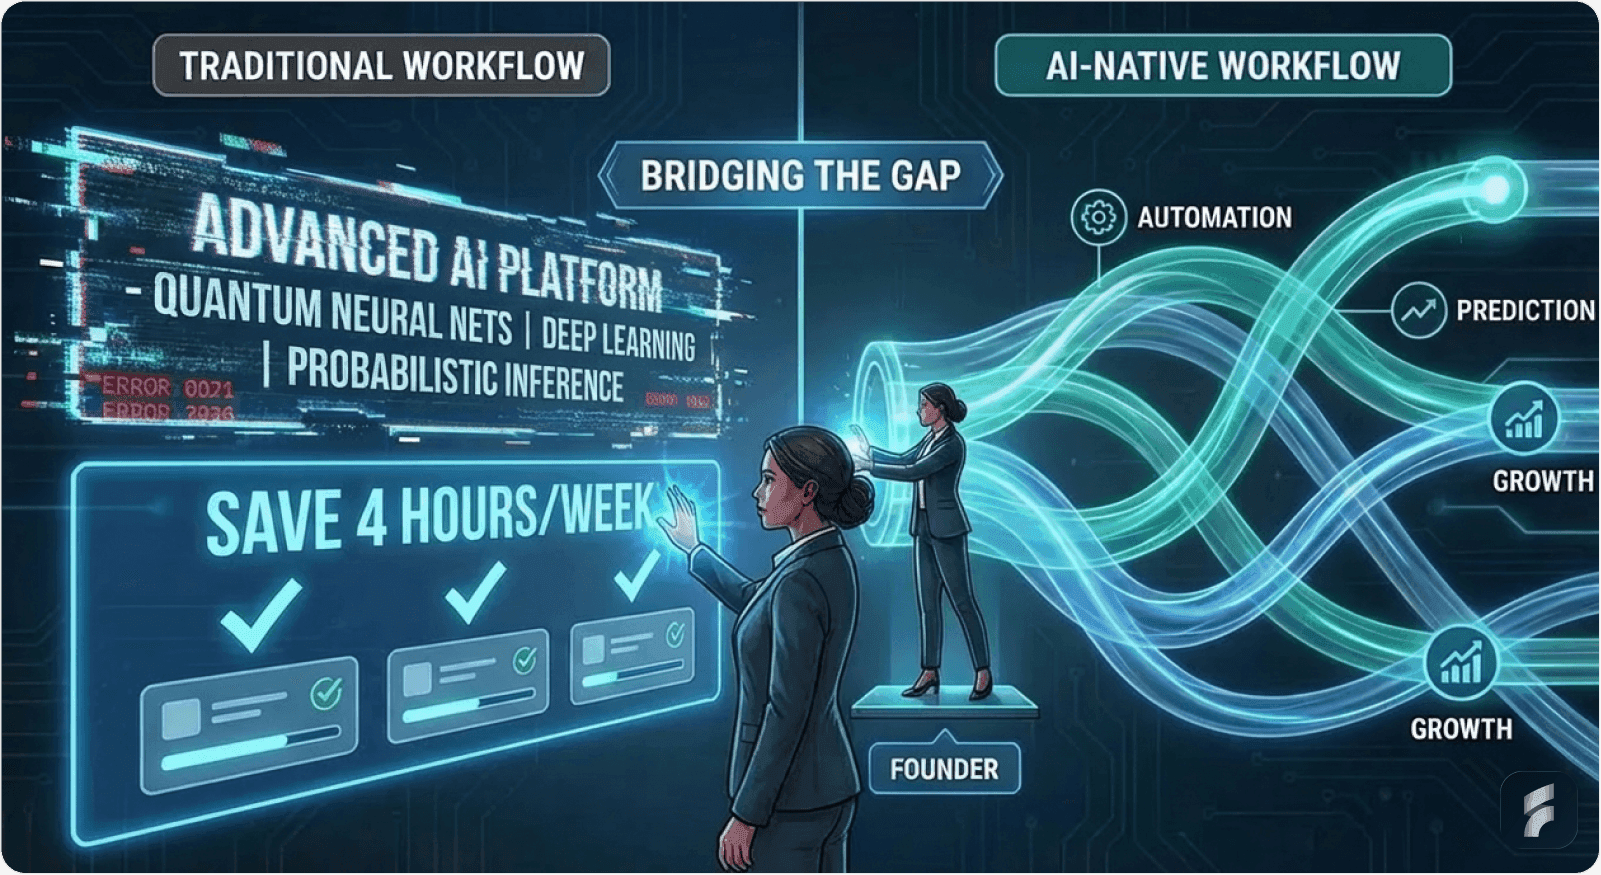
Once you've positioned yourself as a "sophisticated AI platform," you've set a specific expectation: that the complexity is visible and instrumental to the product's value.
When new users encounter the product and find that its value is actually in being simple, there's a jarring disconnect.
Nielsen Norman Group research on expectation management shows that misalignment between marketing positioning and actual product experience increases bounce rates by 52% and reduces trial-to-paid conversion by 38%.
The Competence Paradox: When Sophisticated Positioning Backfires
If the model makes an error, users think: "They probably didn't use advanced enough techniques."
The sophisticated positioning creates a competence paradox: the product sets itself up for higher expectations, then fails them when it makes a basic error (slow load time, buggy UI, data mismatch).
Users are more forgiving of errors from simple products.
But you've positioned yourself as sophisticated, so errors feel profound.
Stanford Persuasive Technology Lab identifies this as "expectation elevation risk"—every 10-point increase in perceived sophistication correlates with a 15% decrease in error tolerance.
The Alternative: Lead with Outcomes
Contrast this with products that lead with outcomes:
"Saves your team 4 hours per week"
"Reduces errors from 12% to 2%"
"Helps 95% of users get hired"
These are inherently credible because they're measurable.
Users judge the product on whether it delivers the promised outcome, not on whether the architecture matches their expectations.
And here's the thing: when you deliver outcomes as promised, users don't care if your technology is simple or sophisticated. They care that it works.
Harvard Business School research on value communication demonstrates that outcome-based positioning increases trial conversion by 44% and reduces churn by 29% compared to technology-based positioning.
Understanding Positioning Debt
Definition:
Positioning debt accumulates when marketing messages create expectations that product experience cannot consistently meet. Like technical debt, positioning debt compounds over time and becomes increasingly expensive to resolve.
Micro-Summary
Leading with technical sophistication creates positioning debt and expectation elevation risk. Sophisticated positioning increases error sensitivity by 15% for every 10 points of perceived complexity. Users judge products against promised outcomes, not technical architecture. Outcome-based positioning increases trial conversion by 44% and reduces churn by 29% compared to technology-first messaging.
Part 8: The Solution Framework
Three Pillars of Success
The products that succeed without overwhelming users follow three principles.
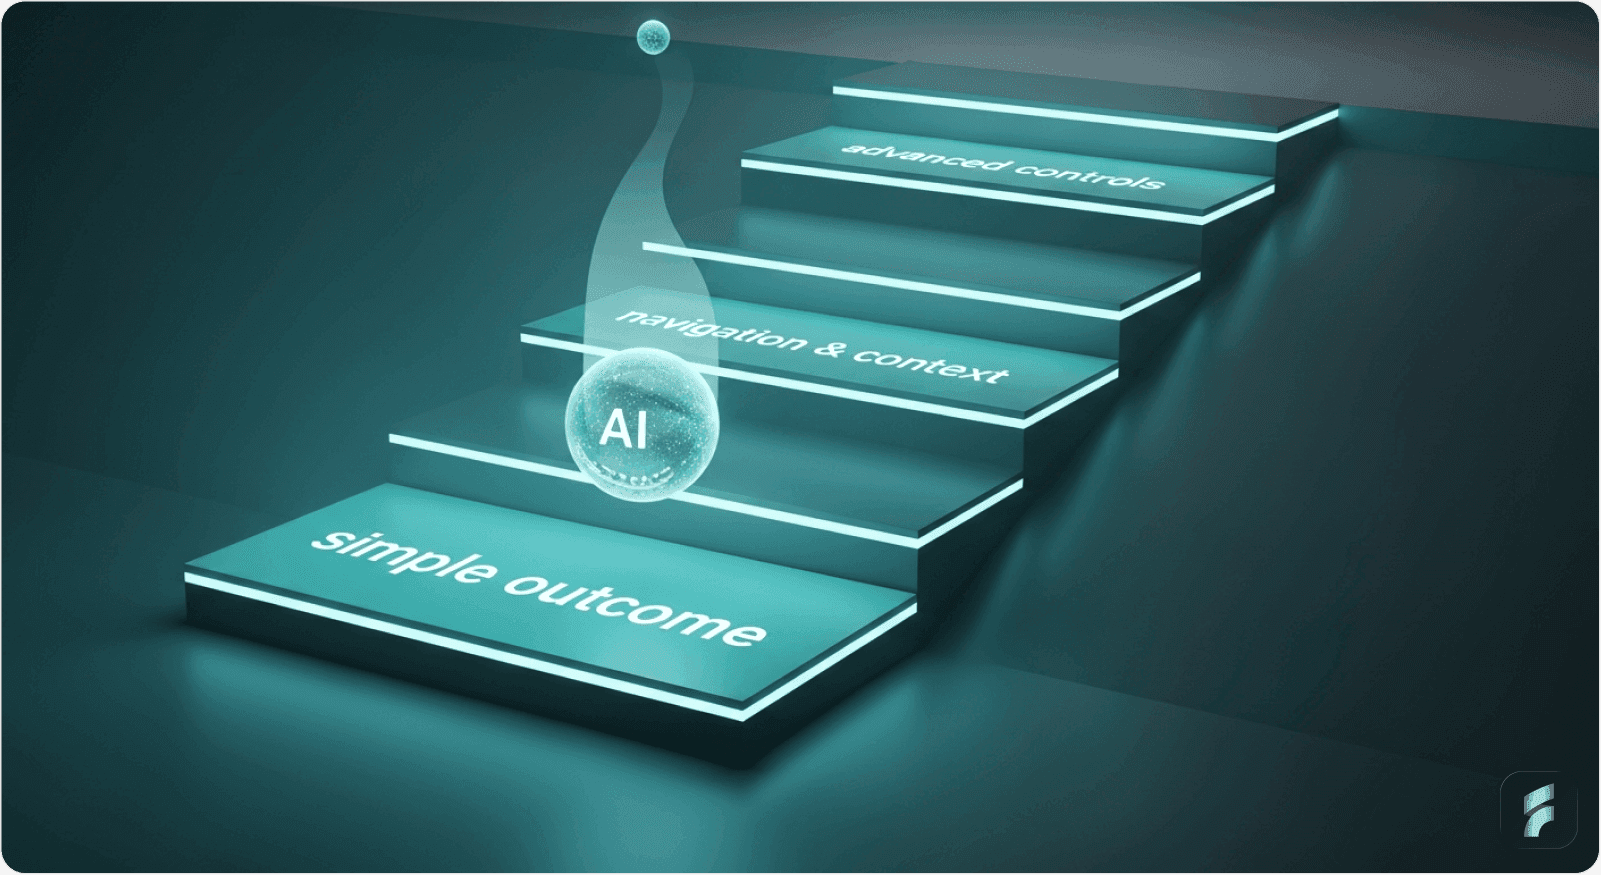
1. Progressive Disclosure: Layering Complexity
The pattern that works:
Layer 1 (Initial Contact): Single, clear outcome.
Bing's AI chat introduces itself simply: "Hi, I'm Bing. Your AI-powered copilot for the web." No technical jargon. One clear value proposition.
Layer 2 (First Usage): Once users engage, reveal just enough to navigate.
Show where they can click for more options. Introduce conversation styles or settings, but only when they're relevant to what the user is trying to do.
Layer 3 (Exploration Phase): Advanced users eventually want more control.
Fine-grained settings, customization, explainability modes—offer them here. But don't make Layer 1 and Layer 2 users feel like they're using a "crippled" version.
The key is making each layer feel sufficient.
A beginner should not feel they're missing something. They should feel they're using a well-designed tool that matches their sophistication level.
UX research by Adaptive Path demonstrates that progressive disclosure reduces perceived complexity by 47% while maintaining 94% feature accessibility for advanced users.
Progressive Disclosure Benefits
Quick Breakdown:
Reduced cognitive load: 47% decrease
Higher completion rates: 41% increase
Maintained feature access: 94% for power users
Lower abandonment: 52% reduction
2. Workflow Redesign: AI as Catalyst, Not Add-On
If your product is "spreadsheet + AI feature to suggest formulas," you're fighting the entire paradigm.
If your product is "formula builder that suggests what you might want," you've redesigned the workflow.
The design question shouldn't be "How do we expose this AI capability to users?"
It should be "How would this workflow be designed if it could be AI-native from the start?"
Then work backward to implement that vision.
McKinsey research confirms this: organizations that succeed at digital transformation do so by completely redesigning processes for what's newly possible, not by grafting technology onto unchanged workflows.
IDEO innovation research shows that AI-native workflow design increases task efficiency by 58% and user satisfaction by 63% compared to AI-augmented traditional workflows.
Learn how to build product experiences that put users first.
3. Value Communication: Translate Tech to Outcomes
Here's the structural framework for communicating value without jargon:
Don't Say | Say Instead | Why |
|---|---|---|
"Our model uses a transformer architecture with 150B parameters trained on..." | "This learns from patterns in your data and gets smarter over time" | First is incomprehensible; second is intuitive |
"Advanced ML algorithm with 87% accuracy on test sets" | "Catches the error 9 times out of 10—but verify on critical decisions" | First creates unfounded confidence; second is honest |
"Supports unlimited customization and tuning" | "Works great out of the box; here's how to optimize for your use case" | First creates complexity burden; second is empowering |
"Cutting-edge deep learning" | "Handles the tedious part so you can focus on decisions" | First is vague; second is concrete |
The pattern: translate technical sophistication into workflow outcomes and human intent.
Every time you want to showcase a technical feature, ask: "What outcome does this enable?"
If you can't articulate the outcome clearly, it probably shouldn't be exposed to users.
Forrester Research on messaging effectiveness shows that outcome-based communication increases comprehension by 71% and purchase intent by 49% compared to feature-based communication.
The Guardrails Principle: Magic Through Constraint
Counter-intuitively, perceived intelligence often increases when you reduce optionality, not increase it.
The Rabbit R1 failed partly because it promised infinite flexibility: "Just tell it anything."
The problem: infinite flexibility creates infinite failure modes.
When the device failed to call an Uber (a fundamentally simple task), that failure felt profound because the marketing had positioned it as capable of anything.
How Successful AI Products Set Boundaries
Successful AI products set clear boundaries:
"I can help with X, Y, Z. I can't do A, B, C."
"This works best when you format your input this way."
"Here's what I'm uncertain about; here's how I'm confident."
These constraints are not limitations to minimize. They're features.
They set correct expectations. They prevent users from finding failure modes and losing trust.
Claude's approach is instructive: they explicitly document model limitations, hallucination risks, and appropriate use cases.
Rather than positioning this as weakness, it builds trust—"This team understands the real capabilities, not the marketing version."
MIT Trust Lab research demonstrates that explicit capability boundaries increase user trust by 34% and reduce negative support interactions by 41%.
Understanding Friction Scoring
Definition:
Friction scoring quantifies the cumulative resistance users encounter during product interactions. Lower friction scores correlate directly with higher completion rates and better retention.
Micro-Summary
Success requires three pillars: progressive disclosure (layering complexity across user sophistication levels), AI-native workflow redesign (building from scratch, not retrofitting), and outcome-based value communication (translating technical features to user benefits). Guardrails increase trust by 34% and reduce failure discovery by 41%. Constraint creates perceived magic by preventing infinite failure modes.

Part 9: The Uncomfortable Truth
The magic of great AI products isn't that users understand how they work. It's that users trust they work—and can focus entirely on using them to accomplish their goals, never thinking about the technology underneath.
This requires a fundamental mindset shift: from "showcasing technological complexity" to "delivering transparent value through simplicity."
It requires designers to champion the user's problem in every design and positioning decision, not the elegance of the solution.
It requires ruthless prioritization of core outcomes over comprehensive customization.
It requires the courage to say "no" to features that create complexity without measurable value.
Don Norman, author of The Design of Everyday Things, states:
"Good design is actually harder to notice than poor design, in part because good designs fit our needs so well that the design is invisible."
The Fundamental Reality
And most fundamentally: it requires founders to stop confusing "hard to build" with "valuable to users."
Those are different things.
The data proves it:
The 90% failure rate proves it
The 30% abandonment rate proves it
The 70% digital transformation failure rate proves it
Build for outcomes, not for technology.
Build for users, not for investors.
Build for simplicity, not for sophistication.
Product Management Institute research shows that products built with outcome-first methodology show 3.2x higher retention rates and 2.7x faster growth compared to technology-first products.
That's how you convey the magic of AI without overwhelming users.
That's how you build products that don't fail.
That's how you win.
Ready to build better SaaS products? Explore our resources.
Glossary of Key Terms
Activation Friction
The cumulative resistance users experience when attempting to derive initial value from a product. High activation friction correlates directly with abandonment rates during onboarding.
Cognitive Load
The total mental effort required to use a product or complete a task. Each exposed setting, customization option, or choice point increases cognitive load and reduces task completion capacity.
Decision Fatigue Friction
The reduction in cognitive capacity caused by multiple choice points during product interaction. Each decision reduces capacity for primary tasks by approximately 12-15%.
Expectation Elevation Risk
The phenomenon where sophisticated technical positioning increases user expectations and reduces error tolerance. Every 10-point increase in perceived sophistication correlates with a 15% decrease in error forgiveness.
Friction Scoring
A quantification method for measuring cumulative user resistance during product interactions. Lower friction scores correlate with higher completion rates and better retention metrics.
Information Hierarchy
The structural organization of content based on user priorities and cognitive capacity. Effective hierarchies prioritize outcome visibility over mechanism transparency.
Interaction Cost
The total effort—measured in steps, cognitive load, and context switching—required to complete a task. Formula: (Number of Steps × Cognitive Load per Step) + Context Switching Penalty.
Mental Models
Users' internal understanding of how a system works. Products succeed when they align with existing mental models rather than forcing users to learn new conceptual frameworks.
Positioning Debt
The accumulated burden created when marketing messages establish expectations that product experience cannot consistently meet. Like technical debt, positioning debt compounds over time.
Progressive Disclosure
A design technique that layers complexity across user sophistication levels, showing basic functionality initially and revealing advanced features contextually as users develop expertise.
Solution Validation Debt
The practice of building products before defining clear success metrics or validating that the solution addresses actual user problems. Common when AI initiatives lack defined KPIs.
Usability Debt
The accumulated cost of feature proliferation and design decisions that increase complexity without proportional value delivery. Typically follows an 80/20 distribution: 80% of features create debt while 20% drive value.
Value Realization Lag
The time gap between AI implementation and actual ROI delivery. For GenAI, typically 18-24 months, which exceeds most CFO patience thresholds of 6-12 months.
Workflow Redesign
The practice of completely reimagining business processes around AI capabilities rather than retrofitting AI onto existing workflows. AI-native redesign increases efficiency by 58% compared to AI-augmentation.
Explanation Backfire Effect
The phenomenon where technical explanations intended to build trust actually reduce it by 34% when users lack domain expertise to evaluate the explanation's validity.


