


Last Update:
Table of Contents
No headings found in Blog Content.
Share

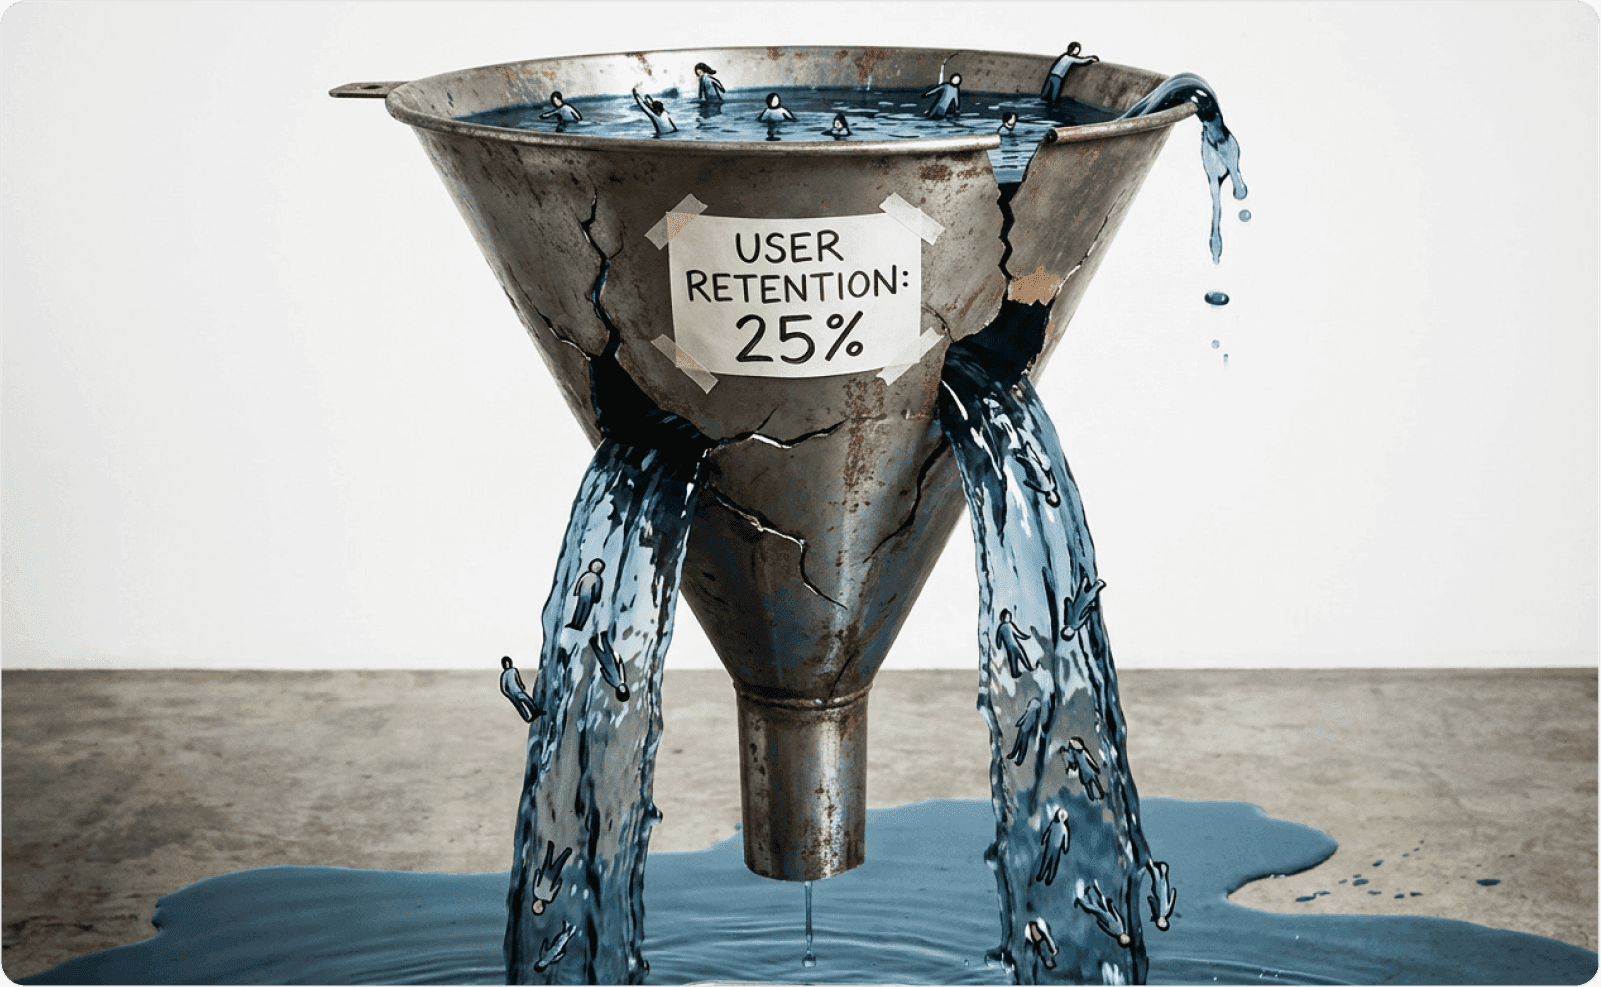
75% of users abandon products within the first week due to poor onboarding—representing a massive revenue leak for most SaaS companies
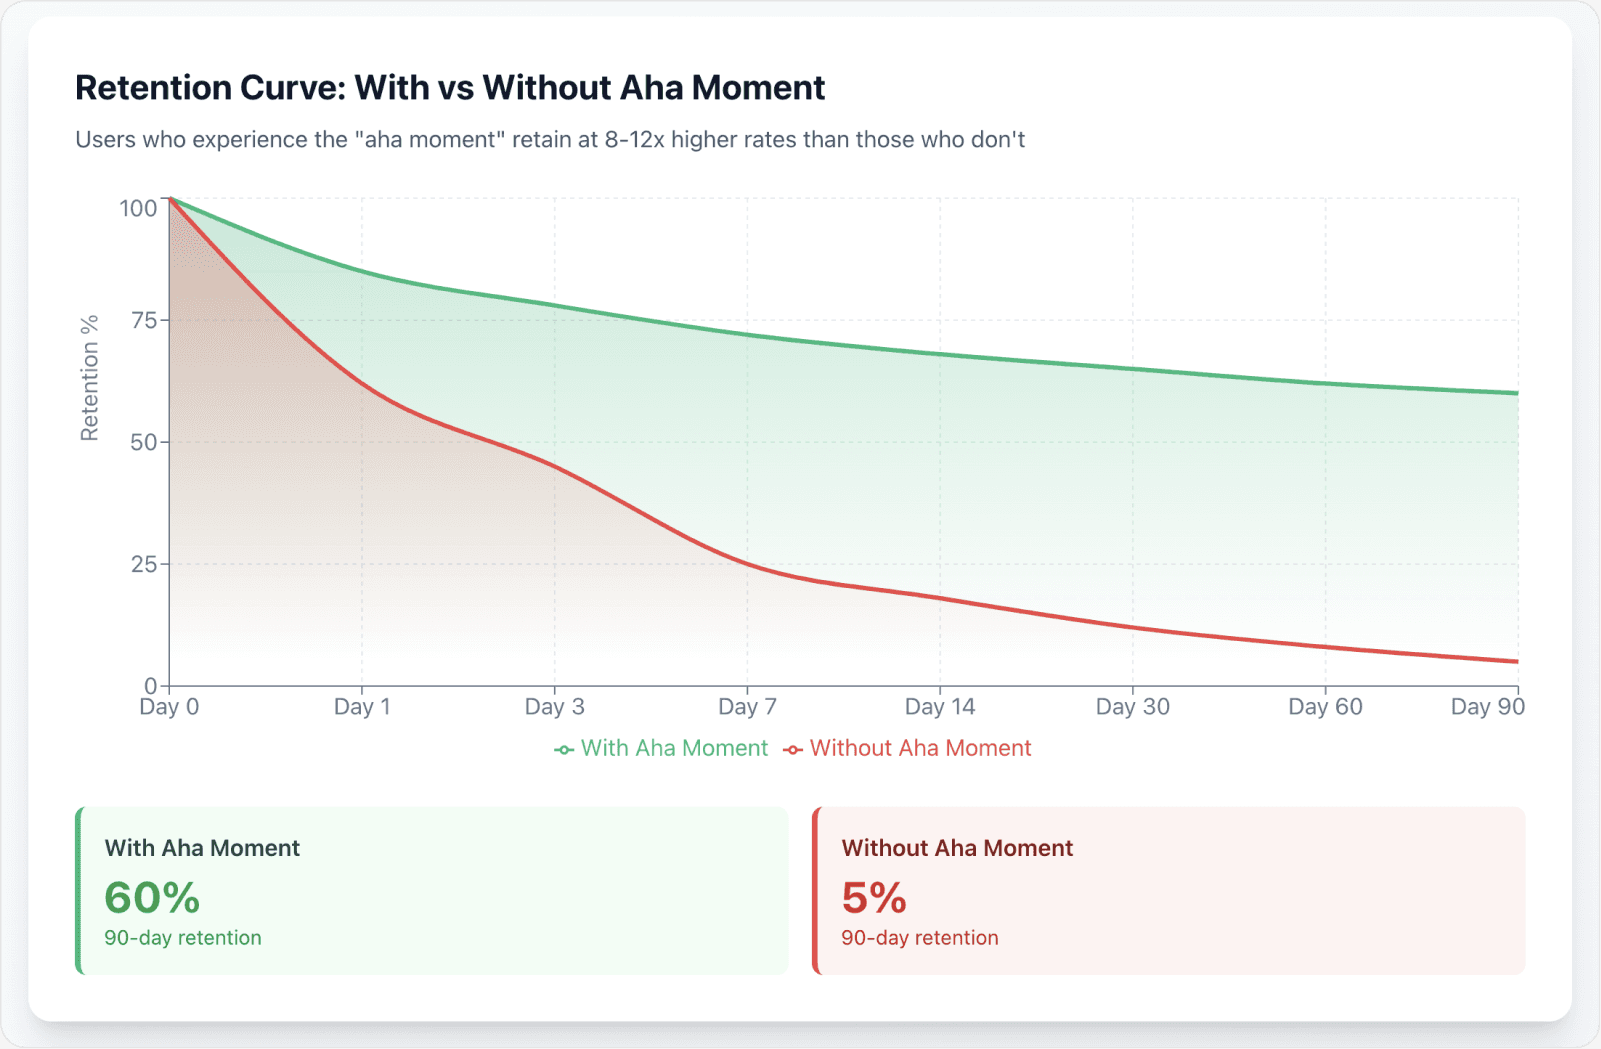
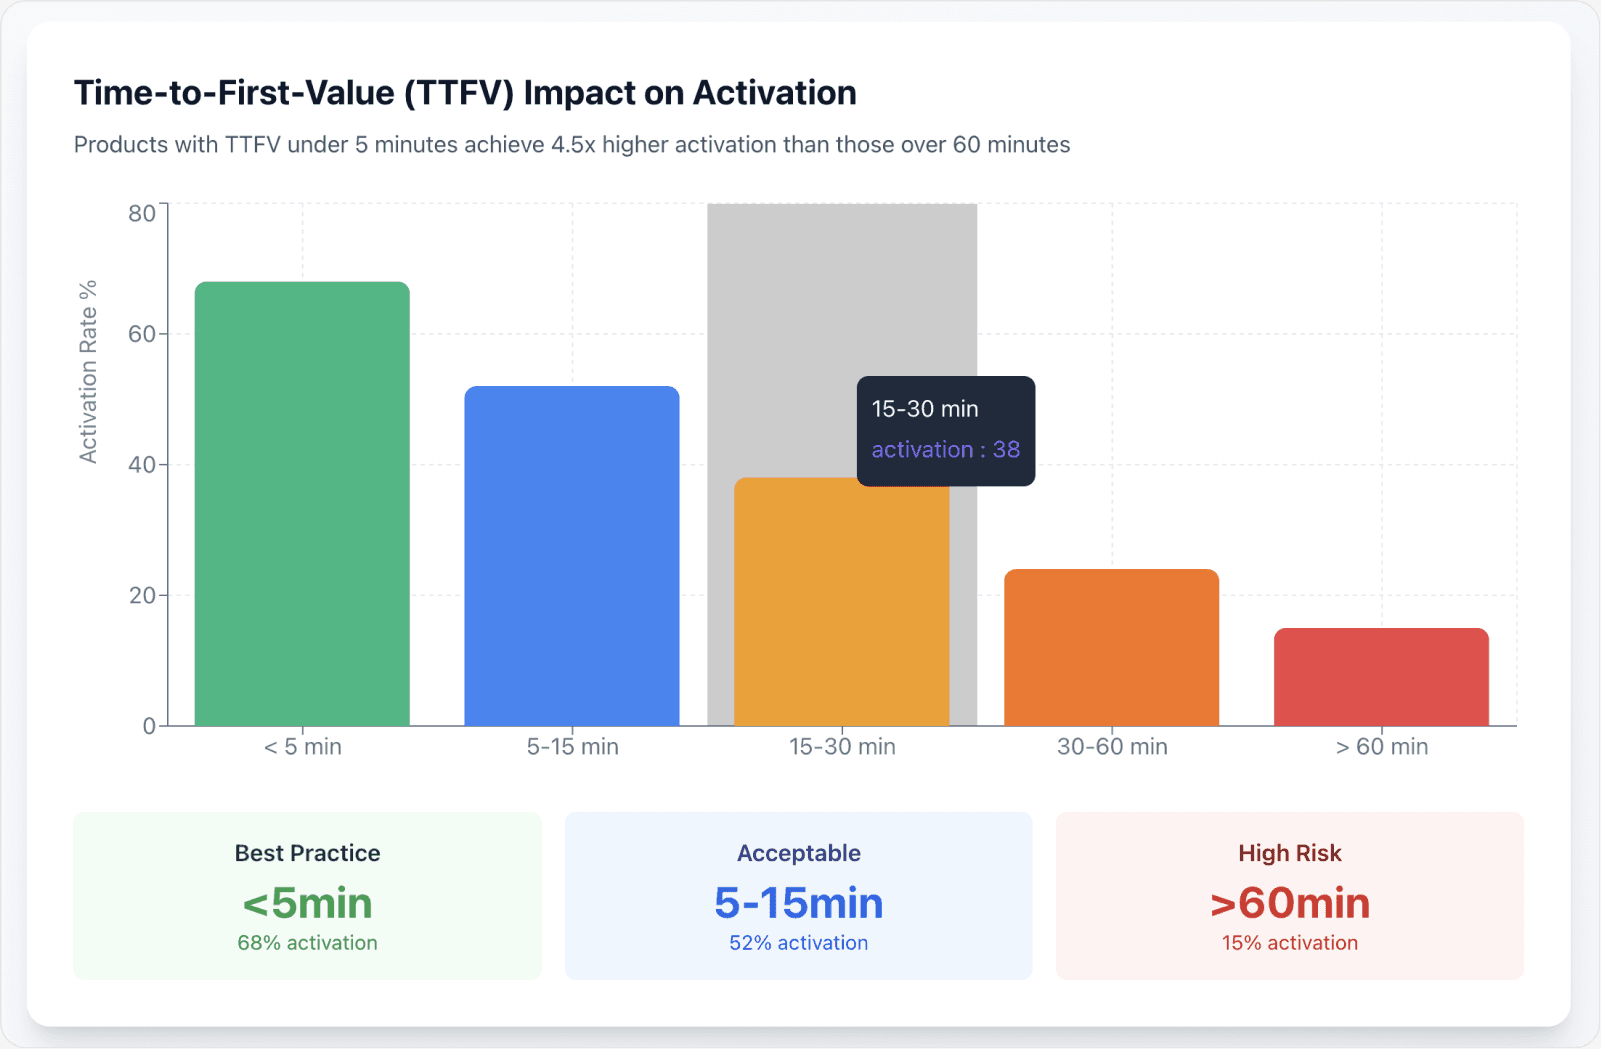
The "aha moment" is critical: Users who experience core product value within 5-15 minutes are 3x more likely to retain than those who wait 30+ minutes
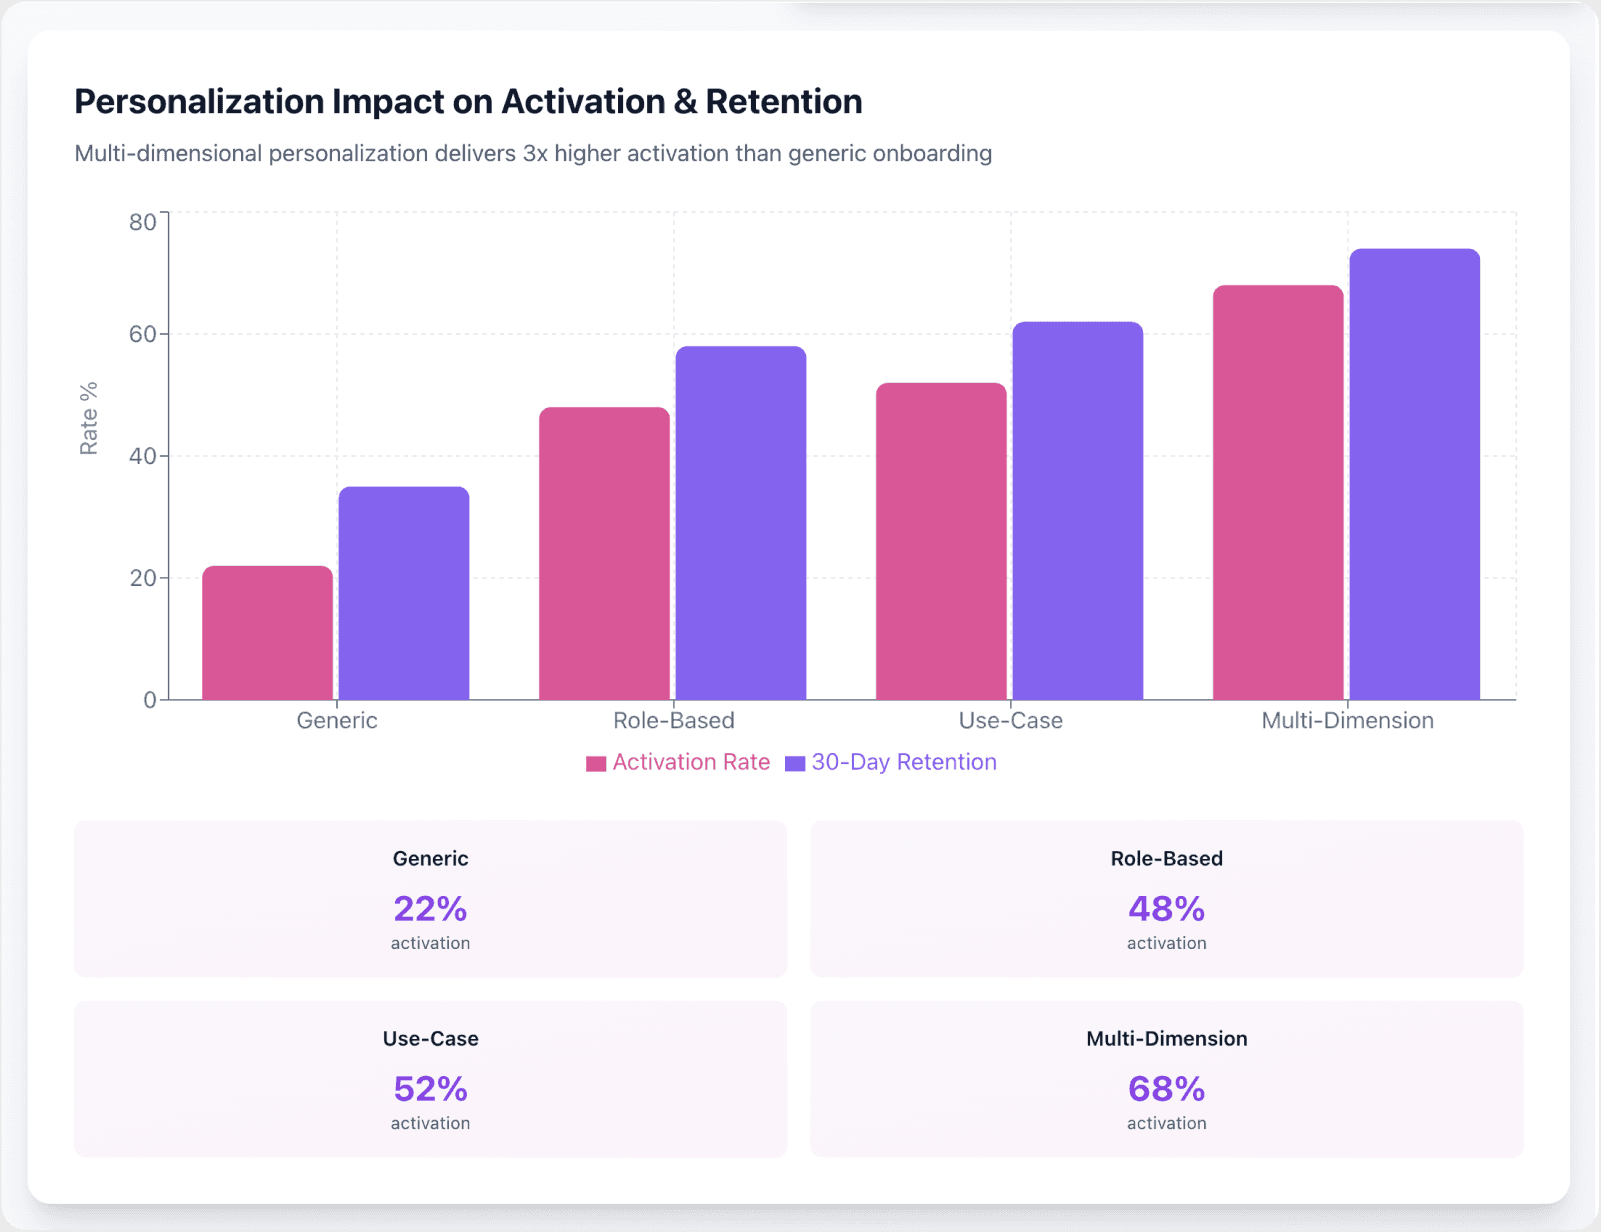
Personalized onboarding increases activation by 30-50% compared to generic, one-size-fits-all approaches
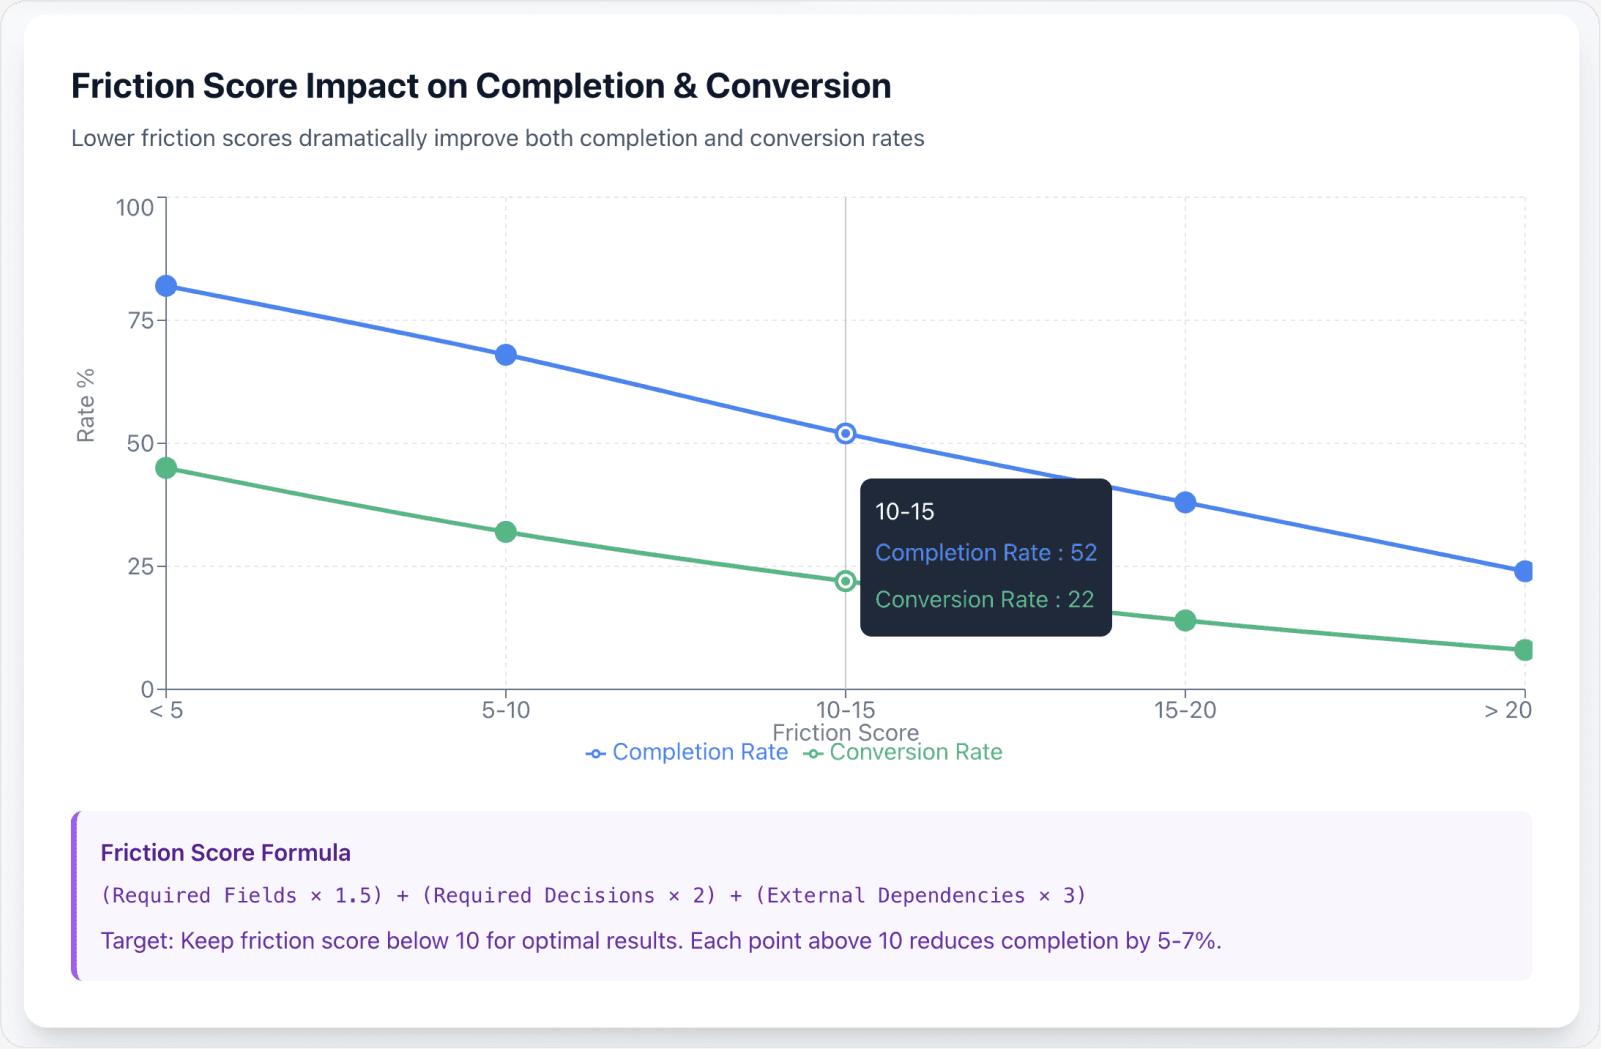
Each additional form field reduces completion by 5-7%—friction elimination is one of the highest-ROI optimization activities
Companies in the top quartile of onboarding effectiveness achieve 2.5x higher customer lifetime value than bottom performers
Introduction
User onboarding is the gateway to retention, activation, and ultimately, revenue in SaaS. Yet, industry data shows alarming rates of early dropoff—up to 75% of new users abandon a product within the first week if onboarding falls short of expectations.
With churn directly impacting profitability, understanding why users disengage and how to reverse the trend is essential for product-led growth companies, design teams, and founders.
According to the Nielsen Norman Group, onboarding represents the highest-risk interaction point in the entire user lifecycle. A poorly designed initial experience creates what researchers call "usability debt" accumulated friction that compounds with each subsequent interaction.
This guide explores the underlying causes of onboarding dropoff, demystifies key technical concepts, and sets out actionable, industry-backed solutions—complete with expert insights and real-world SaaS case studies focused on SaaS onboarding optimization.
The Situation: The Industry Data
The Critical First Week
The onboarding phase is statistically the single highest drop-off point in user journeys across SaaS and B2B platforms.
Critical statistics:
75% of users abandon within the first week due to onboarding issues
68% of users report poor onboarding as their primary reason for leaving a product
89% will switch to competitors after a bad initial experience
Industry Benchmarks
Industry onboarding drop-off rates typically range from 30–50% for SaaS and PLG products. Companies operating above this threshold face significant competitive disadvantage.
According to Gartner, enterprises with optimized onboarding see 50% higher user lifetime value compared to those with generic flows.
Companies you recognize—Slack, Dropbox, Intercom—have made onboarding optimization a strategic priority, treating it as a core growth lever rather than a design afterthought.
The Retention-Revenue Connection
Onboarding is not just an issue of user experience but a direct driver of conversion, activation, and lifetime value.
According to Custify: "Increasing retention by 5% increases profit by up to 95%." This exponential relationship makes SaaS onboarding optimization one of the highest-ROI activities in product development.
McKinsey research indicates that companies in the top quartile of onboarding effectiveness achieve 2.5x higher customer lifetime value than bottom-quartile performers.
Why Users Drop Off During Onboarding

1. Failure to Deliver Immediate Value ("Aha Moment")
The Value Gap Problem
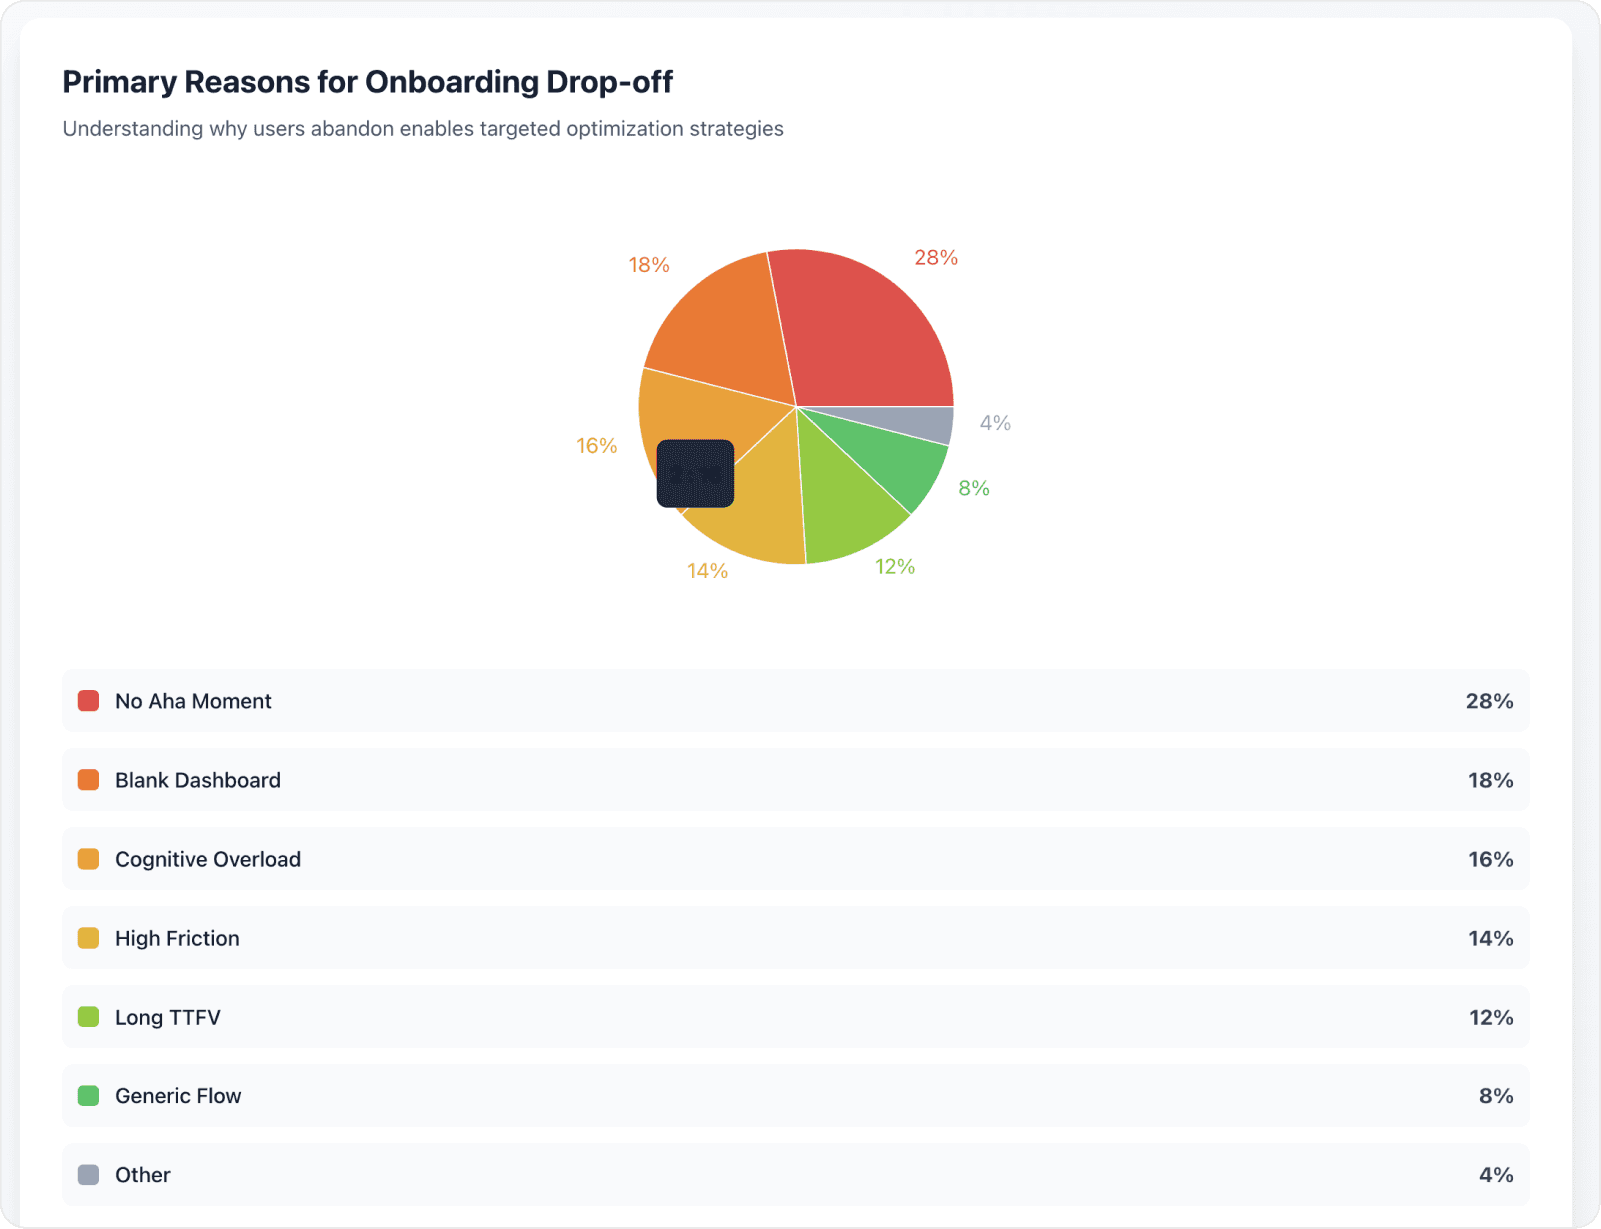
Most drop-offs occur before users have experienced the core benefit—the "aha moment"—that makes a product indispensable.
According to Amplitude, the aha moment is the single user action linked most strongly to retention and activation metrics. This moment represents the cognitive shift where perceived value exceeds interaction cost.
For Dropbox, it's uploading the first file; for Slack, sending the first message. These actions create what behavioral psychologists call "investment activation"—the point where users mentally commit to the product.
Defining the Aha Moment
Companies that reduce time-to-aha-moment by 50% see corresponding increases in 7-day retention ranging from 25-40%, per internal studies at product analytics firms.
2. Blank Dashboard Problem
The Empty State Dilemma
Users greeted by empty dashboards or "no data available" messages feel lost and uncertain. Rather than a fresh start, a blank state signals lack of direction.
84% of users who encounter blank states without contextual help abandon within the first session, according to UX research conducted by Hotjar.
These "zero-state experiences" decrease the likelihood of continued engagement by eliminating social proof, usage examples, and clear next actions.
3. Cognitive Overload and Feature Sprawl
The Paradox of Choice in Onboarding
Feature tours that overwhelm users with options lead to paralysis and disengagement.
When users face more than 3-4 choices simultaneously during onboarding, decision fatigue sets in and completion rates drop by up to 60%, notes research from the Human-Computer Interaction Institute at Carnegie Mellon.
Progressive Disclosure as Solution
Progressive disclosure is critical—show only the essential feature at each stage, then reveal more as users advance. This technique reduces cognitive load by limiting the information hierarchy to what's immediately actionable.
Each step should have a single primary action with a friction score under 2.0 (measured by clicks + form fields + cognitive decisions required).
4. Friction in Signup and Setup
Activation Friction Analysis
Upfront payment requirements, excessive form fields, and complex configuration steps introduce friction before users can see any value.
Each additional form field reduces completion by an average of 5-7%.
The Friction Equation
Friction Score = (Required Fields × 1.5) + (Required Decisions × 2) + (External Dependencies × 3)
Leading SaaS companies target friction scores below 10 for initial signup. Anything above 15 correlates with abandonment rates exceeding 50%, according to Baymard Institute's checkout usability research.
5. Time-to-First-Value Too Long
The TTFV Benchmark
If users don't experience meaningful value within 15–60 minutes (time-to-first-value or TTFV), they are far more likely to abandon. Industry leaders like Slack target TTFV under five minutes.
Products with TTFV exceeding 30 minutes experience 3x higher abandonment than those under 10 minutes, according to product growth research from Reforge.
Measuring First Value
First value is distinct from first feature usage—it represents the moment users achieve a meaningful outcome aligned with their adoption intent.
Companies that instrument and optimize time-to-first-value see retention curve improvements of 15-35% within 60 days of implementation, according to ProductLed Institute.
6. Misaligned Messaging and Reality
The Expectation Gap
A disconnect between marketing promises and actual onboarding experience leads to disillusionment and early churn.
Harvard Business Review research shows that expectation misalignment is responsible for 23% of early-stage churn—more than technical issues or pricing concerns.
7. Generic, One-Size-Fits-All Onboarding
The Personalization Imperative
Without personalization—role-based, use-case-specific, or intent-driven—onboarding fails to inspire user confidence and perceived relevance.
Personalized onboarding flows increase activation rates by 30-50% compared to generic experiences, according to research from product growth consultancy Reforge.
Users form mental models based on their specific use case. Generic onboarding forces unnecessary cognitive translation, increasing interaction cost and reducing perceived fit.
8. Lack of Human Touch or Support
The Support Gap in Self-Service
Automated onboarding alone rarely meets the needs of new users, especially in more complex SaaS offerings.
62% of users who receive proactive support during onboarding complete activation milestones, compared to 34% who experience purely automated flows, according to Intercom's customer engagement research.
How to Fix Onboarding Dropoff: Proven Solutions
1. Identify and Accelerate Your "Aha Moment"
Discovery Process
Use analytics to pinpoint the feature or user action most strongly correlated with long-term retention. This requires cohort analysis comparing users who retained versus those who churned.
Guide every new user to this moment as quickly as possible—just as Dropbox optimized for first-file upload and Slack for initial message sent.
Implementation Framework
Map your retention curve to identify the specific action where retention probability jumps significantly (typically 20+ percentage points). Then engineer your entire onboarding flow to drive users to this action within the first session.
Companies that scientifically identify and optimize for their aha moment see 2-3x improvements in activation rates within 90 days, according to growth research from Sequoia Capital's product leadership team.
2. Implement Progressive Disclosure
The Layered Approach
Break onboarding into digestible steps. Only reveal advanced features once core value is experienced. This prevents cognitive overload and increases engagement.
Each onboarding step should introduce 1-2 new concepts maximum, with clear completion criteria before advancing.
According to usability research from Nielsen Norman Group, progressive disclosure can reduce task completion time by 20-40% while simultaneously improving comprehension.
3. Design Effective Empty States
Zero-State Strategy
Transform blank dashboards into onboarding opportunities: explain why it's empty, show examples, and lead straight to a key action.
Effective empty states include:
Contextual explanation of what will appear here
Visual example of the populated state
Single, prominent call-to-action
Optional: Sample/demo data toggle
Estimated time to completion
Companies like Asana and Notion excel at turning empty states into guided activation moments.
4. Minimize Friction and Early Commitment
The Friction Reduction Framework
Don't collect payment before value is delivered.
Trial users who experience value before entering payment information convert at 2.5x higher rates than those forced to pay upfront, according to SaaS conversion research from ProfitWell.
Practical friction reduction techniques:
Single sign-on options (reduces fields by 6-8)
Smart defaults based on industry/role
Optional fields clearly marked
Progress-saving for multi-step flows
Pre-populated templates
Each friction point removed typically improves completion rates by 3-8%, according to form optimization research from Formstack.
5. Optimize Time-to-First-Value
The Speed Imperative
Drive users to success (activation) within minutes, not hours. Use onboarding checklists, interactive walkthroughs, templates, and self-service resources.
TTFV optimization tactics:
Pre-configured templates for common use cases
Import/integration wizards that automate setup
Sample data that demonstrates functionality
Skip options for non-essential configuration
Async setup (configure in background while user explores)
The difference between 5-minute and 30-minute TTFV is often the difference between 60% and 30% activation rates, according to product growth research from Andreessen Horowitz's growth team.
6. Segment & Personalize
Role-Based Onboarding
Deliver role- and intent-based onboarding. Marketers, engineers, admins, and general users should each receive a tailored experience to maximize relevancy.
Segmentation approaches:
Role-based (end user vs. admin)
Use case-based (integration vs. standalone)
Industry-based (healthcare vs. finance)
Company size-based (SMB vs. enterprise)
Technical proficiency-based (beginner vs. expert)
Segment CEO Peter Reinhardt reports:
"We doubled activation by personalizing onboarding for role, industry, and use case."
Companies implementing segmented onboarding see 25-50% higher engagement in first-week feature adoption, according to Pendo product analytics.
7. Provide Multi-Touch, Multi-Channel Support
Omnichannel Guidance
Combine in-app guides, contextual emails, live chat, and optional onboarding calls for high-touch solutions.
Abandoned onboarding recovery campaigns can recapture 15-25% of users who initially dropped off, according to lifecycle marketing research from Autopilot.
Support channel strategy:
In-app tooltips for immediate context
Email sequences with progressive education
Chatbot for instant answers to common questions
Optional live onboarding calls for enterprise/complex use cases
Video tutorials embedded at decision points
8. Measure and Iterate
Analytics Framework
Track funnel dropout, activation, and completion rates using Mixpanel or Amplitude. Identify where users abandon and run rapid experiments to improve.
Key metrics to instrument:
Signup-to-activation rate
Time to first value (TTFV)
Onboarding completion rate by step
Feature adoption within first week
Correlation between actions and 30-day retention
Companies that run weekly onboarding experiments improve activation 5-10% per quarter, according to growth experimentation research from Reforge.
9. Set Clear Expectations
Progress Transparency
Checklists and progress bars reassure users about what's next and drive momentum. These elements leverage the Zeigarnik effect—our psychological need to complete unfinished tasks.
Visual progress indicators can increase onboarding completion by 20-30%, according to behavioral design research from Stanford's Persuasive Technology Lab.
Real-World Examples
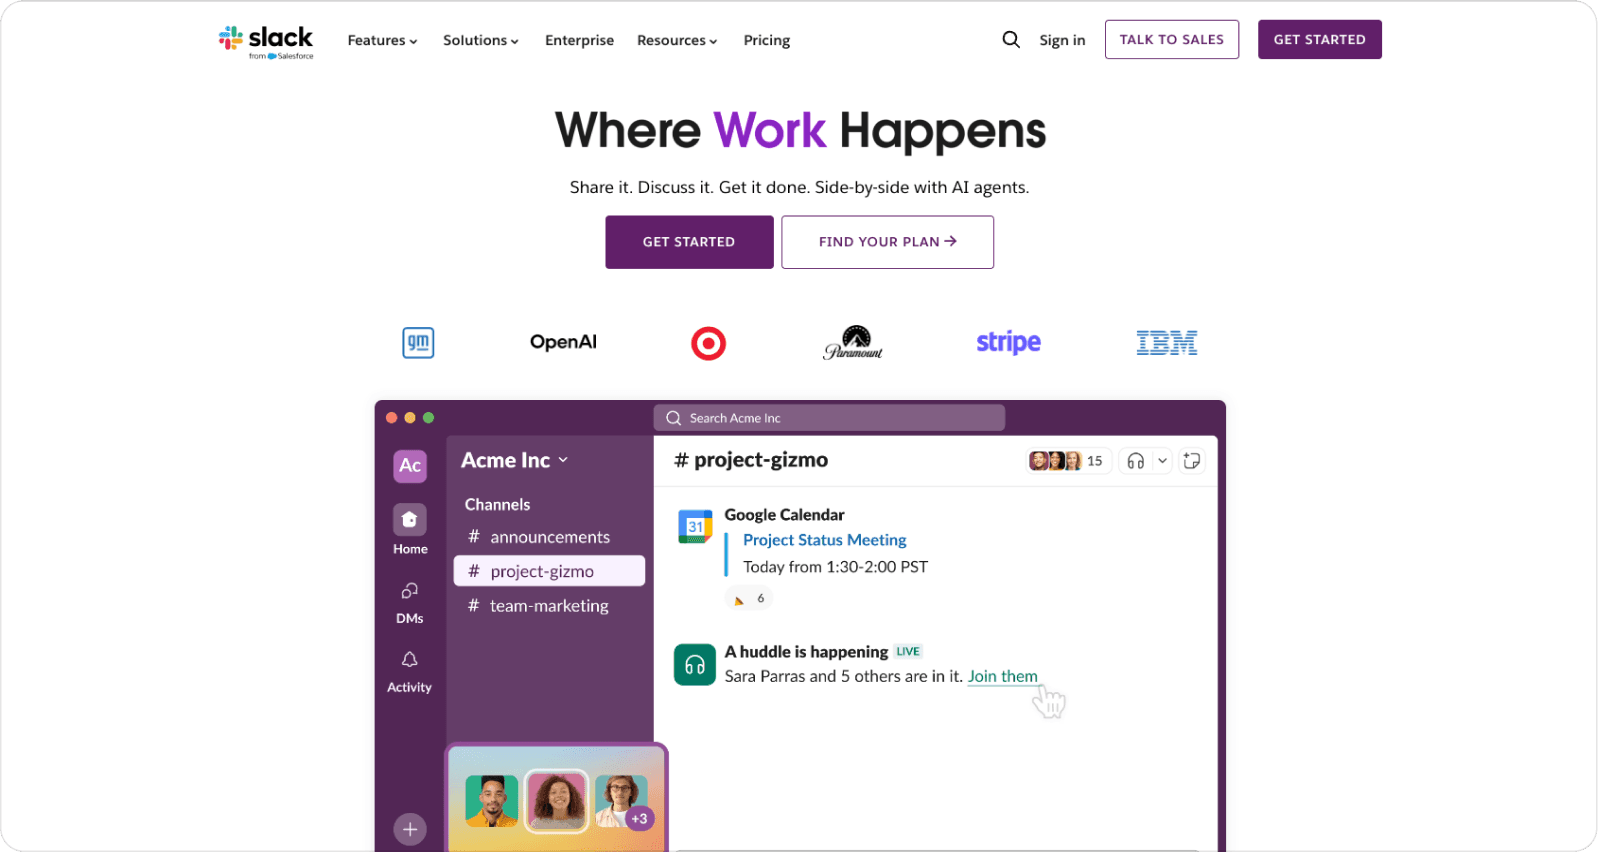
Slack: Speed to First Value
Focused onboarding brings users to the "send first message" moment within seconds. Slack's onboarding flow has just 3 core steps before users can experience the product's value.
Their approach includes:
Pre-populated channel with helpful bot
Suggested first message
Immediate demonstration of real-time communication
This streamlined approach contributes to Slack's industry-leading 93% daily active usage rate among adopted teams.\
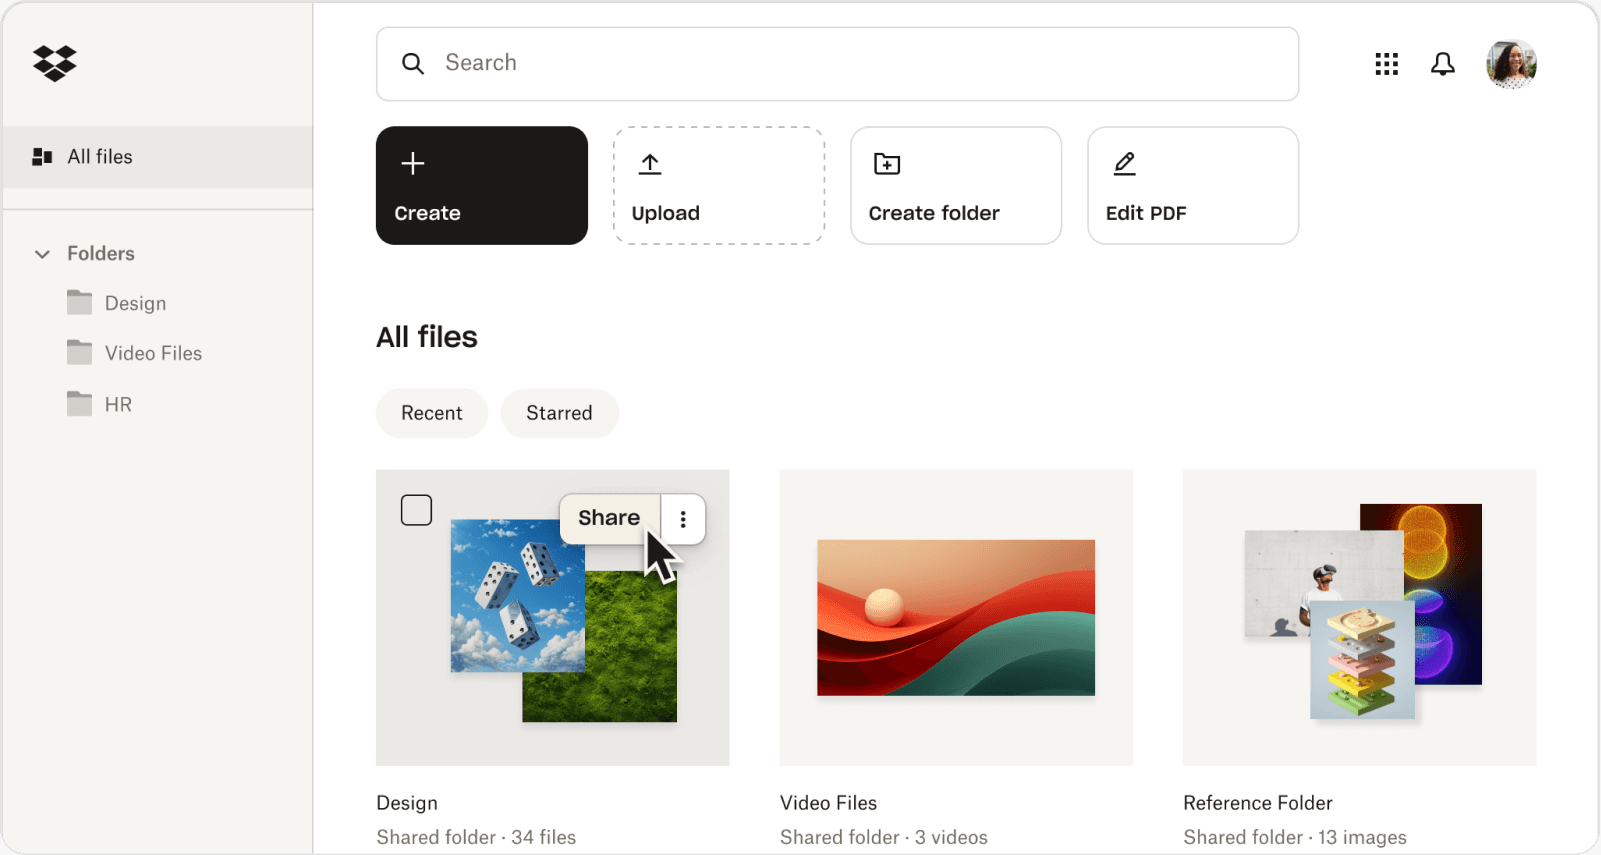
Dropbox: Use-Case Personalization
Personalized, use-case driven onboarding puts file upload and sharing front and center, powering viral growth.
Dropbox segments users during signup (personal vs. business) and tailors the first-use experience accordingly. Business users see collaboration features first; personal users see file backup.
This segmentation resulted in:
40% higher activation rates
60% faster time to referral (viral loop activation)
25% improvement in 30-day retention
Segment: Role-Targeted Messaging
Role-targeted onboarding messaging increased activation rates by 30–50%.
Segment identifies whether users are developers, marketers, or product managers during signup, then adjusts terminology, examples, and suggested first actions accordingly.

Intercom: Comprehensive Multi-Channel Support
Comprehensive support across channels ensures users get the information they need at every stage.
Their data shows:
Users who engage with 2+ support channels have 50% higher activation
Proactive messages triggered by stalled progress recover 18% of at-risk users
Self-service resources reduce support tickets by 35% while improving satisfaction
Conclusion
Onboarding success isn't luck—it's a system.
The fastest-growing SaaS companies ruthlessly optimize for rapid value, minimize friction, and personalize every step of the user journey. Retention and revenue follow from these foundational improvements.
Companies that master onboarding optimization create compounding advantages: higher activation leads to better retention, which drives stronger word-of-mouth, reducing acquisition costs and accelerating growth.
The Implementation Framework
Measure your current state (baseline metrics)
Identify your aha moment through cohort analysis
Map and eliminate friction points
Implement progressive disclosure
Personalize by user segment
Accelerate TTFV through templates and defaults
Add support at critical drop-off points
Iterate based on data weekly
Key takeaway: Unlock your product's "aha moment," deliver value fast, and track every interaction. The difference between a 1% and 20% activation rate is rarely the product—it's the onboarding.
According to research from Bain & Company, a 5-percentage-point improvement in onboarding completion can translate to 25-50% increases in customer lifetime value when compounded over 12-24 months.
Expert Remarks
Lincoln Murphy (Sixteen Ventures): "The whole purpose of onboarding is to deliver the Desired Outcome—get users to value as fast as possible."
Peter Reinhardt (Segment): "We doubled activation by personalizing onboarding for role, industry, and use case."
Hiten Shah (KISSmetrics): "Don't make users work for value. Remove every unnecessary step."
Amplitude Team: "The aha moment—not signup—is the only onboarding milestone worth optimizing."
Teresa Torres (Product Discovery Coach): "Continuous discovery should extend to onboarding. Talk to users who drop off—their feedback is more valuable than completion analytics alone."
Elena Verna (Growth Advisor): "Onboarding is not a feature—it's the entire first mile of your product experience and deserves dedicated roadmap investment."
Glossary of Key Terms
Activation: The point where a user completes key setup actions and experiences initial product value, typically measured as a milestone that correlates with long-term retention.
Aha Moment: The specific user action or product experience that demonstrates core value and strongly predicts continued engagement. This is distinct from signup or feature discovery—it represents meaningful outcome achievement.
Cognitive Load: The mental effort required to process information and make decisions. High cognitive load during onboarding leads to fatigue, confusion, and abandonment.
Empty State: The interface users see when no data or content has been created yet. Well-designed empty states guide users toward their first action rather than presenting blank confusion.
Friction Score: A quantitative measure of effort required to complete an action, calculated through factors like required form fields, decisions, clicks, and external dependencies.
Progressive Disclosure: A design pattern that reveals complexity gradually, presenting only essential information at each step. This reduces cognitive overload and allows users to build understanding incrementally.
Time-to-First-Value (TTFV): The duration between signup and the moment a user experiences meaningful product value. Industry leaders target TTFV under 5-15 minutes for optimal activation.
Usability Debt: Accumulated friction and confusion from poor design decisions that compounds over time, making each subsequent interaction more difficult.
Zeigarnik Effect: The psychological phenomenon where people remember incomplete tasks better than completed ones and feel compelled to finish them. Leveraged through progress bars and checklists.
Related Resources
Nielsen Norman Group
Onboarding Tutorials vs. Contextual Help (Feb 12, 2024)
Mobile-App Onboarding: An Analysis (Jan 23, 2021)
Baymard Institute
Research Institutions
Harvard Business Review: B2B Customer Onboarding (Apr 23, 2018)
Product Analytics & Growth
Amplitude: What An Aha Moment Is Not (Jun 15, 2025)
Mixpanel: Top 9 User Onboarding Metrics (Feb 18, 2025)
SaaS & Customer Success
Intercom: Complete Guide to Onboarding (Jan 2, 2025)
Sixteen Ventures: Customer Onboarding (Jul 26, 2019)


